Bitcoin Price Gaining Momentum: Will the Rally Continue?
Bitcoin is aiming to rise above the $52,000 barrier as it strives for a new peak. In order to continue on an upward trend in the near future, BTC will need to surpass the obstacle at $52,800.Is the Bitcoin price rally at risk? Unpacking obstacles to further gains.
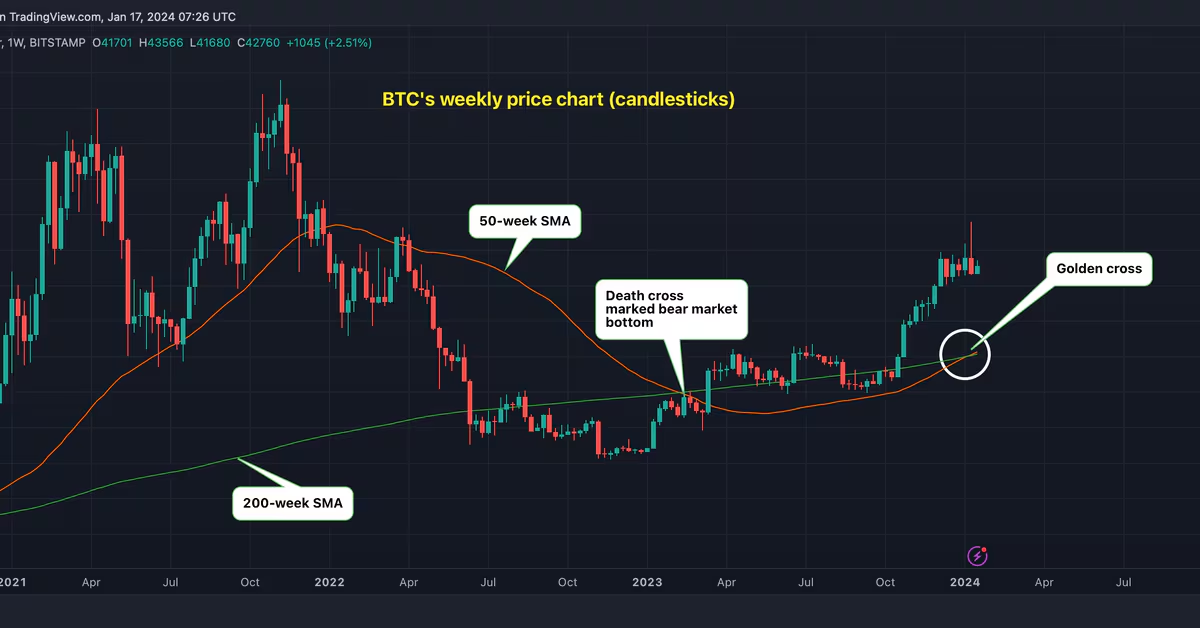
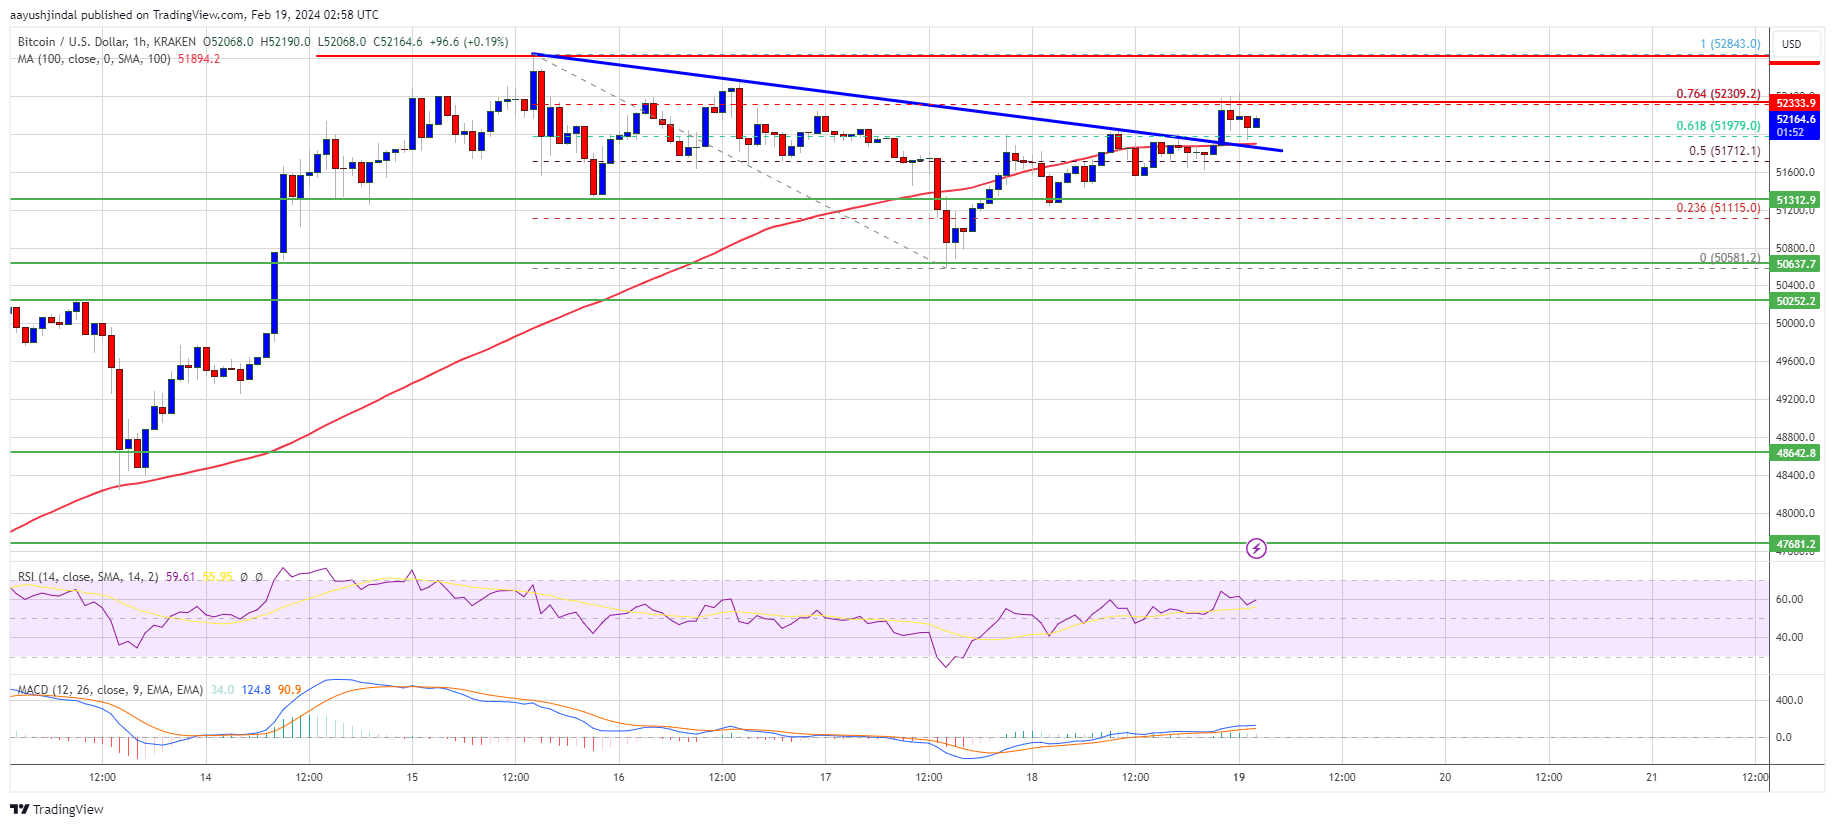 Source: BTCUSD on TradingView.com
Bitcoin price is on the move again, attempting to break above the $52,000 resistance level. As BTC gains momentum, it must clear the $52,800 resistance to sustain its upward trajectory in the near term.
Bitcoin Price Eyes More Gains
After facing initial resistance at the $52,800 level, Bitcoin experienced a slight correction, dipping below $52,000 and $51,500. However, the bulls quickly rallied and prevented further downside as they defended the $50,500 support zone.
Currently, Bitcoin is poised for a fresh increase as it attempts to regain its positive momentum. The price has already surged above the $51,200 and $51,500 resistance levels, with a break above the 50% Fibonacci retracement level of the downward move from the $52,843 swing high to the $50,581 low.
- 💰 Crypto Startups Secure $1.9 Billion in Q4 2023 Venture Funding 💰
- Is BTC Headed To $46,000? Analyst Warns of Potential Correction
- 💥 Bitcoin ETFs See $2.2 Billion Inflows, BlackRock Dominates 💪
Moreover, a significant bullish signal was generated on the hourly chart of the BTC/USD pair, with a break above a key bearish trend line that had resistance at $51,880.
Bitcoin has now climbed back above $52,000 and the 100 hourly Simple Moving Average, indicating growing buyer interest and strength in the market.
Potential Challenges and Key Resistance Levels
While Bitcoin is currently making significant strides, there are a few obstacles it needs to overcome for the rally to continue. The immediate resistance lies around the $52,300 level, which represents the 76.4% Fibonacci retracement level of the downward move from the $52,843 swing high to the $50,581 low.
However, the major test for Bitcoin lies at the $52,800 resistance zone. A successful breakthrough above this level would provide a strong boost to the ongoing rally and potentially propel the price towards the next key resistance at $53,200.
If the bullish momentum persists, Bitcoin could even target the $54,000 resistance level. Beyond that, the next area of interest for the bulls would be around $55,000.
Possibility of Another Downside Correction
Should Bitcoin fail to surpass the $52,300 resistance zone, it might experience another downside correction in the near term. The first level of support on the downside is around $51,850, followed by the critical trend line.
In the event of a sustained downward move, the initial major support sits at $51,300. A close below this level could trigger further bearish momentum, potentially leading the price toward the $50,500 support zone.
Technical Indicators
Examining the technical indicators, the MACD (Moving Average Convergence Divergence) on the hourly chart is showing bullish momentum gaining pace. Additionally, the RSI (Relative Strength Index) for BTC/USD is currently above the 50 level, indicating a bullish sentiment in the market.
Q&A
Q: What is the significance of the $52,800 resistance level for Bitcoin?
A: The $52,800 resistance level is a crucial obstacle that Bitcoin needs to overcome to sustain its current rally. If Bitcoin can successfully break above this level, it opens up the possibility of further price appreciation, potentially pushing the price towards key resistance levels at $53,200, $54,000, and beyond.
Q: What are the major support levels for Bitcoin in case of a downside correction?
A: In the event of a downside correction, the immediate support level is around $51,850, followed by the critical trend line. The first major support is at $51,300, and a close below that level could signal the beginning of a bearish trend, with the price potentially declining towards the $50,500 support zone.
Q: What are the current technical indicators suggesting for Bitcoin?
A: The MACD on the hourly chart is indicating bullish momentum gaining pace, while the RSI for BTC/USD is above the 50 level, indicating a bullish sentiment in the market.
Future Outlook and Investment Recommendations
As Bitcoin continues its upward movement, it is important to keep a close eye on key resistance levels, especially the $52,800 hurdle. A successful breakthrough above this level could signal a further rally, with potential targets at $53,200, $54,000, and beyond.
However, should Bitcoin face another downside correction, it is crucial to monitor the support levels mentioned earlier. A break below these levels could indicate a bearish trend and potentially result in a decline towards the $50,500 support zone.
Always remember to conduct thorough research and exercise caution when making investment decisions in the cryptocurrency market.
References
- Bitcoin Needs to Address Scaling, While ETFs Drive Momentum
- Bitcoin Price Rally May Breach $50,000 This Month: Matrixport
Now that you’re up to date with the latest on Bitcoin, why not share this article with your friends and followers on social media? 🚀
We will continue to update Blocking; if you have any questions or suggestions, please contact us!
Was this article helpful?
93 out of 132 found this helpful
Related articles
- Bitcoin ETFs vs. Gold ETFs: The Battle for Asset Dominance
- MicroStrategy’s $10 Billion Bitcoin Investment: A Testament to Confidence and Long-Term Vision 🚀
- 🚀 Bitcoin ETFs Continue to Soar Despite GBTC Outflows 📈
- Take Control of Your Bitcoin: Exploring Self-Custody Options
- GoFundMe Takes Down Tornado Cash Fundraiser: What You Need to Know 🌪️💸
- Bitwise Bitcoin ETF Surpasses $1 Billion in Assets, Coinmint Faces $14M Fine, and KuCoin Announces Strategic Partnership
- 🚀 ARK Invest Sells Coinbase Stock: What Does it Mean for the Crypto Exchange?