Polkadot (DOT) Price Analysis: Bulls Eyeing $10 Resistance as Rally Gains Momentum 🔥🚀
Polkadot (DOT) is gaining momentum above the $8.80 resistance against the US Dollar. The price may continue its upward trend once it breaks above the $10 barrier.Polkadot’s price is poised to surpass $10 and continue rallying.
📈 Polkadot (DOT) is on a roll! The price has surged above the crucial $8.80 resistance level against the US Dollar, indicating a strong bullish momentum. Can it breakthrough the $10 barrier? Let’s dive into the analysis!
Polkadot Price Restarts Rally
After finding support above the $7.50 level, DOT price has made a remarkable comeback. It has gained over 25% in just a few days, outperforming Ethereum and even Bitcoin at times. 📈💪
The rally gathered steam as the price successfully broke above the $8.50 and $8.80 resistance levels. It even came close to reaching the $10.00 mark, forming a new multi-week high around $9.89. Currently, DOT is consolidating its gains above the 23.6% Fib retracement level of the upward move from the $8.57 swing low to the $9.89 high.
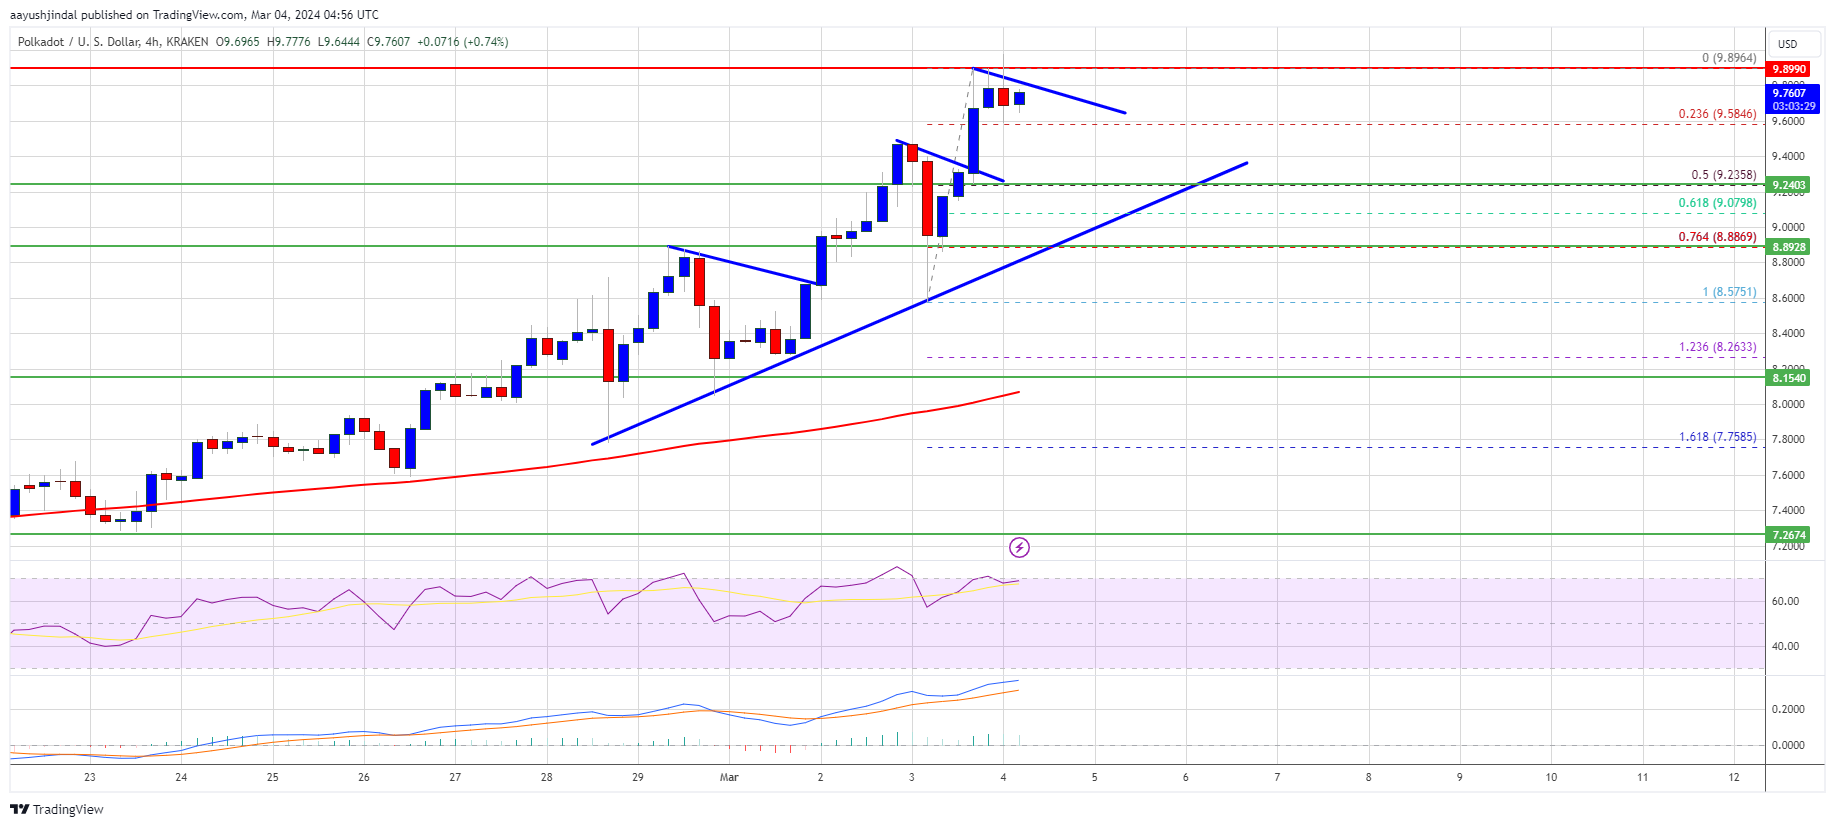
Source: DOTUSD on TradingView.com
- Bitcoin’s Wild Ride: Time for a Pull-Back?
- Bonk Price Hits All-Time High: Is $1 Bonk Inevitable?
- The Rise of DogWifHat and the Meme Coin Market 🚀🐶
🧐 Are Dips Supported in DOT?
If the rally falters and DOT price fails to surpass the $10.00 resistance level, a downside correction may be in play. However, there are key support levels to watch out for:
1️⃣ $9.50 – The first major support level 2️⃣ $9.20 – A crucial support level where a key bullish trend line intersects, also close to the 50% Fib retracement level 3️⃣ $8.80 – A significant support zone that may come into play if selling pressure intensifies 4️⃣ $8.50 – The next major support zone, a breach of which could open the doors for further downside
It’s important to keep an eye on these levels as they can provide opportunities for both buyers and sellers in the market.
📊 Technical Indicators
4-Hours MACD – The MACD for DOT/USD is gaining momentum in the bullish zone, suggesting a continuation of the upward trend.
4-Hours RSI (Relative Strength Index) – The RSI for DOT/USD is above the 50 level, indicating a favorable buying sentiment among traders.
📚 Reference Links
To further deepen your knowledge about Polkadot and cryptocurrency market trends, check out the following links:
- What is Polkadot? A Comprehensive Guide
- The Rise of DOT: Is It the Future of Blockchain Interoperability?
- Comparing Polkadot to Ethereum: The Battle for Supremacy
- Top 5 Coins to Watch in 2021: Polkadot Takes the Spotlight
- How to Invest in Polkadot: A Step-by-Step Guide
💡Remember, knowledge is power in the world of cryptocurrency. Stay informed and make well-informed investment decisions! 💪💰
🌐 Join the Polkadot Revolution
Polkadot’s impressive rally has caught the attention of investors and enthusiasts alike. Are you excited about the future potential of this revolutionary blockchain project? Share your thoughts in the comments section below and let’s connect on social media! 🎉✨
Disclaimer: The above references and opinions are for informational purposes only and should not be considered as financial advice. Always do your own research and consult with a professional financial advisor before making any investment decisions.
We will continue to update Blocking; if you have any questions or suggestions, please contact us!
Was this article helpful?
93 out of 132 found this helpful
Related articles
- AfreecaTV BJ Stars Fall Victim to South Korean Crypto Scammers 🎬💰
- THORChain, Cosmos, and Rebel Satoshi: A Look into the Crypto Market
- Joe Lubin Bullish on Crypto: “Momentum Unstoppable”
- Golden Inu (GOLDEN) Token Soars on MexC Listing
- Cardano (ADA) Poised for a Bullish Surge: Analysts Optimistic
- LUNC Price Soars as Binance Burns Tokens: A Burning Hot Investment Opportunity! 🔥🚀
- Top analyst predicts that Centrifuge (CFG) price is poised for a parabolic rally, according to Blocking.net.