Solana (SOL) Shows Promising Signs of a Price Breakout
Solana Sees Significant Surge Following Correction From 20-Month High of $125 Reached on December 25thSOL Bull Flag Formation on Solana Hourly Chart Indicates Epic Rally Alert, Targeting $163
Solana (SOL), the fifth largest cryptocurrency by market capitalization, has garnered significant attention in recent weeks. After experiencing a correction from its 20-month high of $125 on December 25, SOL has shown signs of a potential price breakout.
A Bullish Continuation Pattern
Technical analysis points to a potential bullish continuation pattern known as a bull flag on Solana’s 1-hour chart. This pattern, identified by analyst Ali Martinez, suggests that SOL may be poised for another upward move.
In a bull flag formation, there is a consolidation period following a strong upward move. In this case, the dip to the $85 level could be considered the consolidation phase. If SOL achieves a decisive close above the $110 resistance level, it would confirm the validity of the bull flag pattern and potentially propel the price to new highs.
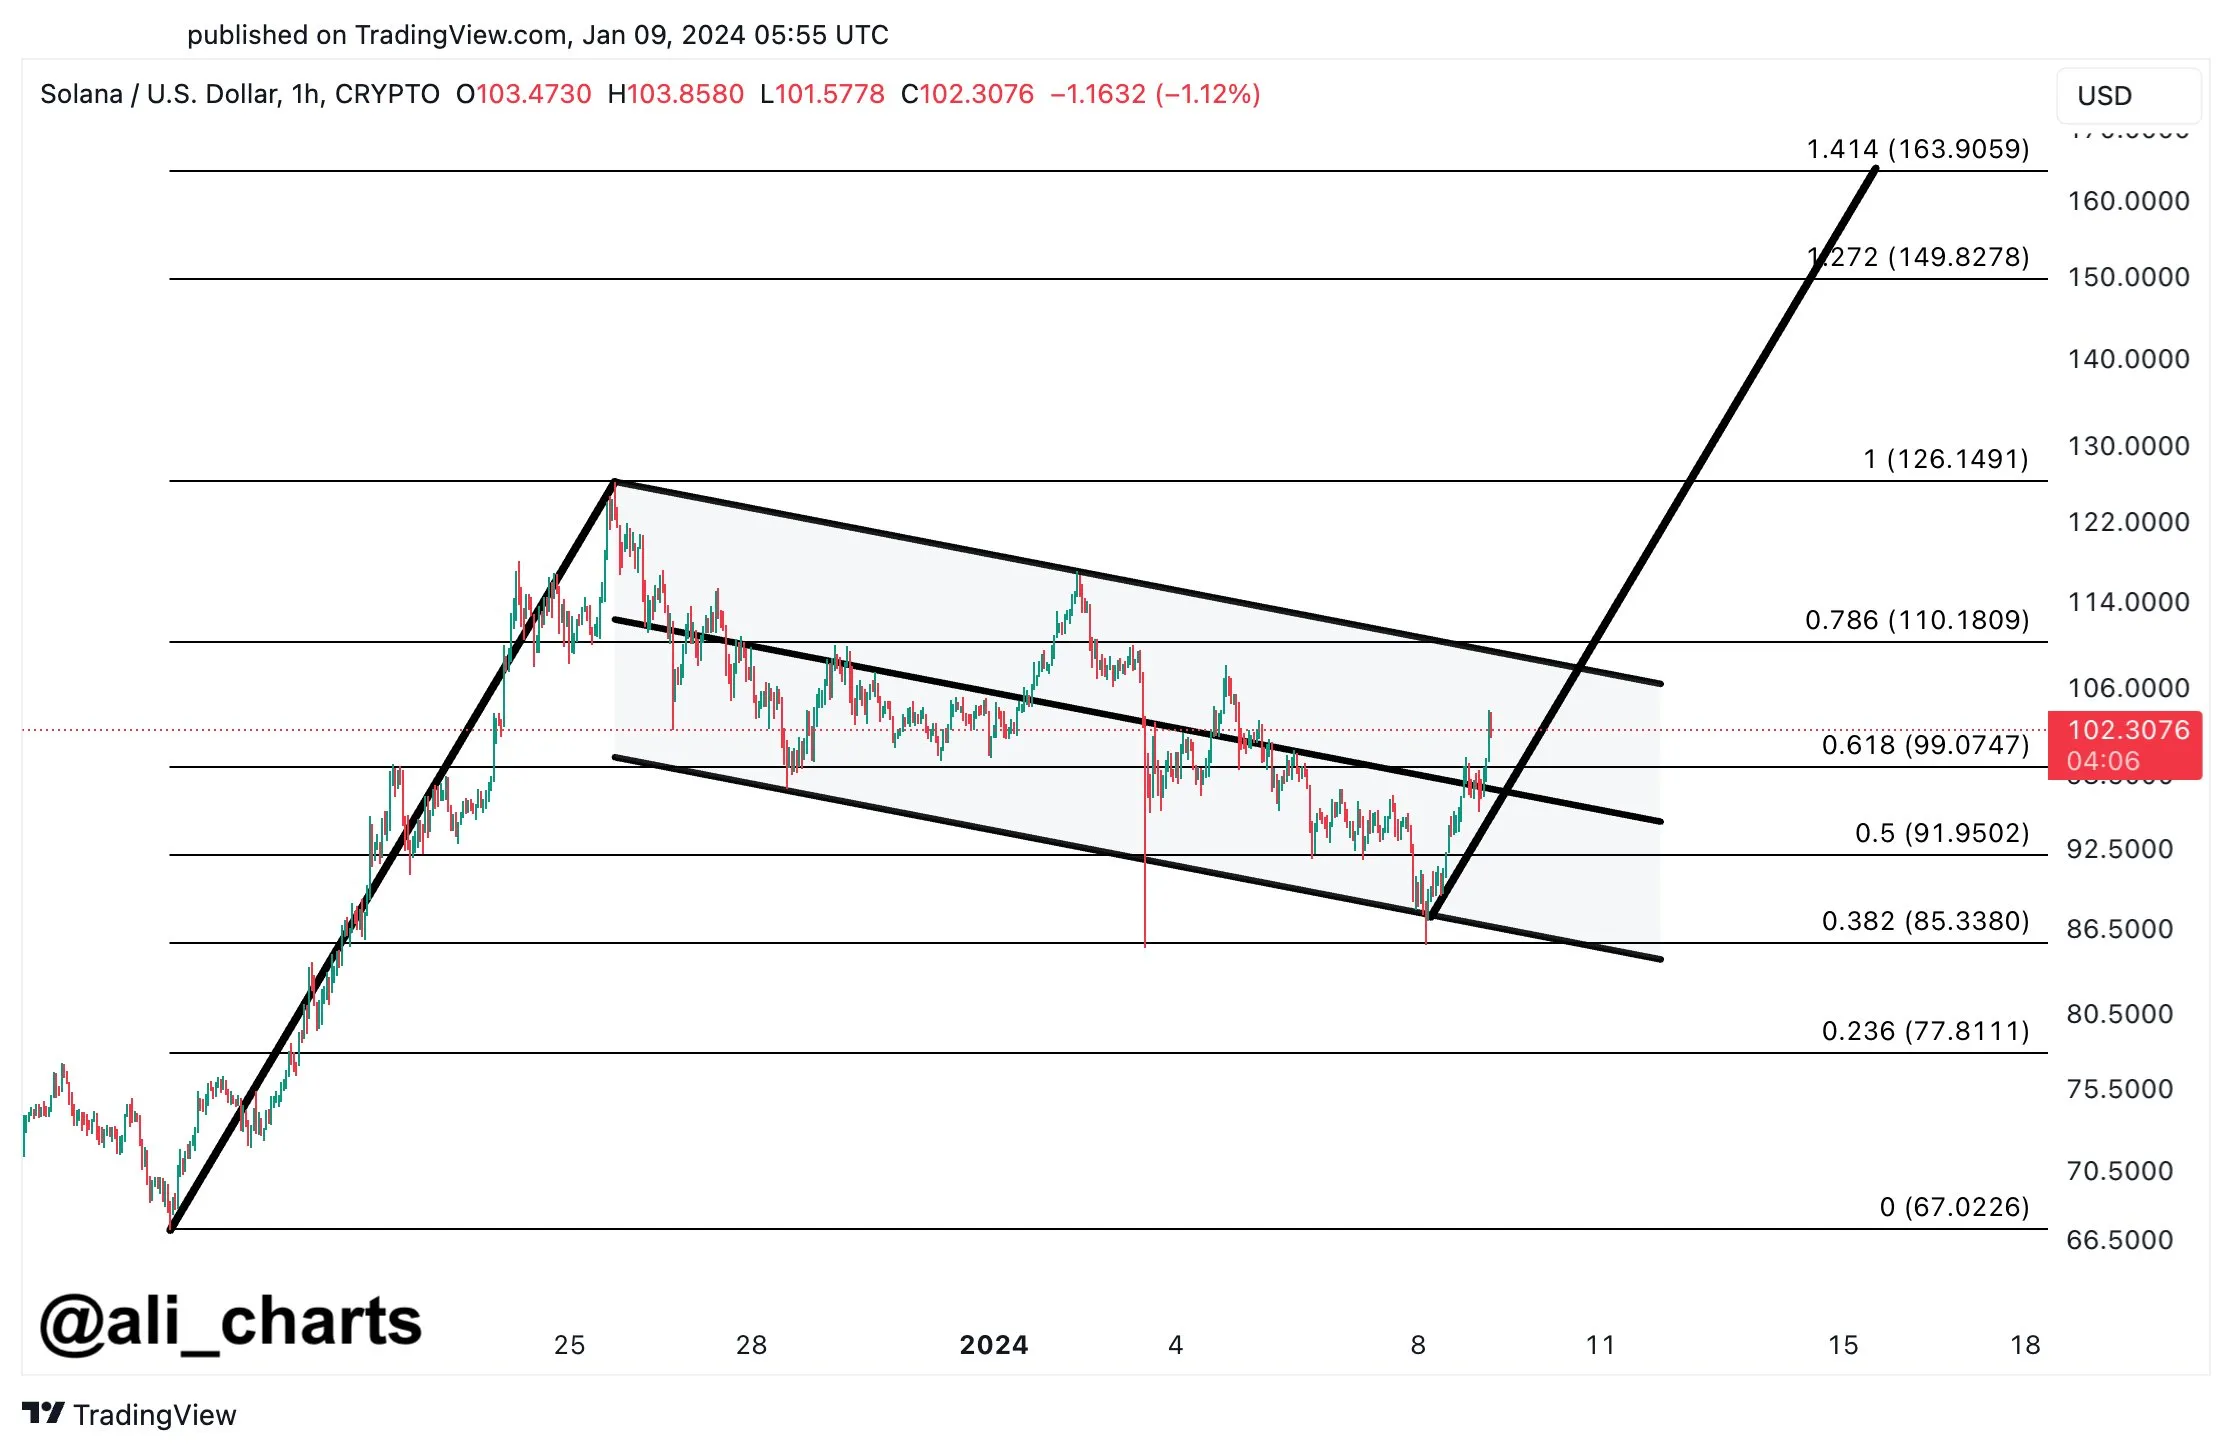 SOL’s bull flag formation on the 1-hour chart. Source: Ali Martinez on X
- Ethereum is poised for a breakthrough as an analyst detects an upward trend.
- BitPay Unveils Enhanced Payment Experience for Cryptocurrency Users
- Digital Currency Group Faces Claims of Unpaid Debts in Genesis Bankruptcy
Overcoming Resistance Levels
While the bull flag pattern suggests the possibility of further price gains, SOL faces multiple resistance levels that must be overcome for the price to reach its full potential. These obstacles include the $110 resistance level, the $120 mark, and the previous 20-month high of $125.
Furthermore, the $132 and $137 levels are anticipated to provide additional resistance, as they were the price points from which SOL’s price decreased in April 2022. Lastly, the $151 and $154 levels will serve as the final thresholds for Solana’s bears to hold if they aim to halt any potential price increase before reaching the ambitious target of $163.
Consistent Growth in Solana’s Ecosystem
Despite the volatility in SOL’s price over the past month, Solana’s blockchain ecosystem has seen consistent growth. According to Token Terminal data, Solana’s circulating market cap has surged impressively to $43.54 billion, representing a substantial 20.08% increase in value over the last 30 days.
Additionally, the fully diluted market cap has surged to $57.13 billion, reflecting an 18.82% growth and signaling strong investor interest in Solana’s potential for future growth.
Solana’s revenue has also experienced substantial growth, with a staggering increase of 217.18% over the past 30 days. On an annual basis, the revenue has reached an impressive $69.12 million, exhibiting a remarkable surge of 142.15%.
Ultimately, Solana’s fees have significantly increased as well, reflecting the network’s growing usage and transactional activity. Over the past 30 days, fees have increased by 217.18% to $11.36 million, amounting to an annualized figure of $138.24 million.
 The daily chart shows the SOL price recovering the $100 mark. Source: SOLUSDT on TradingView.com
Q&A Content
Q: What is Solana’s current market capitalization? A: Solana’s current market capitalization is the fifth largest in the cryptocurrency market.
Q: What is a bull flag pattern? A: A bull flag pattern is a bullish continuation pattern characterized by a consolidation phase following a strong upward move.
Q: What are the resistance levels Solana must overcome? A: Solana faces resistance levels at $110, $120, $125, $132, $137, $151, and $154.
Q: What are the key factors contributing to Solana’s growth? A: Solana’s growth can be attributed to its growing blockchain ecosystem, increasing revenue, and rising transactional activity.
Future Outlook and Investment Recommendations
Based on the bullish continuation pattern and the consistent growth in Solana’s ecosystem, it appears that Solana has the potential to make further price gains. Investors may consider monitoring the price closely and look for a decisive close above the $110 resistance level as a potential entry point. However, it’s important to be cautious and consider the various resistance levels that Solana needs to surpass.
Additionally, investors should stay updated on Solana’s ecosystem growth and revenue performance, as these factors contribute to the long-term potential of the cryptocurrency.
In conclusion, Solana has shown promising signs of a price breakout, and given its growing ecosystem and increasing investor interest, it is worth keeping an eye on this cryptocurrency in the coming months.
Reference List
- Significant Surge in Solana’s Price
- Bullish Continuation Pattern on Solana’s Chart
- Standard Chartered’s Bullish Forecast for Spot Bitcoin ETFs
- Multiple Resistance Levels of Solana
- Token Terminal Data on Solana’s Growth
- Crypto Analysts’ Bullish AI Crypto Coin Forecast
- South Korea’s Major Step Towards Cryptocurrency Transparency
- SOL Price Analysis
Let’s hear your thoughts on Solana’s potential price breakout in the comments below! 👇 Don’t forget to share this article with your friends on social media. 📱💻
We will continue to update Blocking; if you have any questions or suggestions, please contact us!
Was this article helpful?
93 out of 132 found this helpful
Related articles
- Solana Price Prediction: Bouncing Back and Heading for New Highs?
- The Rise of $JTC: Bringing Legal Recourse to the Blockchain
- Bonk Price Prediction: Can it Overtake Shiba as it Skyrockets 30% in 24 Hours?
- 🚀 Discovering Simplicity: An In-Depth Immediate Bitnex Review 🚀
- Volkswagen to Integrate OpenAI’s ChatGPT in Cars with Revolutionary Voice Assistant 🚗🤖
- 🚀 XRP: To Crash or Not to Crash, That is the Question 🚀
- Is the Solana Bubble Truly Bursting? 🎢💥