Bitcoin’s ‘Cup and Handle’ Pattern Signals a Rally to $75,000
Matt Dines spots classic 'Cup and Handle' pattern in Bitcoin price chart, indicating potential surge to $75,000.Expert Bitcoin Could Soar to $75,000 with Cup and Handle Breakout
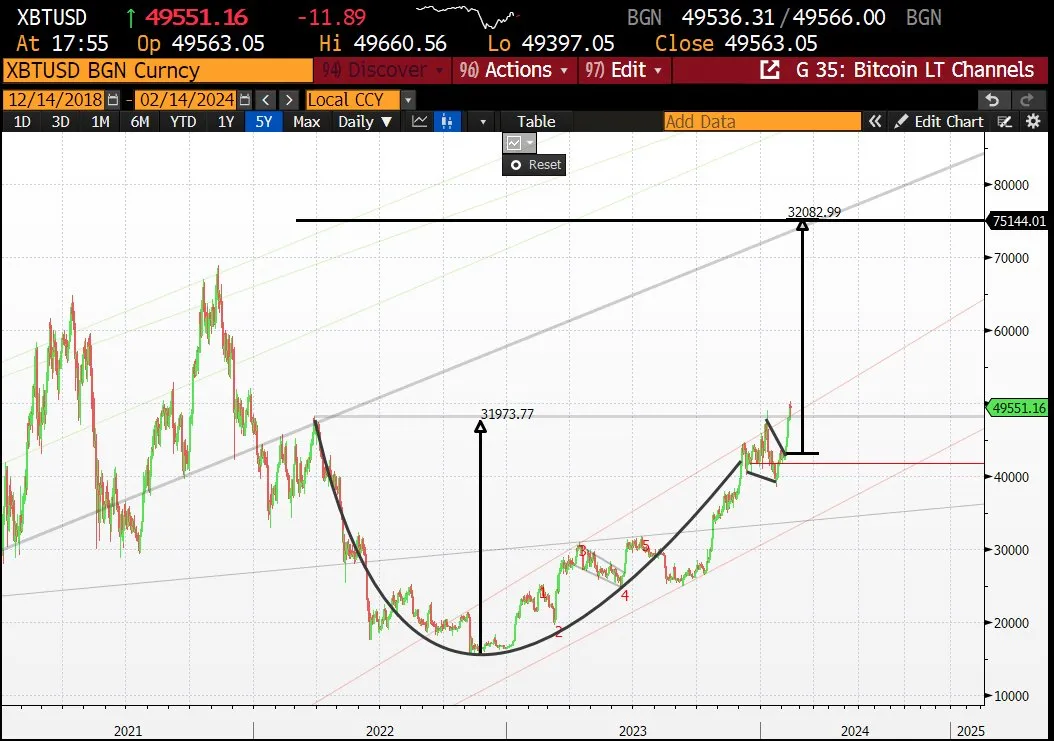 Bitcoin price validates a cup and handle pattern | Source: X @BuildCIO
Bitcoin investors, get ready for a wild ride! Matt Dines, the Chief Investment Officer at Build Asset Management, has identified a classic ‘Cup and Handle’ pattern in the Bitcoin (BTC) price chart. According to Dines, this pattern could potentially lead to a rally to $75,000. 🚀
What is a Cup and Handle Pattern?
Imagine you have a cup of your favorite beverage, let’s say coffee ☕️. Now, picture the cup with a rounded bottom, forming a ‘Cup’ shape. This cup represents a period of consolidation and pause in the downward trend of Bitcoin’s price. It’s like a coffee break for Bitcoin!
Then comes the ‘Handle.’ It’s like that little dip or pullback you experience when you take a sip from your coffee cup. This Handle represents the final consolidation before a breakout to new highs.
- Bitcoin Skyrockets Past $51k and Altcoins Face Stiff Competition: A Crypto Rollercoaster Ride 🚀
- The 5 Billion Dollar Bitcoin Bet: MicroStrategy’s Stellar Success 🤑💰🚀
- Spot Bitcoin ETFs See Massive Inflows in Just Four Days!
How Does Bitcoin’s Chart Confirm this Pattern?
The Cup and Handle pattern began forming in March 2022 when Bitcoin experienced one of its longest bear markets. The price plunged below $48,000 and hit its lowest point at around $17,600, which acted as a strong support level.
Since then, Bitcoin’s price has been steadily recovering, mimicking the right side of the cup. The breakout above $48,000 confirmed the pattern, just like a coffee cup 🥳.
Setting a Price Target
To determine the potential price target, traders measure the height of the cup. In this case, it’s the increase in Bitcoin’s price from its lowest point to the resistance line at $48,000, which is roughly $31,973.
According to Dines, traders often add this height to the bottom of the handle to set their price target. So, if we project this height from the handle’s formation, we get a target around $75,000. That’s one expensive cup of coffee! ☕️💰
Questions & Answers
Q: How reliable is the Cup and Handle pattern in predicting price movements?
A: The Cup and Handle pattern is a widely recognized technical formation and is closely watched by market analysts and traders. While it doesn’t guarantee a price rally, it is considered a strong bullish signal when confirmed. However, it’s always important to consider other factors and indicators before making investment decisions.
Q: Are there any potential risks or drawbacks to relying on the Cup and Handle pattern?
A: Like any technical analysis tool, the Cup and Handle pattern is not foolproof. It’s essential to consider other market factors, such as overall market sentiment, regulatory developments, and macroeconomic conditions, before solely relying on this pattern for investment decisions.
Q: What other indicators or patterns should investors consider alongside the Cup and Handle pattern?
A: Investors should always look at multiple indicators and patterns to make informed investment decisions. Some popular ones include moving averages, trend lines, relative strength index (RSI), and volume analysis. Combining different tools can provide a more comprehensive understanding of the market dynamics.
The Future Outlook for Bitcoin
While the Cup and Handle pattern suggests a potential rally to $75,000, it’s important to consider other factors affecting Bitcoin’s price. The cryptocurrency market is influenced by various aspects such as regulatory developments, adoption by institutions, global economic trends, and investor sentiment.
However, Bitcoin has shown resilience and an ability to bounce back from market downturns in the past. With increasing mainstream acceptance and growing interest from institutional investors, the overall sentiment for Bitcoin remains positive.
Investors should carefully analyze the market, consider their risk tolerance, and diversify their portfolios to make informed investment decisions. It’s always wise to consult with a financial advisor or do thorough research before investing in any asset.
References:
- Bitcoin Price Breaks Past $51,500: 4 Key Reasons
- Bitcoin Open Interest Surges To A 2-Year High, BTC Breaks Above $51,000
- Bitcoin needs to address scaling before ETFs can drive momentum
- Bitcoin news
- Bitcoin price prediction
Now that you’re aware of the potential Bitcoin rally, it’s time to buckle up and enjoy the ride. Don’t forget to share this article on social media and spread the excitement! 🚀💪📈
We will continue to update Blocking; if you have any questions or suggestions, please contact us!
Was this article helpful?
93 out of 132 found this helpful
Related articles
- 🚀 Bitcoin Surpasses $52,000 Milestone: ETF Inflows and Market Optimism Drive the Rally
- Clash of Predictions: Is Bitcoin Headed for a Crash or a Bullish Breakthrough?
- Can Bitcoin bulls surpass the $55K milestone this week?
- Bitcoin and Ethereum Price Surge: A Bullish Sign for the Crypto Market 🚀
- Escrow Services in Crypto: Ensuring Safe and Trustworthy Transactions 🤝💰
- Bitcoin Magazine Partners with Unchained: A New Era for Bitcoin Investors
- Bitcoin reached $51k, but will it hit a new all-time high before halving?