Bitcoin and Top 5 Cryptocurrencies: Price Analysis and Potential Growth
In the near future, Bitcoin's stabilization could redirect attention towards specific altcoins like SOL, AVAX, RNDR, and SUI.Bitcoin’s consolidation within a certain range is preparing the ground for the rise of SOL, AVAX, RNDR, and SUI.
Bitcoin (BTC) has been making steady progress over the weekend, indicating a continued demand from bullish investors. The recent data shared by Bloomberg analyst James Seyffart reveals that BlackRock’s iShares Bitcoin Trust (IBIT) assets under management have crossed the $2 billion mark [^1^]. While a new bull market may not be imminent, Bitcoin is likely to consolidate its gains as traders focus on the inflows into newly launched Bitcoin exchange-traded funds and await the Bitcoin halving in April.
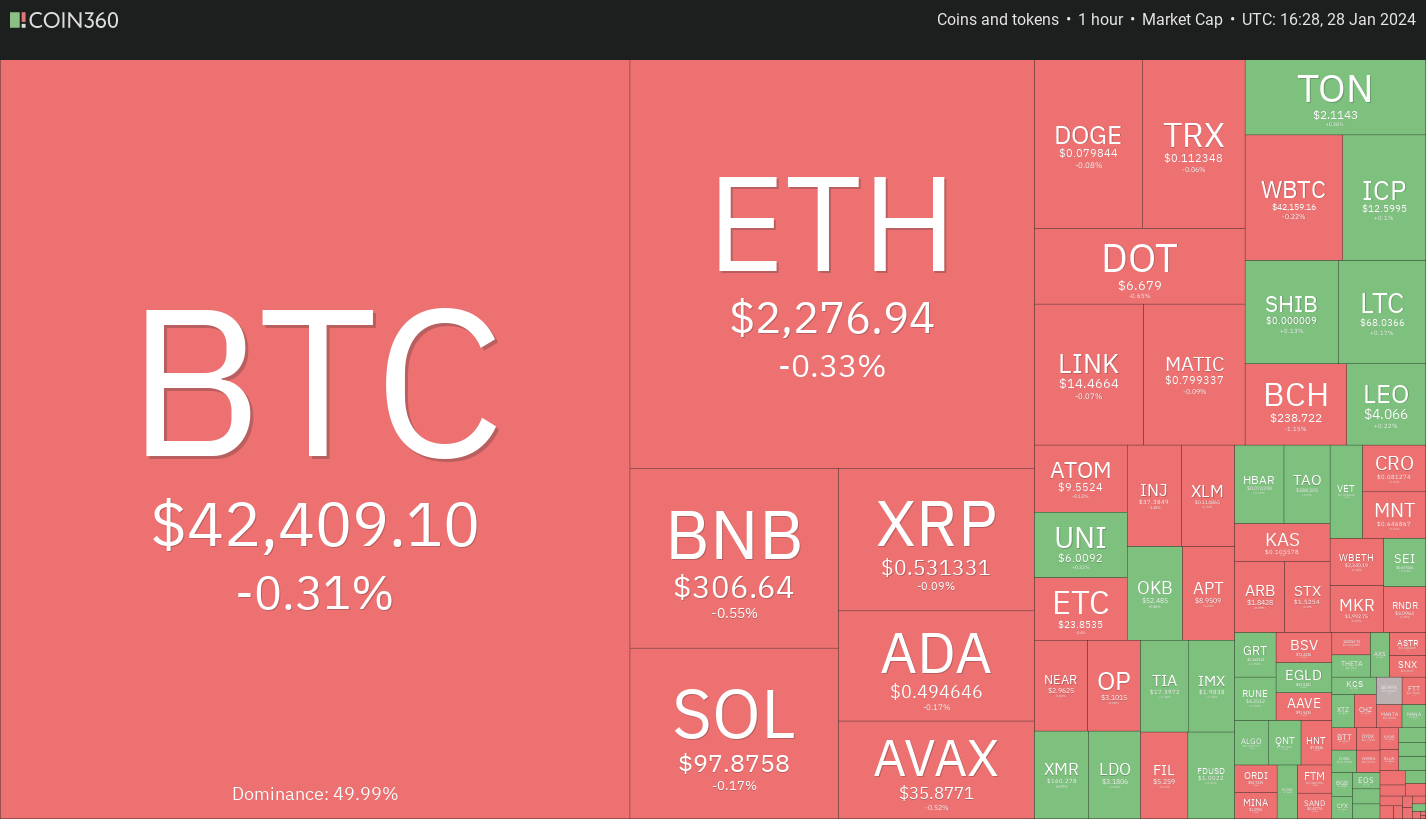 Crypto market data daily view. Source: Coin360
If Bitcoin enters a range, it will be a positive sign as it shows that traders are not rushing to book profits, anticipating a potential uptrend to continue. This can also be good news for select altcoins, which may attract investors’ interest and resume their upward movement.
Bitcoin Price Analysis
Bitcoin saw a rise above the 20-day exponential moving average ($41,959) on January 27th, indicating a reduction in selling pressure [^1^]. Both moving averages have flattened out, and the relative strength index (RSI) is near the midpoint, indicating a balance between supply and demand. As a result, the BTC/USDT pair may trade between $44,700 and $37,980 for some time. However, a break and close above $44,700 will suggest that the buyers are back in control, potentially pushing the price to the local high of $48,970. On the downside, a slide below $37,980 could trigger a deeper correction toward $34,800.
- Understanding Open Interest: A Key Metric in Financial Markets
- China has stopped allowing restricted shares to be lent out due to the unstable stock market conditions.
- The Future is Here: CFTC Looks to Harness the Power of AI in Derivatives Markets
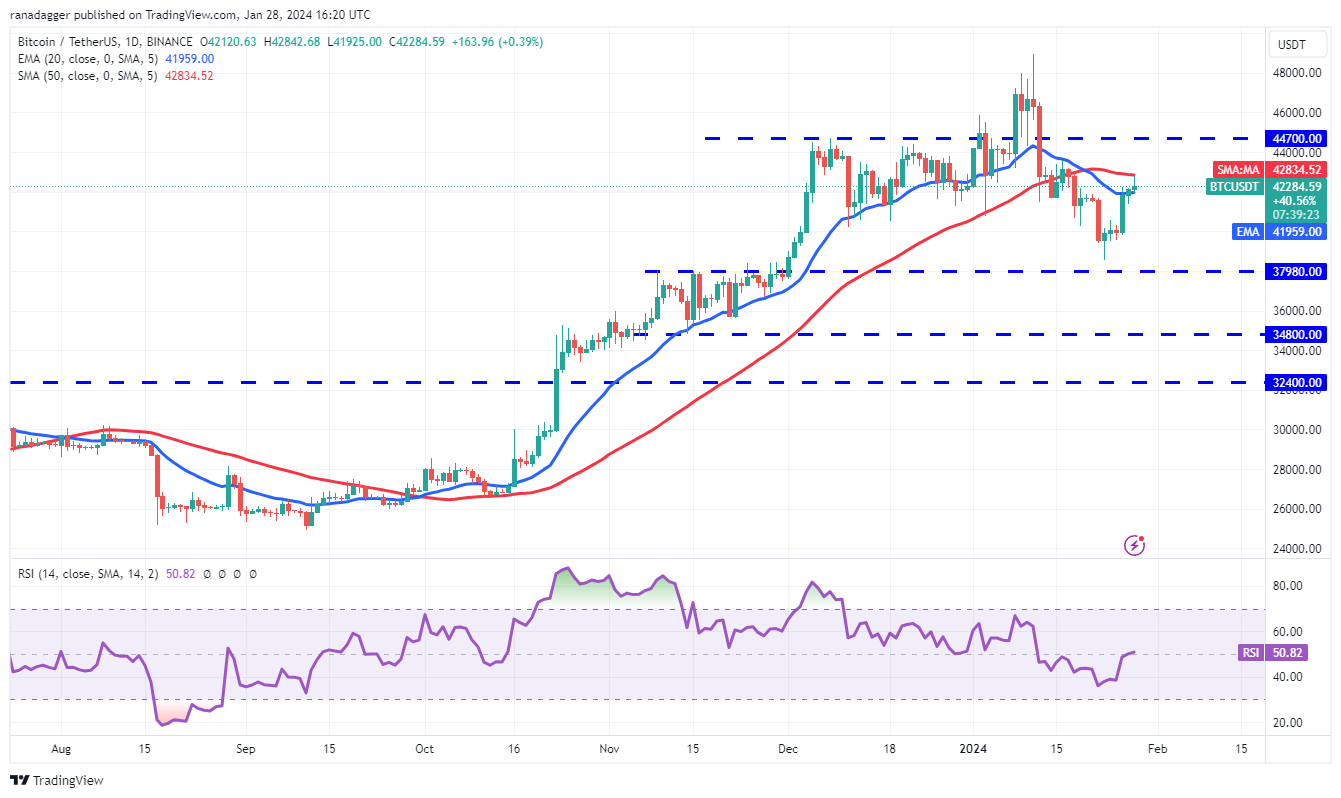 BTC/USDT daily chart. Source: TradingView
The 4-hour chart for Bitcoin shows that the moving averages have completed a bullish crossover, and the RSI is approaching the overbought zone, indicating a comeback for the bulls [^1^]. In this case, the rally could reach $43,500 and then $44,700. Conversely, a break below the 50-simple moving average would favor the bears, and the pair may decline to $39,500 and later to $37,980.
Solana Price Analysis
Solana (SOL) has climbed above the moving averages on January 27th and is attempting to sustain above the downtrend line on January 28th [^1^]. The 20-day EMA ($93) has flattened out, and the RSI is just above the midpoint, indicating equilibrium between buyers and sellers. If the price maintains its position above the downtrend line, the SOL/USDT pair may attempt a rally to $107 and then to $117. However, if the price falls back below the moving averages, the bears may regain control, potentially leading to a retest of the support at $79.
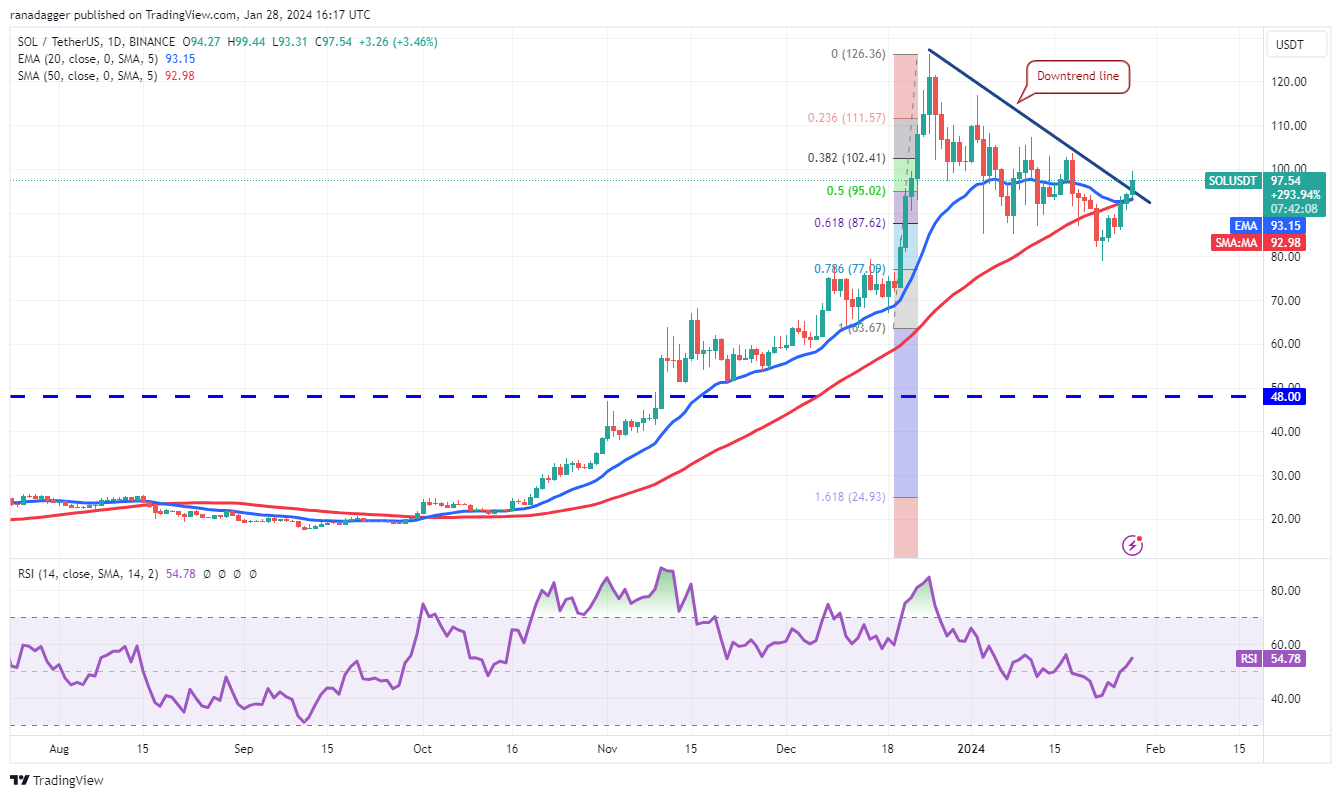 SOL/USDT daily chart. Source: TradingView
The 4-hour chart for Solana shows that the pair has risen above the downtrend line, invalidating the bearish descending triangle pattern, which is a positive sign for the bulls [^1^]. If buyers can hold the price above the downtrend line, the pair is likely to ascend toward $107 and later to $117. However, if the price turns down and plummets below $85, this positive view will be invalidated in the near term.
Avalanche Price Analysis
Avalanche (AVAX) has been trading within a descending channel pattern for several days. However, buyers stepped in and pushed the price above the 20-day EMA ($34) on January 28th [^1^]. Sellers will aim to halt the recovery at the downtrend line, and if successful, the AVAX/USDT pair may remain inside the channel. On the contrary, if the price breaks above the overhead resistance, it will indicate aggressive buying by the bulls, potentially leading to a rally toward $44 and the psychologically important level of $50.
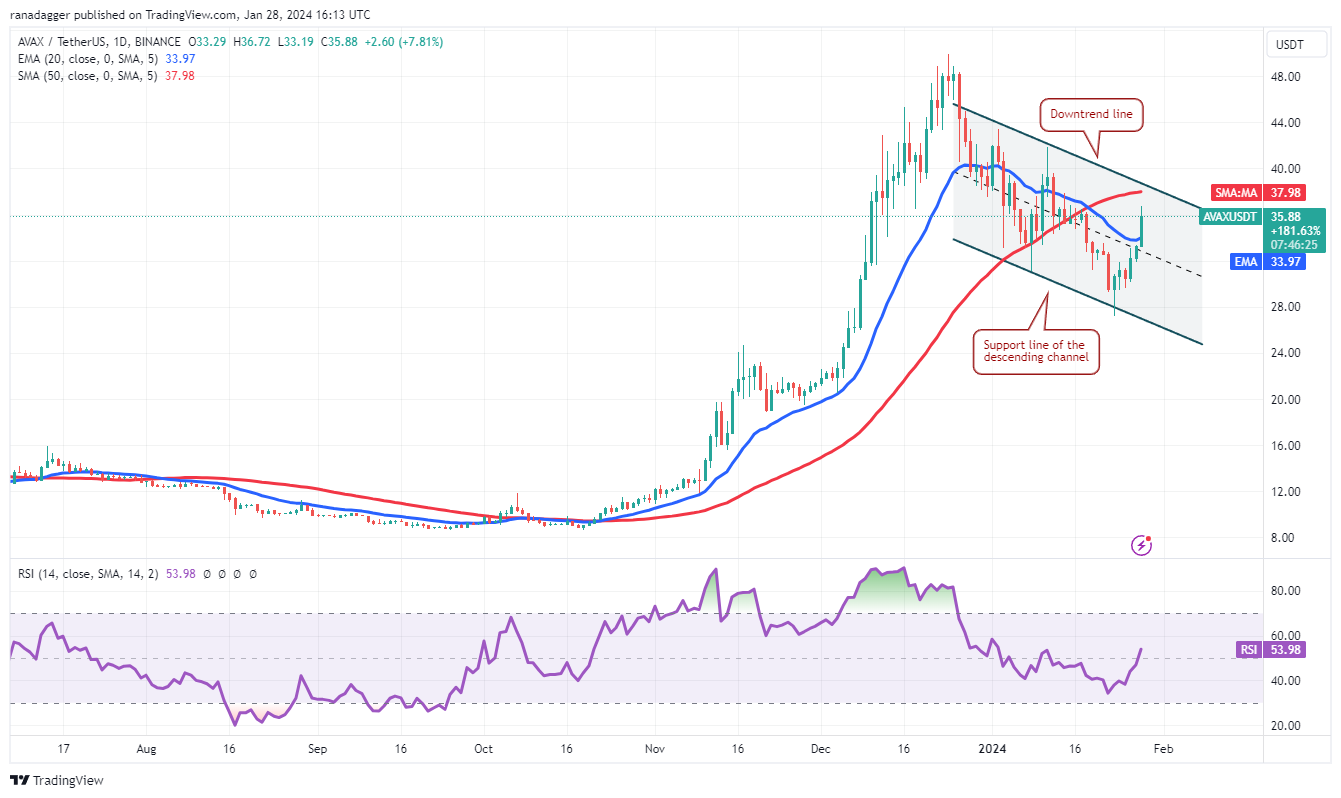 AVAX/USDT daily chart. Source: TradingView
The 4-hour chart for Avalanche indicates that the bulls are gaining strength as they continue to defend the downtrend line [^1^]. If the price turns down from the downtrend line but rebounds off the 20-EMA, it will suggest that traders view the dips as buying opportunities, enhancing the prospects of a rally above the channel. However, if the price breaks below the moving averages, it will indicate fierce selling by the bears, suggesting that the pair may remain inside the channel for a while longer.
Render Price Analysis
Render (RNDR) experienced initial pullback, but it has been consolidating between $3.56 and $4.40 for the past few days [^1^]. Both moving averages have flattened out, and the RSI is just above the midpoint, indicating a balance between the bulls and the bears. A break below the 20-day EMA ($4) may extend the range-bound action for a few more days, while a rise above $4.40 will signal buyer dominance, potentially resulting in a rally to $5.07 and eventually $5.28, with further upside indicating a resumption of the uptrend.
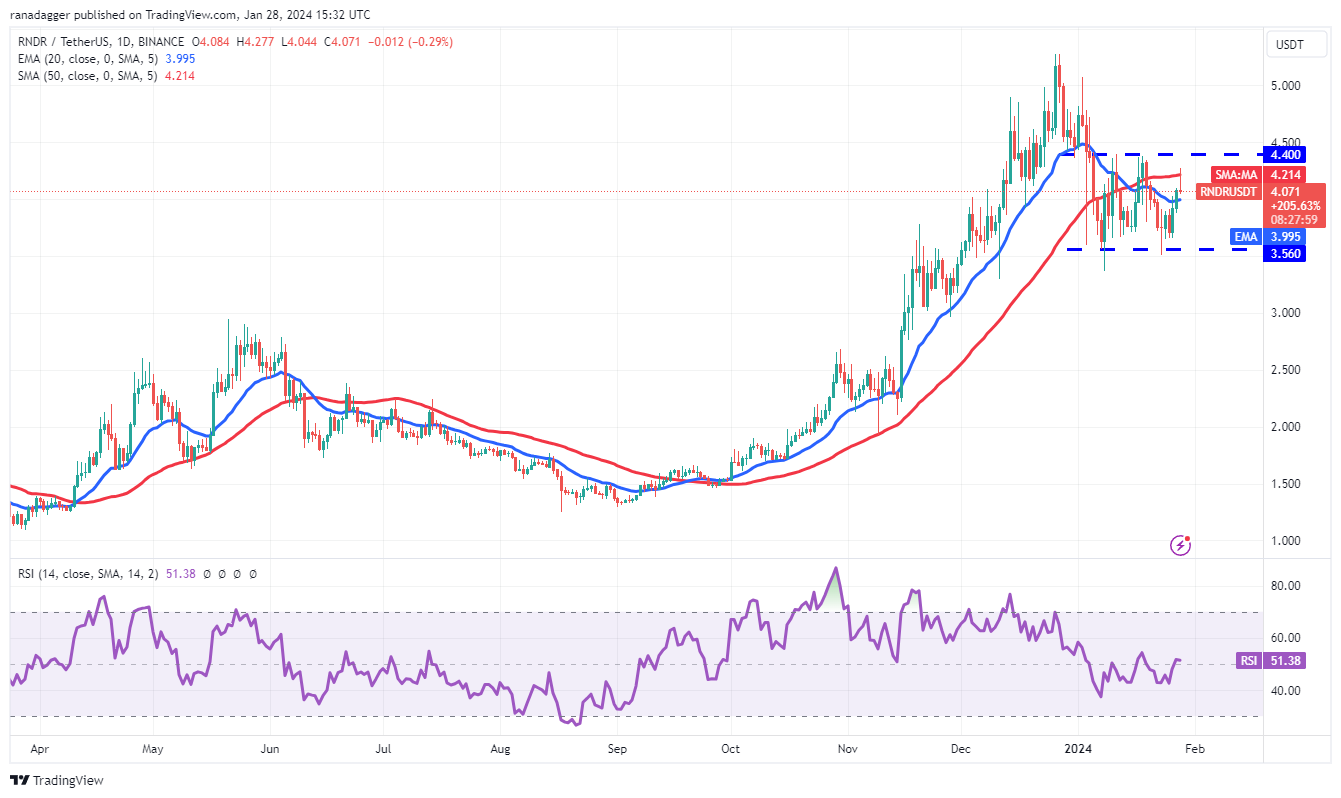 RNDR/USDT daily chart. Source: TradingView
The 4-hour chart for Render shows a symmetrical triangle pattern, suggesting indecision among traders [^1^]. If the buyers successfully push the price above the triangle, the pair may climb to $4.40 and then to $4.71. However, if the price breaks below the 20-EMA, it will indicate bearish pressure, potentially leading to a drop towards the support line.
Sui Price Analysis
Sui (SUI) has been in an uptrend but faces resistance at $1.50 [^1^]. The rounding bottom pattern on the daily chart could complete on a break and close above $1.50, signaling bullish momentum and potentially pushing the pair toward $2. Meanwhile, bears may try to pull the price to the 20-day EMA ($1.18) in an effort to prevent an upward move. A rebound off the 20-day EMA could increase the likelihood of a rally above $1.50, while a break below the 20-day EMA could open the doors for a decline to the 50-day SMA ($0.92).
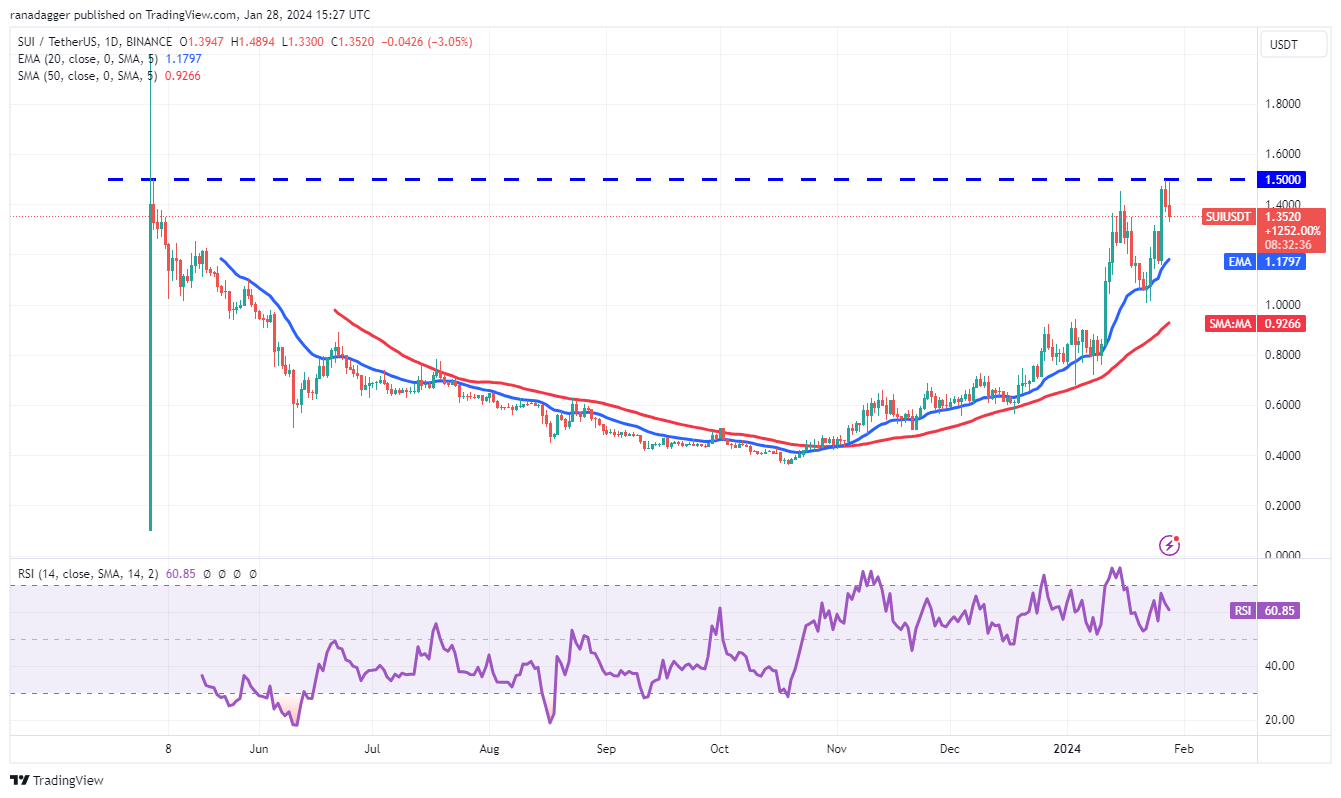 SUI/USDT daily chart. Source: TradingView
On the 4-hour chart, Sui faces resistance at $1.50, with the price struggling to break above it [^1^]. A rebound off the 20-EMA would suggest positive sentiment and buying on minor dips, potentially enabling the pair to overcome the obstacle at $1.50 and continue its uptrend. However, if the price breaks below the 20-EMA, it could indicate bearish pressure, leading to a pullback towards the 50-SMA.
Q&A
Q: Are there any upcoming events or news that could impact the price of Bitcoin and these cryptocurrencies? A: Yes, the upcoming Bitcoin halving in April is anticipated to have a significant impact on Bitcoin’s price. Additionally, developments in the regulatory framework and any major institutional adoption can also influence the market sentiment.
Q: What are some potential risks and challenges faced by these cryptocurrencies? A: Cryptocurrencies such as Bitcoin, Solana, Avalanche, Render, and Sui are subject to market volatility, regulatory uncertainty, and potential security threats. It’s essential for investors to stay updated on the latest news and developments in the cryptocurrency space.
Q: How can investors take advantage of the potential growth in these cryptocurrencies? A: Investors can consider diversifying their portfolios by including cryptocurrencies that show strong technical indicators and fundamentals. Conducting thorough research, setting realistic investment goals, and consulting with financial advisors can provide guidance for making informed investment decisions.
Future Outlook and Investment Recommendations
Based on the current market analysis, Bitcoin is likely to consolidate its gains as traders focus on inflows into Bitcoin exchange-traded funds and anticipate the Bitcoin halving in April. Altcoins such as Solana, Avalanche, Render, and Sui have shown positive price movements and may present investment opportunities in the near term.
Investors should consider the potential for continued growth in the crypto market and make informed investment decisions based on their risk tolerance and investment objectives. Diversification and staying updated with market trends and news are crucial for successful cryptocurrency investments.
References
- [^1^] Bitcoin: BTC Price at $43K as Smart Money Bets Big on Bitcoin Ahead of Potential BTC ETF Approval
- [^2^] Grayscale Investments’ Top Executives Barry Silbert and Mark Murphy Resign from Board of Directors
- [^3^] Solana’s SOL Dips 100 Slips Back Below BNB in Crypto Ranking
- [^4^] Avalanche AVAX Holds 20% December Gain Despite Recent Market Decline
- [^5^] Bitcoin ETF Ads May Appear on Google Starting Monday, Community Speculates
Remember to stay updated with the latest news and trends in the cryptocurrency market, and as always, conduct thorough research and exercise caution while making investment decisions.
🔥📈🚀 Share this article if you found it helpful and follow us on social media for more engaging content! 🎉💻💰
We will continue to update Blocking; if you have any questions or suggestions, please contact us!
Was this article helpful?
93 out of 132 found this helpful
Related articles
- Twentysix Cloud: The Future of Decentralized Cloud Solutions
- Hedera (HBAR) Surpasses Crypto Market with Impressive Q4 Growth
- Bitcoin Price Analysis: Bulls and Bears Battle for Control
- Navigating Crypto Volatility: Strategies and Insights from the Crypto Community
- Miners Lead the Crypto Market Rebound: A Roller Coaster Ride for Crypto Stocks
- 📰 OKX Suspends Mining Pools: A Shift in the Crypto Industry 🚫⛏️
- Binance.US Faces Regulatory Pressure as Florida and Alaska Ban Residents from Using the Crypto Platform 🚫❌