Lies of the trading platform——how to dynamically check the authenticity of transactions on the exchange
I. Overview of market transactions
As an important participant and builder in the blockchain ecosystem, cryptocurrency exchanges have always been closely related to the development of cryptocurrencies.
From the creation of the Bitcoin Genesis Block in 2009, to the birth of Bitcoin Market, the world's first Bitcoin exchange in 2010, to the hundreds of billions of dollars of cryptocurrency market now formed, the number of cryptocurrency exchanges has also accompanied The market size is increasing. Today, hundreds of cryptocurrency exchanges on the market provide users with multiple forms of investment services, including spot, leverage, futures options, ETFs, and more.
While the number of exchanges and the expansion of business scope have expanded, many exchanges have overstated their market influence by falsely reporting the turnover, which has seriously affected investors' evaluation and choice of exchanges, and also affected research. Judgment of personnel on market development trends.
In March 2019, when Bitwise Asset Management filed an application for Bitcoin's ETF with the SEC, it pointed out in an additional report that it obtained " a false transaction volume of more than 95% of the reported transaction volume of the exchange " through various statistical methods. Conclusion. Coincidentally, in July 2019, Alameda Research released a report that tested the authenticity of exchange transactions through six indicators. The statistical results reflected that the false transaction volume of the market's top exchange accounted for about 1/3 of the reported transaction volume .
- U.S. Federal Reserve cuts interest rates sharply
- Babbitt Column | Why Don't Use Leverage in Investment Coins
- Market analysis: the market rebounded weakly, the market bulls have not recovered
Since then, a variety of detection methods have appeared on the market to detect the authenticity of exchange volume, and to a certain extent it is presumed that there are a large number of false transactions in some exchanges.
Second, the real transaction research of QKL123
As a blockchain data service agency, QKL123 has access to the K-line data of hundreds of exchanges. Based on market awareness and the research results of other research institutions, QKL123 has conducted sample data statistics for most exchanges. It assists researchers to dynamically identify the true transaction status of exchanges, and assists investors in choosing higher-quality exchanges .
QKL123 selects samples for observation and statistics according to the following rules:
① The daily trading volume of the exchange is among the top 100 in the market;
② Take the BTC trading pair with the largest spot trading volume on each exchange as the sample trading pair;
③ Exclude sample trading pairs whose 24-hour transactions are less than 5000;
④ Exclude cloud exchanges that share transaction depth.
After several days of statistics and analysis, this article believes that nearly five of the reported market transactions in the current market have become false transactions. For example, according to the authenticity of the exchange, it is classified as extremely high, high, and general. The lower four levels of authenticity are 18%, 26%, 21%, and 35%.
For the transaction statistics of a specific exchange, users can click the name of the exchange from the " Trading Platform Leaderboard " to enter the corresponding " Trading Platform Details Page " and view the statistical results through the real transaction button. At present, QKL123 is combining technologies such as AI, and will soon show users the real transaction ratios of various exchanges in real time.
Statistical basis
There are 7 parts of the real transaction module displayed on the QKL123 page, which are the basic data of the sample transaction pair , the transaction volume distribution , the transaction synchronization , the Benford law analysis , the transaction tail , the exchange comparison, and the FTX real-time measurement .
The following will describe the page display data and statistical basis.
Long tail law
1.1 Basic description
BTC's wealth distribution and transaction statistics follow the "Eight and Eight Laws". In terms of wealth distribution, a few addresses have accumulated a large amount of BTC, but most users only hold a small amount of BTC. This kind of imbalanced wealth distribution also leads to imbalances in market transaction data-a small number of large orders and a large number of small orders.
If the transaction data of the sample trading pair is counted, when the number of transactions is sufficient, the curve formed by each transaction amount X and the number of transaction orders Y has certain similarities with the inverse proportional function (the long-distance tail), which has the following two Features :
① Continue to decline: With the increase of each transaction volume X, the number of transactions Y shows a downward trend;
② Steep first and then slow: the curve is steep when the volume X of each transaction is small, and gentle when the volume X of each transaction is large;
1.2 Sample examples
The figure below shows the transaction data of a platform in the last 24 hours. The horizontal axis is the volume of each transaction (the interval between each interval is 0.03 BTC, and the last interval is “≥3 BTC”). The vertical axis is the number of transactions. . To view detailed data, QKL123 provides both linear and logarithmic axes. The data shows that the transaction data of the trading platform for the last 24 hours has the characteristics of " steep first and then slow " and " continuous decline ", which meets the requirements of the long tail law. 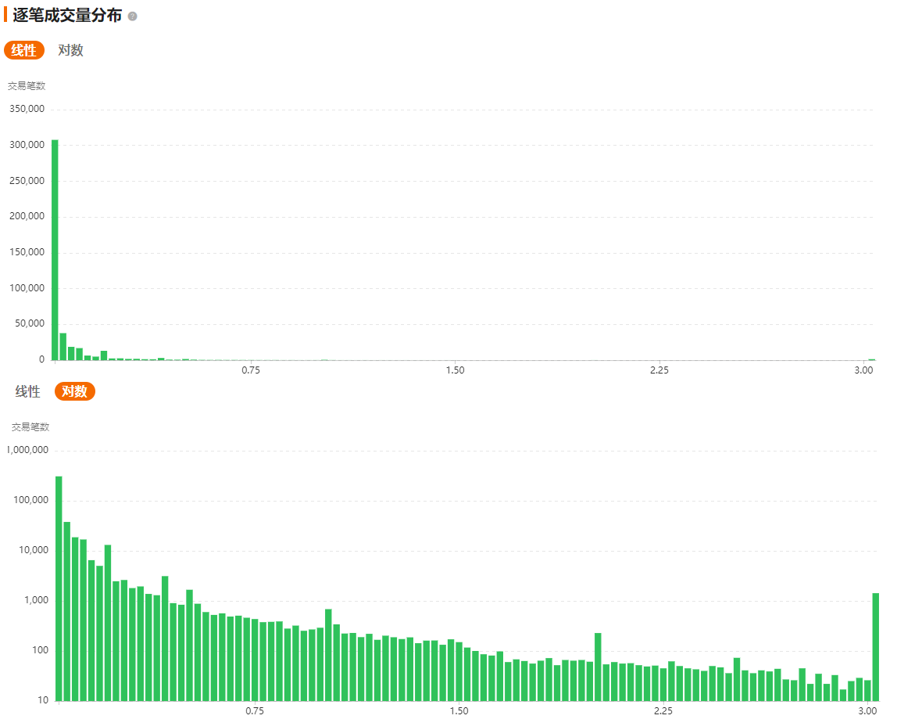
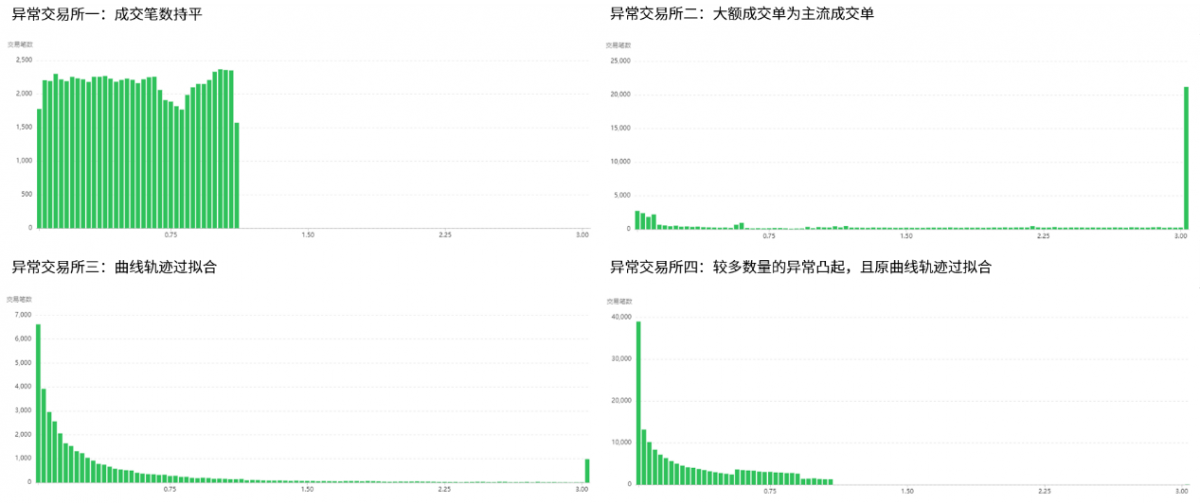
Example of abnormal data:
Benford's law
2.1 Basic description
Benford's law means that in an array of sufficient number, the first digit (ie the first significant digit) is usually not evenly distributed between 1 and 9, but gradually increases as the number increases. Decreased, the formula for the probability of each number d is as follows: 
2.2 Sample examples
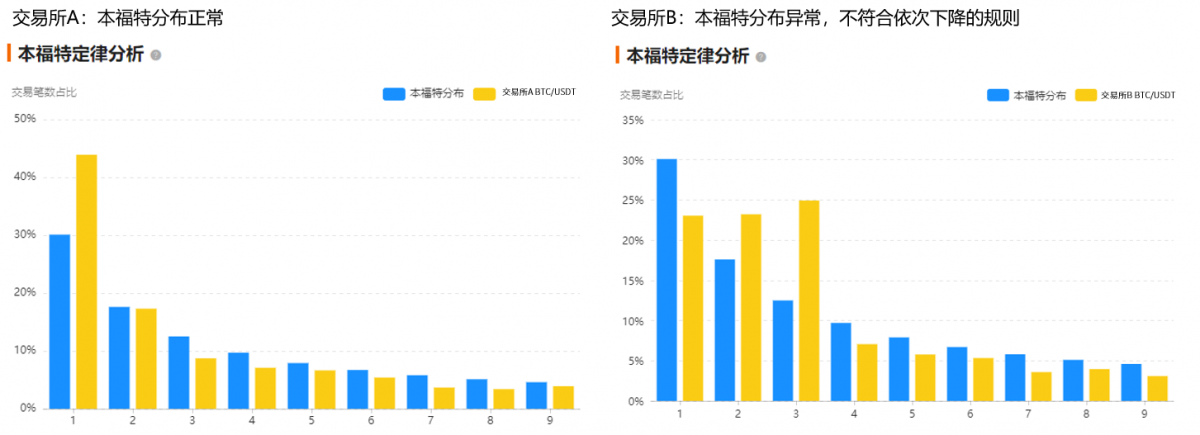
The figure below shows Benford statistics on transaction data of trading platforms A and B in the past 24 hours. Among them, the horizontal axis is the corresponding first significant digit, the vertical axis is the number of transactions, the blue is the standard Ben Ford distribution ratio, and the yellow is the data of the sample trading pair. The data shows that in the statistics of transaction data of trading platform A, although the distribution of the first significant digit is different from the standard distribution, the overall trend is similar and basically meets the distribution requirements; but trading platform B does not meet the rule of sequential decline .
Law of integers
3.1 Basic description
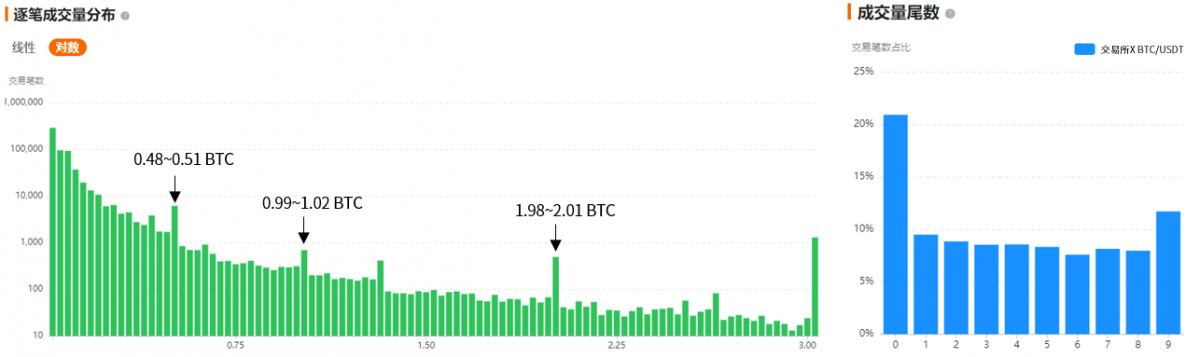
According to the statistical results of many samples and thinking about behavior, people should have a stronger preference for transactions in integer form, that is, people are more inclined to trade 5.000 BTC instead of 5.001 or 4.999 BTC. When reflected in the statistics of transaction data, the number of transaction orders in the range of 0.99 ~ 1.02BTC will be higher than 0.96 ~ 0.99BTC and 1.02 ~ 1.05BTC, so a bump will be formed on the histogram. In addition, if frequency statistics are performed on the fourth decimal place of each transaction volume, the probability of this one figure being 0 should be greater than other figures.
However, it should be noted that in some trading platforms, users can only adjust the order amount in USDT or other legal currencies instead of BTC, or because of the transaction order statistics rules of some trading platforms. The result may be abnormal. Therefore, this law is considered to be a sufficient condition rather than a necessary condition in this article. That is, meeting the integer law can partially prove the authenticity of trading platform trading volume, but not satisfying the integer law does not necessarily represent the distortion of trading platform trading volume.
3.2 Sample examples
The following figure is the transaction data of a trading platform in the past 24 hours. Among them, the left figure is the logarithmic axis form of the transaction volume data, and the right figure is the distribution of the mantissa (fourth place after the decimal point). The data shows that the trading platform's one-by-one volume histogram has obvious bumps at several integer positions. The number 0 in the volume digit distribution corresponds to the highest frequency and meets the distribution requirements.
4. Volume correlation
4.1 Basic description
With the maturity of the cryptocurrency trading market and the increase in trading users, the possibility of cross-platform arbitrage due to price differences between different trading platforms gradually decreases, the correlation between price changes between different trading platforms is further strengthened, and the correlation between changes in transaction volume It has also increased.
Since the sample trading pairs are all selected BTC related trading pairs, the trading volume of a single trading platform's sample trading pair and the market trading volume should have similar trends. In particular, for some trading platforms with small trading volume and shallow market depth The change trend of its trading volume may lag slightly behind the overall market trend.
4.2 Sample examples
This article selects three compliant trading platforms, BitFlyer, Bitstamp, and Coinbase, as the standard, and compares them as the standard with the sample volume of each trading platform. The figure below shows the transaction data of the three standard trading platforms in the past 24 hours, with a time interval of 5 minutes. The chart shows that the trading volume trends of the three trading platforms are synchronized for most of the time.

5. Other related indicators
Volume / User: The BTI (Blockchain Transparency Institute) compares the trading volume of the trading platform with the UV value to obtain the customer unit price indicator, and believes that this indicator can reflect the proportion of false transactions in the trading platform to a certain extent .
QKL123 displays the 30-day trading volume of a single trading platform sample trading pair, trading platform visitor data, and trading platform 30-day customer unit price data at the same time on the page to assist users in making judgments. It should be particularly noted that due to the existence of multiple standby addresses in some trading platforms, the selection of visitor data here may be smaller than the actual value.
FTX real-time measurement: The FTX trading platform displays the research results of Alameda Research. It measures the authenticity ratio of the trading platform from six dimensions, including the authenticity of the website transaction, and estimates the actual transaction volume corresponding to the previous day of the trading platform.
Fourth, the conclusion
This article provides investors with a general method for judging the false trading volume of an exchange. However, when judging the authenticity of a particular trading platform, investors need to comprehensively consider various statistical data and the setting of the trading mechanism of the exchange, which cannot be generalized. . In addition, the statistical methods described in this article are applicable to large sample data. With the disclosure of statistical methods, some exchanges will modify the data in a targeted manner, which will also affect the validity of statistical data. For more data on the exchange and market, users can log on to the QKL123 website to view it.
We will continue to update Blocking; if you have any questions or suggestions, please contact us!
Was this article helpful?
93 out of 132 found this helpful
Related articles
- "Is Ethereum a currency?" Pomp refutes that only Bitcoin and gold have both currency and value storage characteristics
- Analysis: Legal issues of blockchain within the framework of the EU's General Data Protection Regulation (GDPR)
- About 42% of Bitcoin has not had any on-chain transactions in the past 2 years, or has become an important driving force for the rise in the price of coins
- Beware of replay attacks! PoC2 + Hard Fork Upgrade Risk Tips
- Xiaomi establishes industry-finance big data company to continue expanding blockchain and other businesses
- HNA Group encountered the most severe moment in 27 years, blockchain could not save HNA
- With the reduction of Bitcoin production and the surge of computing power, the "year of mining disaster" of the 16nm mining machine is bound to come?


