Bitcoin’s parabolic indicator suggests that the bull run will continue, despite a recent 15% crash.
Bitcoin Recently Experienced a Significant Drop, Plunging 15% from Its 2024 Highs of $49,000. This Decline Came on the Heels of...Recently, Bitcoin experienced a significant drop, crashing 15% from its 2024 highs around $49,000. This decline followed closely on the heels of the approval of 11 spot Bitcoin Exchange-Traded Funds (ETFs), a move that was initially met with optimism in the crypto community. The sudden downturn has left investors and traders analyzing the charts for clues about Bitcoin’s next move.
Is The Bullish Bitcoin Trend Over?
In the wake of this decline, technical analysis offers a beacon of insight. Notably, the correction was marked by a bearish engulfing candle on the daily chart, signaling a potential reversal in Bitcoin’s upward trend.
Accompanying this was a nasty wick – a long upper shadow on the candlestick chart, indicating a significant sell-off after prices peaked.
- 🚀 Bitcoin Mining Stocks: A Buying Opportunity in the Dip 📉
- VanEck to Liquidate Bitcoin Futures ETF: What You Need to Know
- Bitcoin Spot ETFs Achieve $10 Billion in Trading Volume – Here’s What You Need to Know 🚀💰
Further complicating the landscape was the opening of the CME BTC Futures with a sizeable gap down. Such gaps are often viewed as potential resistance levels, reinforcing the bearish sentiment.
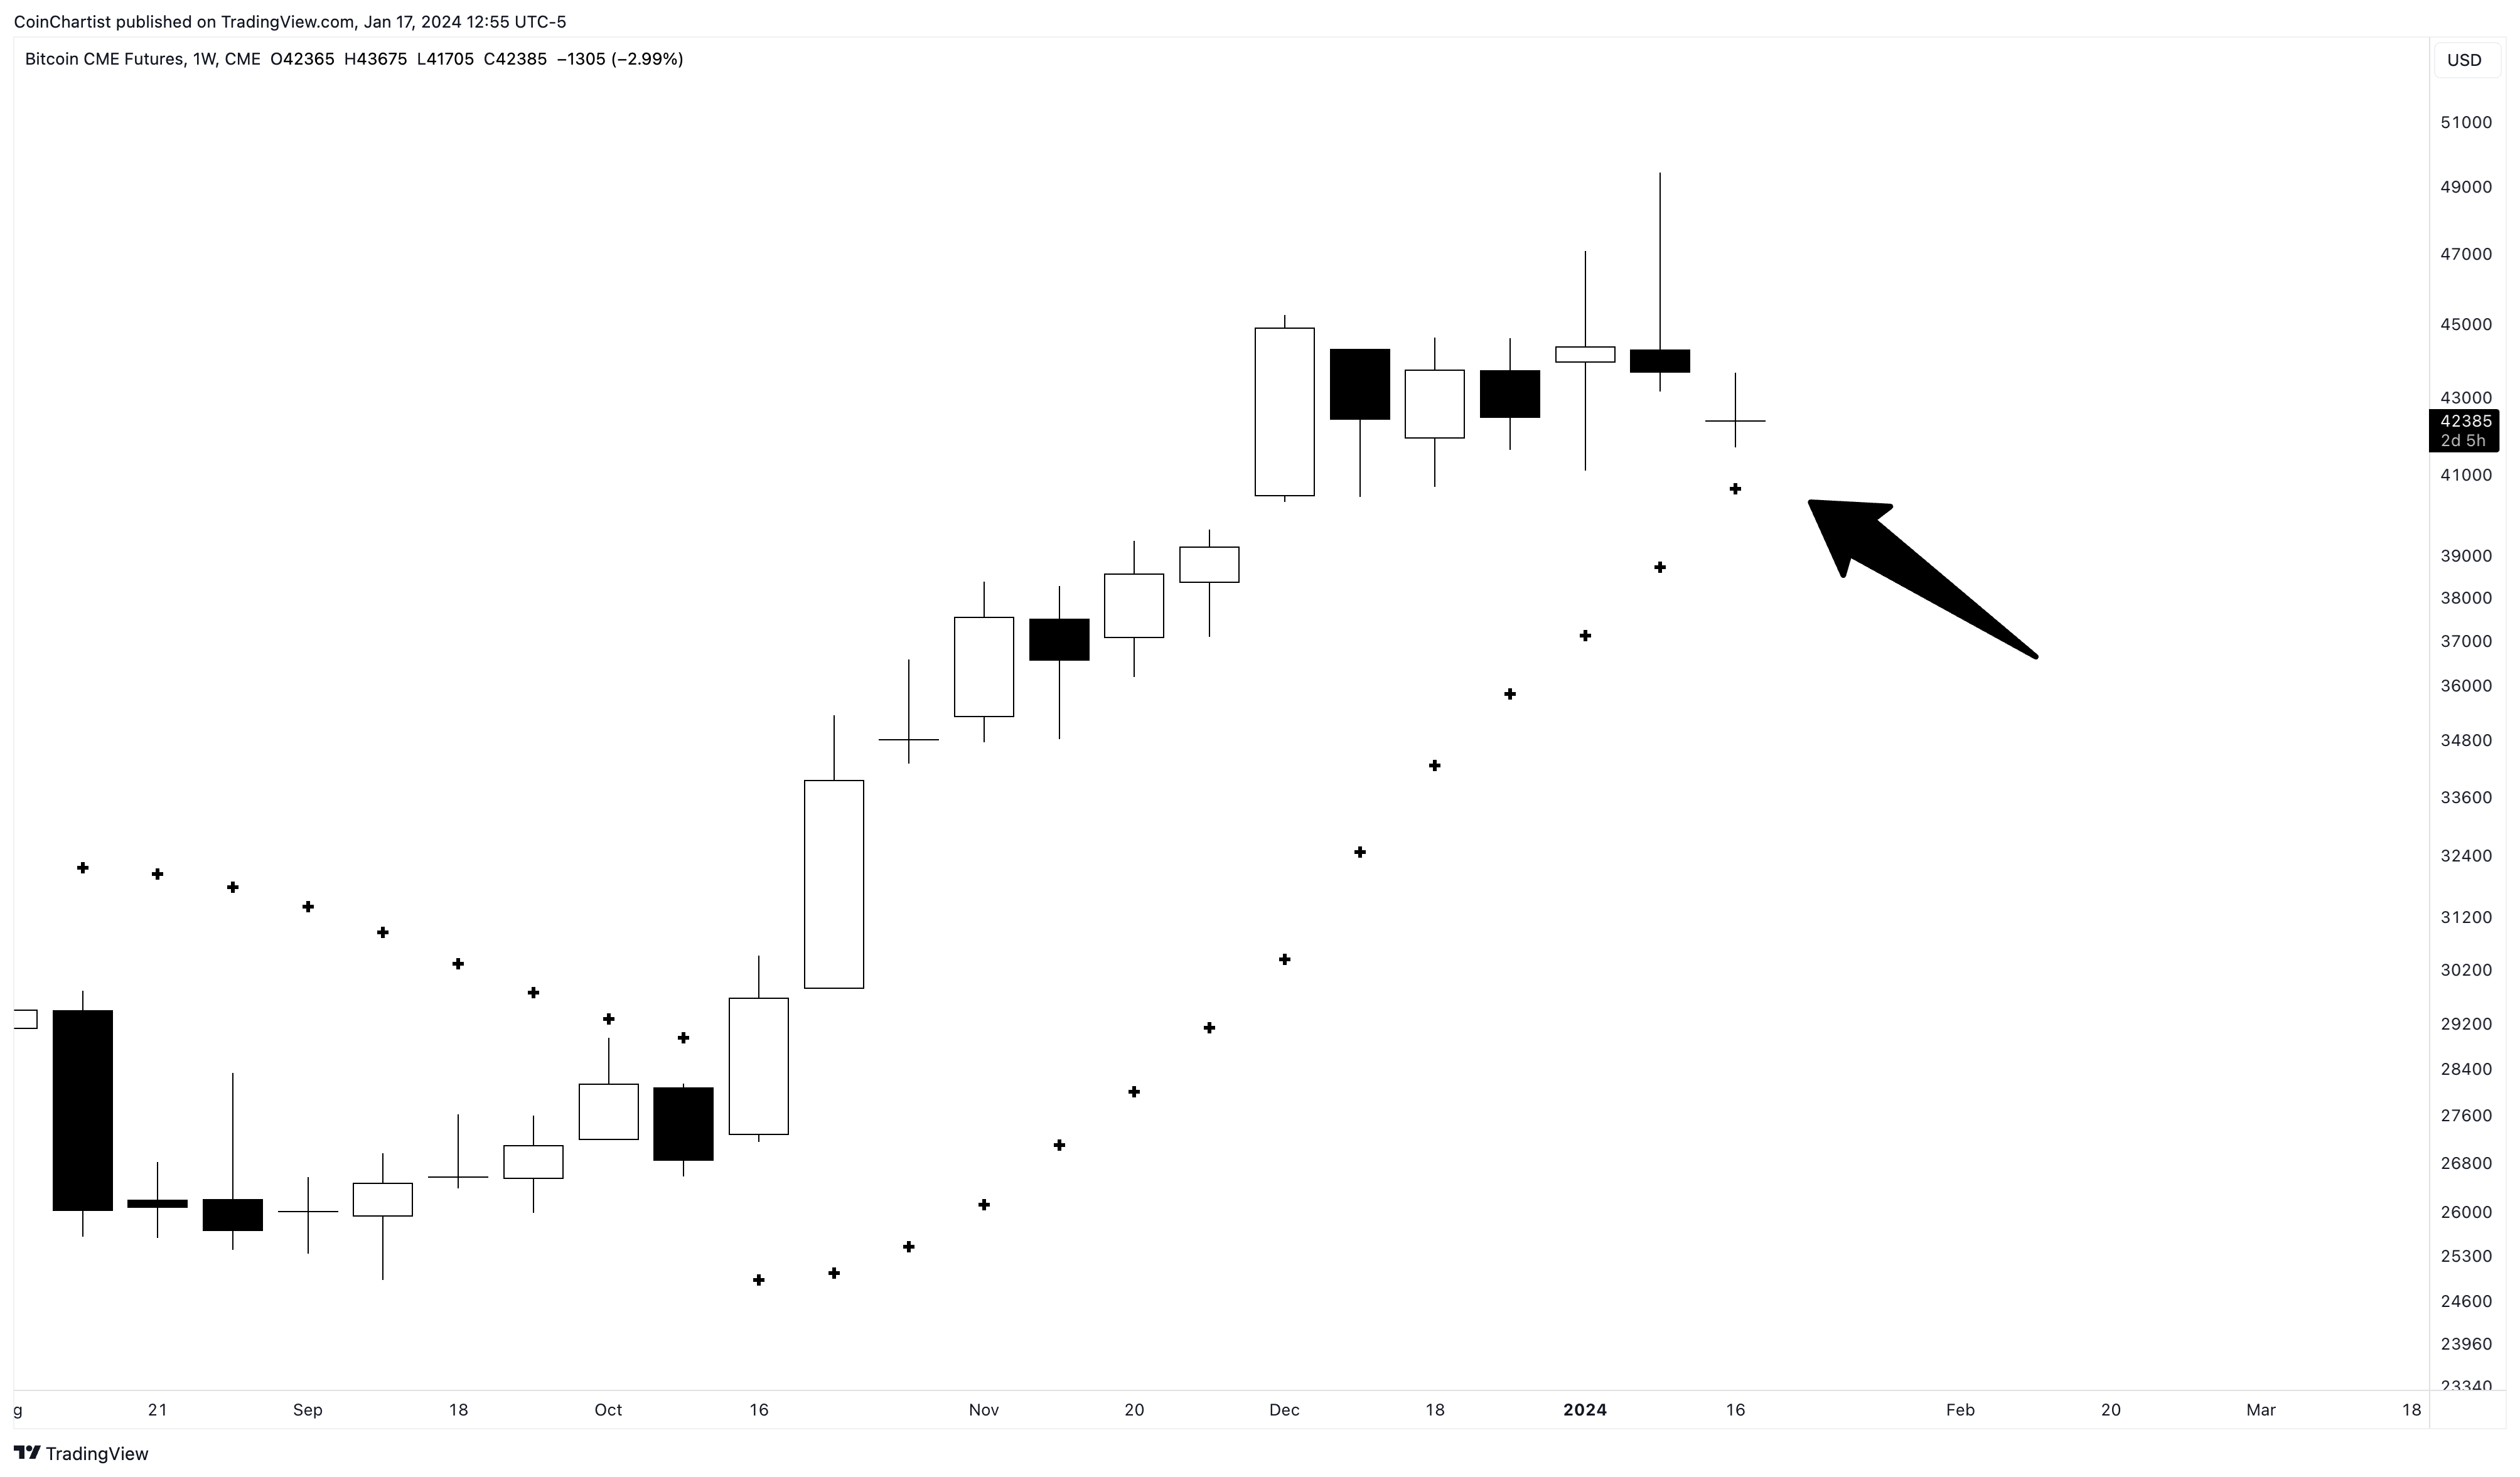
The Parabolic SAR remains below price action | [BTCUSD on TradingView.com](/?s=BTCUSD+on+TradingView.com)Stop And Reverse: A Ray Of Hope
However, amidst these seemingly negative signals, a ray of hope shines through from a “parabolic” technical indicator – the Parabolic SAR (Stop and Reverse).
Despite the tumultuous market conditions, the weekly BTCUSD Parabolic SAR indicator remains untagged, suggesting that the long-term uptrend is still intact.
This indicator, known for its effectiveness in identifying potential reversals in the market’s direction, paints a different picture from the immediate bearish signals and sentiment.
What Is The Parabolic SAR?
To fully grasp the significance of the Parabolic SAR in this context, it’s essential to understand what it is and how it functions. The Parabolic SAR is a popular technical analysis tool used primarily to determine the direction of an asset’s momentum and to provide entry and exit points.
The ‘SAR’ in Parabolic SAR stands for ‘Stop and Reverse.’ This indicator is represented on charts as a series of dots placed either above or below the price bars. A dot placed below the price is viewed as a bullish signal, while a dot above is bearish.
Related Reading: Bitcoin News Catalyst: Could ETF Hype Cause BTC Price To Double?
The unique aspect of the Parabolic SAR is its ability to act as a trailing stop loss. As the price of an asset moves, the Parabolic SAR adjusts, moving closer to the price line. This adjustment provides a dynamic method for traders to manage their positions, securing profits while limiting potential losses.
In the context of Bitcoin’s current situation, the Parabolic SAR’s position – still below the price bars on the weekly chart – suggests that the long-term bullish trend is not yet disrupted.
Tony is the author of the CoinChartist (VIP) newsletter. Sign up for free. Follow @TonyTheBullBTC & @coinchartist_io on Twitter. Or join the TonyTradesBTC Telegram for daily market insights and technical analysis education. Please note: Content is educational and should not be considered investment advice. Featured image from Shutterstock, Charts from TradingView.com
Tags: bitcoin, btc, btcusd, BTCUSDT, crypto, parabolic sar, xbt, xbtusd
Q&A: Answering Your Burning Questions About Bitcoin
Q: What caused the recent drop in Bitcoin’s price?
A: The recent drop in Bitcoin’s price can be attributed to a combination of factors, including the approval of several spot Bitcoin ETFs and technical indicators signaling a potential reversal in the upward trend. This led to a sell-off by investors, resulting in the significant drop in price.
Q: Is the bullish trend in Bitcoin over for good?
A: While the recent drop in price and bearish signals may indicate a temporary setback, the long-term bullish trend in Bitcoin is still intact. The Parabolic SAR indicator, which has proven to be effective in identifying reversals, suggests that the overall bullish trend is not yet disrupted.
Q: How does the Parabolic SAR indicator work?
A: The Parabolic SAR indicator is a technical analysis tool that helps determine the direction of an asset’s momentum and provides entry and exit points. It is represented as a series of dots placed above or below the price bars. A dot below signifies a bullish signal, while a dot above indicates a bearish signal. The indicator can also act as a trailing stop loss, adjusting its position as the price of the asset moves.
Q: Should I be concerned about the opening of CME BTC Futures with a gap down?
A: The opening of CME BTC Futures with a sizeable gap down is viewed as a potential resistance level and reinforces the bearish sentiment. However, it is important to consider multiple indicators and analyze the overall market conditions before making any investment decisions.
Analysis and Future Outlook
The recent drop in Bitcoin’s price has raised concerns among investors and traders. However, it is crucial to analyze the market using a combination of technical indicators and fundamental factors to gain a deeper understanding of the situation.
While the immediate bearish signals and sentiment may be cause for caution, the long-term bullish trend in Bitcoin remains intact, as indicated by the Parabolic SAR indicator. This suggests that the recent drop in price may be a temporary setback rather than an indication of a complete reversal.
Going forward, it is essential to monitor the market closely, taking into account any further developments, regulatory changes, and market trends. While volatility is intrinsic to the cryptocurrency market, investors who understand the underlying technology and make informed decisions can benefit from the long-term potential of cryptocurrencies like Bitcoin.
In conclusion, while the recent drop in Bitcoin’s price has caused concerns, the overall outlook remains positive. It is crucial for investors to stay updated, analyze the market using various indicators, and make informed decisions based on their risk appetite and investment goals.
References
- Bitcoin Exchange Reports Significant Growth: Article on the significant growth of a Bitcoin exchange.
- Bitcoin News Catalyst: Could ETF Hype Cause BTC Price To Double?: Article discussing the impact of ETF hype on Bitcoin’s price.
- Crypto Investors Beware: IRS Crypto Tax Reporting Rules: Article providing information on IRS crypto tax reporting rules.
- Bitcoin Adoption Soars: In-Person Vendors Accepting Bitcoin to Triple in 2023: Article on the increasing adoption of Bitcoin by in-person vendors.
- Bitcoin (BTC) Price Pumps Towards $45,000 as Reporter Claims SEC to Approve Multiple BTC ETF Applications: Article discussing Bitcoin’s price increase and the potential approval of BTC ETF applications.
We will continue to update Blocking; if you have any questions or suggestions, please contact us!
Was this article helpful?
93 out of 132 found this helpful
Related articles
- Grayscale Bitcoin Trust (GBTC) Witnesses Massive Outflows: What You Need to Know
- The Rise of Spot Bitcoin ETFs in the US: What Does It Mean for Trading Dynamics?
- JPMorgan CEO Jamie Dimon Continues Bitcoin Bashing: Is He the Pot Calling the Kettle Black?
- Bitcoin ETF Guru Eric Balchunas Has the Last Laugh at Doubters: X Hall of Flame
- Bitcoin ETFs: Unfolding Impact Over Time?
- Breaking Through Resistance: The Battle for Bitcoin’s Future
- Excitement rises as Bitcoin halving countdown dips below 100 days Will prices go through the roof?