Bitcoin ETFs Catapult into Top 5 as Investors Shift from Gold
Possible Increase in Bitcoin and Altcoin Trends Could U.S. Regional Bank Stock Corrections Trigger It?Here’s a concise analysis of the prices for BTC, ETH, BNB, SOL, XRP, ADA, AVAX, DOGE, DOT, and LINK on 2/7.
Bitcoin (BTC) has not displayed any fireworks since the launch of spot Bitcoin exchange-traded funds (ETFs), but that has not stopped investors from piling into select ETFs.
According to senior Bloomberg ETF analyst Eric Balchunas, BlackRock’s iShares Bitcoin Trust ETF has catapulted into the top 5 ETFs in year-to-date flows. This signals that investors are indeed interested in gaining exposure to Bitcoin through these newly introduced financial instruments.
The launch of spot Bitcoin ETFs has also resulted in investors shifting from gold to Bitcoin, according to ARK Invest CEO Cathie Woods. In a YouTube chat with chief futurist Brett Winton, Woods stated that Bitcoin is likely to behave as a “risk-off asset” during the next banking crisis. This reflects the growing belief among some investors that Bitcoin is a safe haven asset, similar to gold, during times of economic uncertainty.
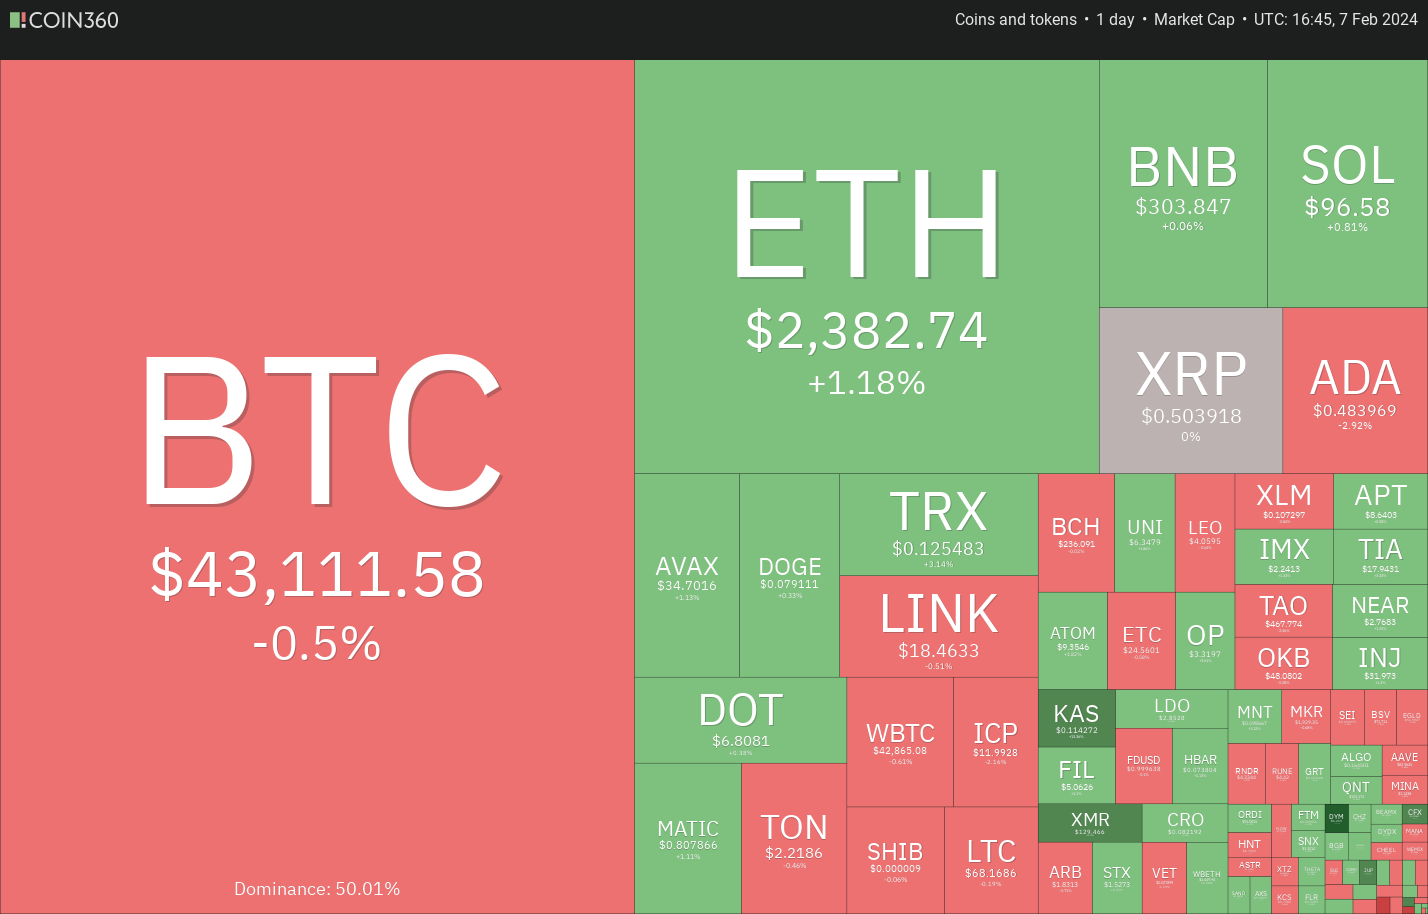 Daily cryptocurrency market performance. Source: Coin360
- Bitcoin has only 10 days left until its price metric enters the squeeze zone.
- Bitcoin Surges Above $44,000 as Large Holders Accumulate
- Ethereum Price Surges Following Amendments to Spot Ethereum ETF Filing 🚀📈
The more than 60% fall in New York Community Bancorp (NYCB) stock since January 30 brings back memories of the banking crisis seen a year ago. This fall is of particular interest to the crypto community because NYCB had acquired the failed crypto-focused Signature Bank in 2023. This raises the question: Could the developing banking crisis boost Bitcoin’s price in the near term? And if so, will altcoins follow?
Bitcoin Price Analysis
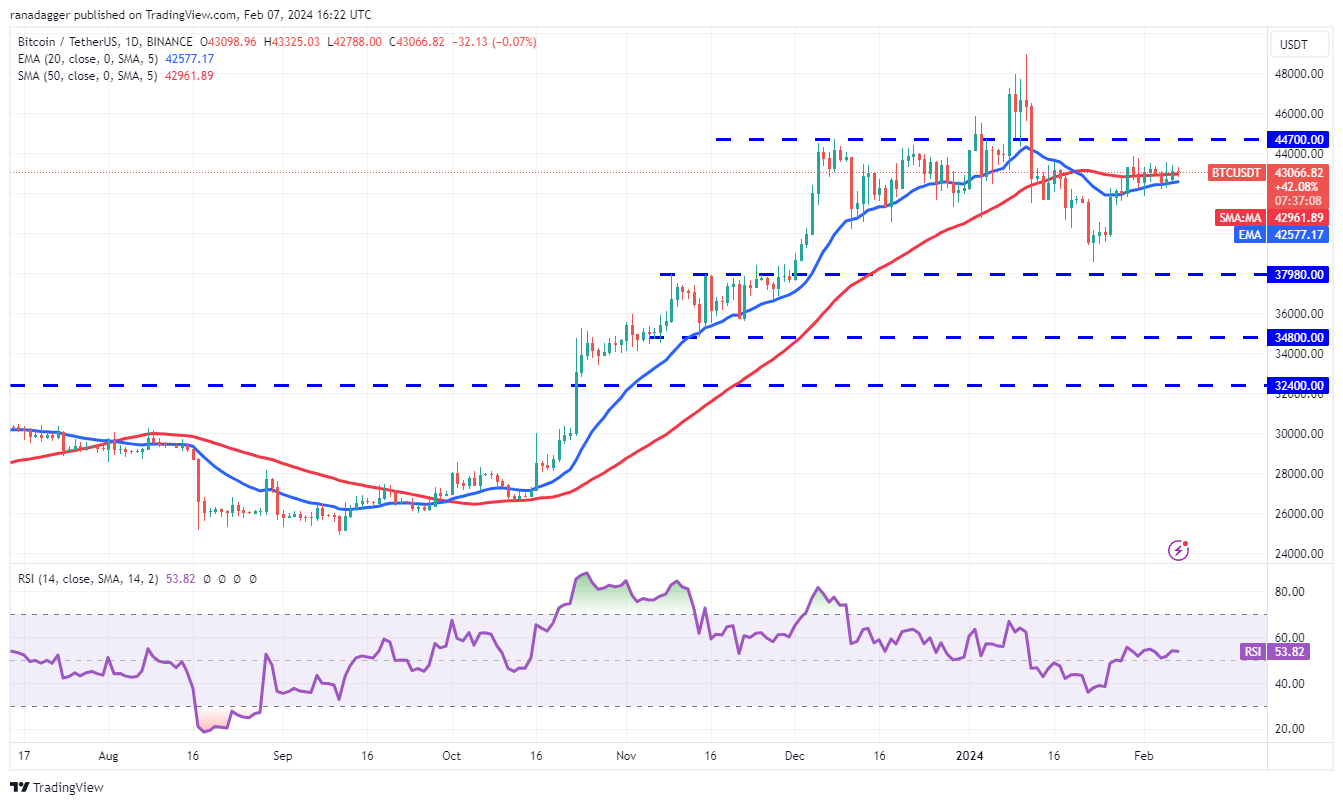
Bitcoin has been trading inside a tight range for the past few days, indicating a tough tussle between the bulls and the bears.
 BTC/USDT daily chart. Source: TradingView
The bulls currently hold a slight edge as the price has been trading above the 20-day exponential moving average ($42,577) for several days. However, buyers will need to overcome the obstacle at $44,700 to build positive momentum. If successful, the BTC/USDT pair may soar to the psychological resistance level at $50,000.
On the other hand, if the price turns down and breaks below the 20-day EMA, it will indicate an advantage to the bears. In this scenario, the pair may experience a slump to $40,000 and eventually to $37,980. However, this level is likely to see solid buying by the bulls, which could provide support.
Ether Price Analysis
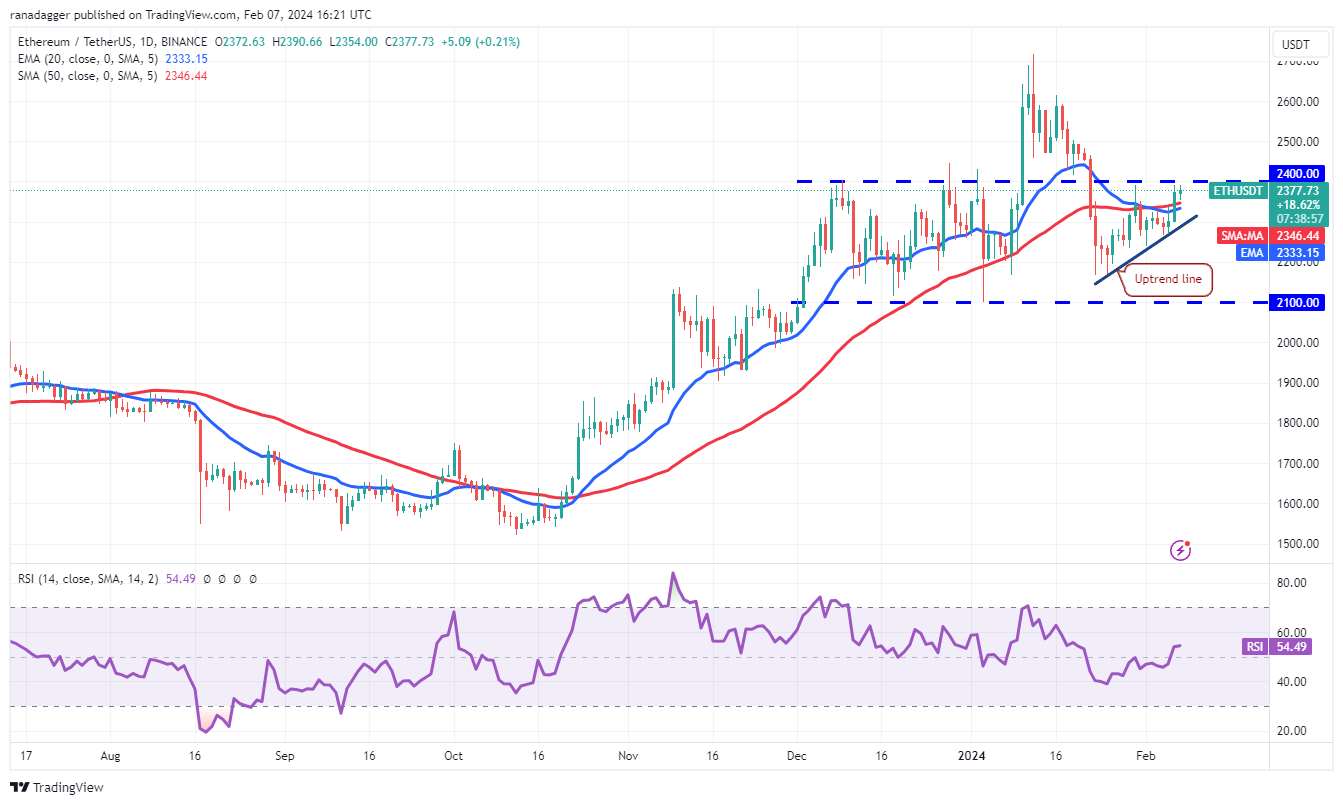
Ether (ETH) surged above the moving averages on February 6, indicating that the bulls are trying to seize control.
 ETH/USDT daily chart. Source: TradingView
The price has reached the stiff overhead resistance of $2,400, which the bears will likely defend with all their might. However, if they fail in their endeavor, the ETH/USDT pair could jump to $2,600 and later to $2,717.
Conversely, if the price turns down sharply and breaks below the uptrend line, it will indicate that the bears are fiercely defending the $2,400 level. In this case, the pair may swing inside the $2,100 to $2,400 range for a few more days.
BNB Price Analysis
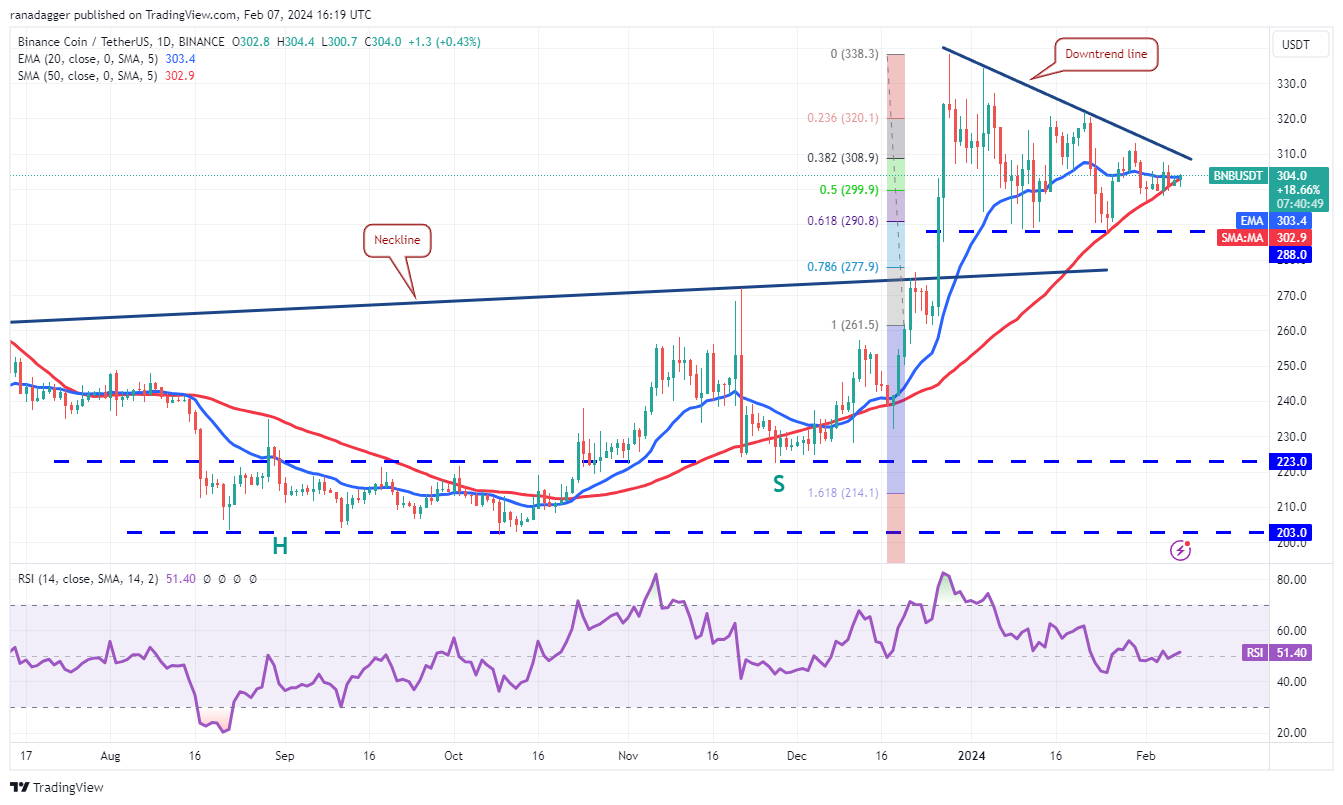
The bulls have managed to ward off the onslaught from the bears and kept BNB (BNB) above the 50-day simple moving average (SMA) ($303) in the past few days.
 BNB/USDT daily chart. Source: TradingView
The flattish 20-day EMA ($303) and the relative strength index (RSI) near the midpoint do not give a clear advantage to either the bulls or the bears. However, a breakout above the downtrend line could fuel a rise to $320 and subsequently to $338.
On the other hand, if the price turns lower and breaks below $296, it will indicate an advantage to the bears. The pair could then descend to the vital support level at $288. If this level cracks, the pair will complete a bearish descending triangle pattern, with the next support on the downside at $260.
Solana Price Analysis
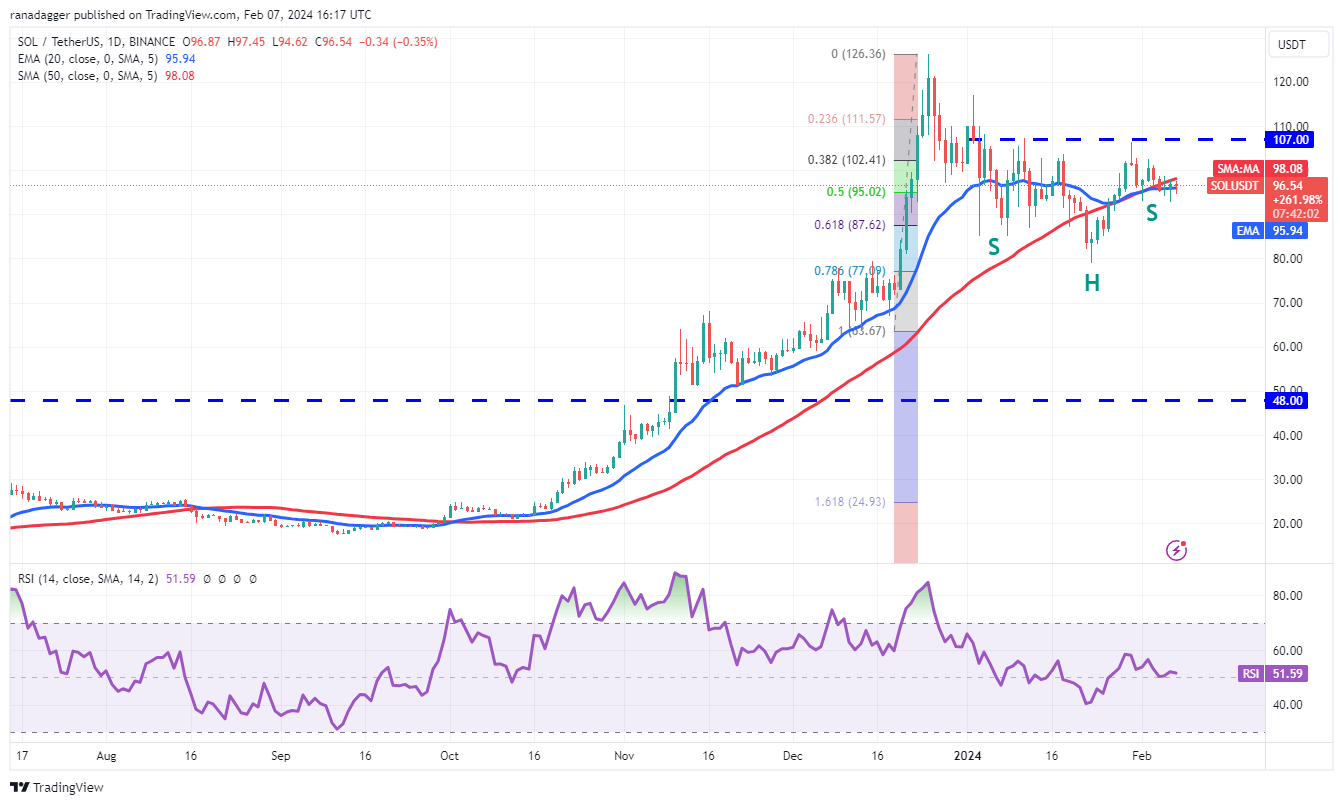
The bulls are finding it difficult to start a rebound off the 20-day EMA ($96) in Solana (SOL), indicating a lack of demand at higher levels.
 SOL/USDT daily chart. Source: TradingView
The immediate support is at $93. If this level gives way, the SOL/USDT pair risks a fall to the strong support at $80. However, if the price turns up sharply from $80, the pair may reach the 20-day EMA. A break above this resistance suggests that the pair may consolidate between $107 and $80 for a while.
The bulls will need to push and retain the price above $107 to regain control. If successful, the pair could then rally to the overhead resistance at $126.
XRP Price Analysis
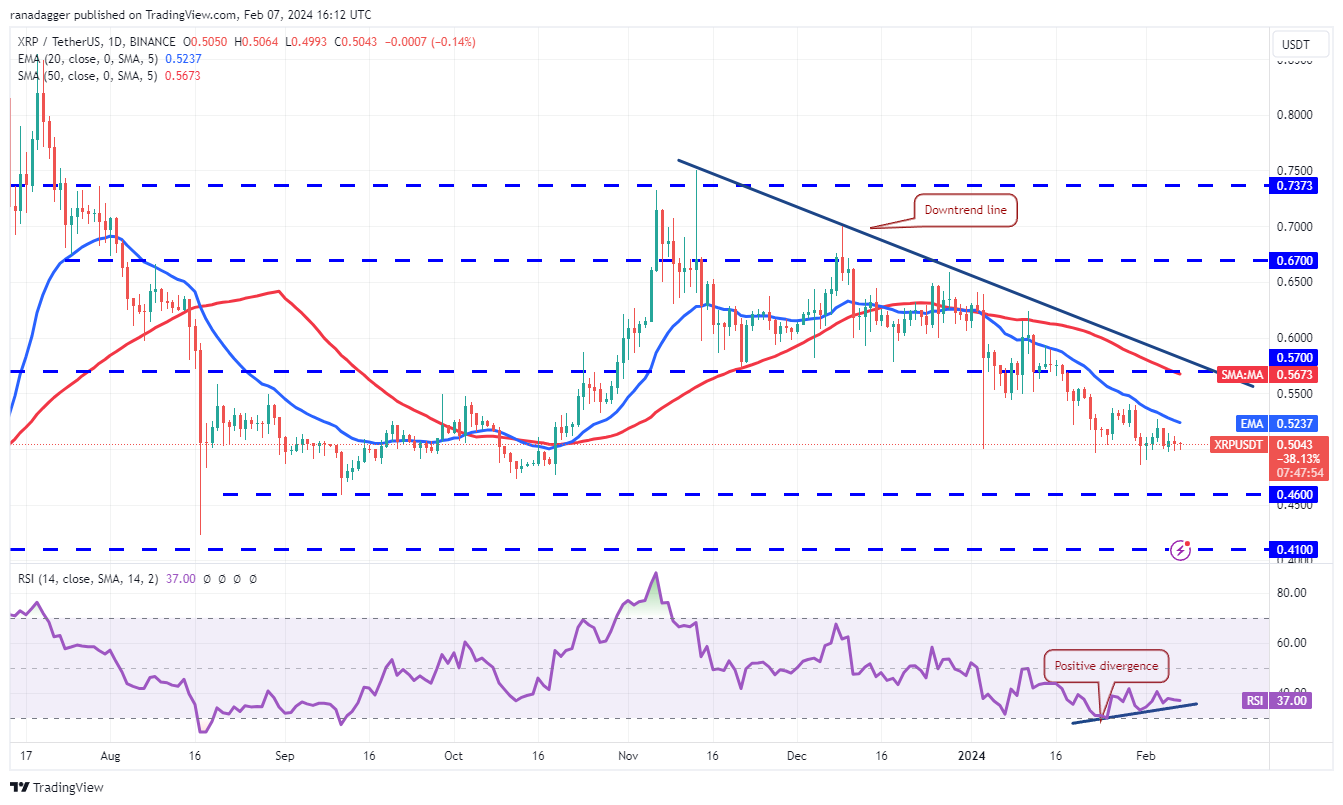
The bulls are trying to hold XRP above the $0.50 support, but the weak bounce suggests that the bears have maintained their pressure.
 XRP/USDT daily chart. Source: TradingView
The XRP/USDT pair is likely to sink below $0.50, which could start the next leg of the down move to the solid support at $0.46. This level has held on two previous occasions, so the bulls will likely try to prevent further decline at this support.
To indicate a potential shift in sentiment where bears may be losing their grip, buyers will have to push and maintain the price above the 20-day EMA. This would then set the pair up for an attempt at a rally to the downtrend line, which remains a key level to watch out for. A break above the downtrend line could suggest the start of a rally to $0.67.
Cardano Price Analysis
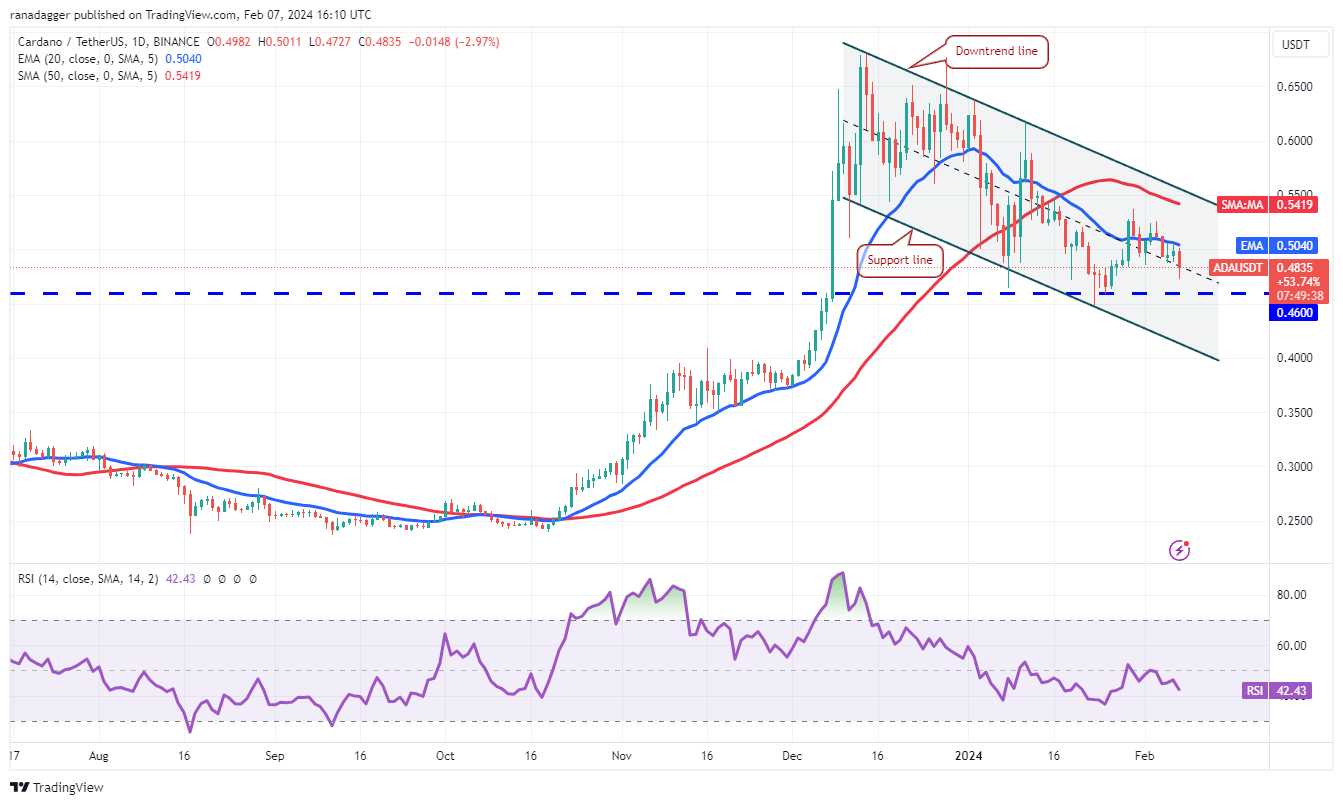
The failure of the bulls to push Cardano (ADA) above the 20-day EMA ($0.50) in the past few days increased selling pressure on February 7.
 ADA/USDT daily chart. Source: TradingView
The ADA/USDT pair could slide to the strong support at $0.46, where buyers are likely to step in. However, if the price bounces off $0.46 but returns from the 20-day EMA, it will indicate that sentiment remains negative and traders are selling on rallies. This would enhance the prospects of a drop to the channel’s support line.
On the contrary, if the price turns up from $0.46 and breaks above the 20-day EMA, it will indicate that the bulls are attempting a comeback. The pair may then surge to the downtrend line.
Avalanche Price Analysis
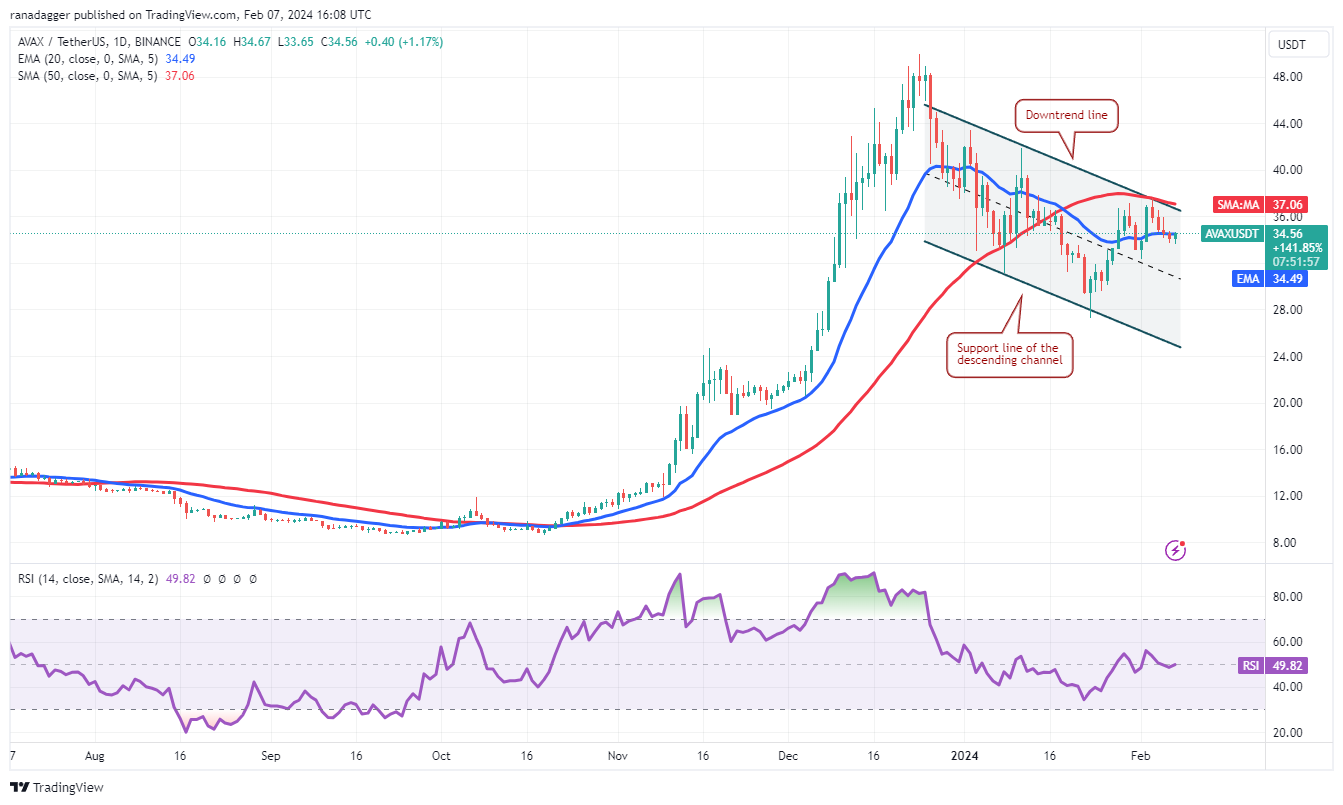
Avalanche (AVAX) tried to start a relief rally from the 20-day EMA ($34.49) on February 5, but the long wick on the candlestick shows that bears are selling at higher levels.
 AVAX/USDT daily chart. Source: TradingView
The bears will try to gain the upper hand in the near term by pulling the price below the $32 support. If they succeed, the AVAX/USDT pair could descend to the support line of the descending channel.
However, if the price turns up and breaks above the downtrend line, it will indicate that the bulls are back in command. This could lead to a potential rally to $44 and $50, serving as critical resistance levels.
Q&A
Q: Could the developing banking crisis boost Bitcoin’s price in the near term?
A: The current banking crisis, as seen in the more than 60% fall in New York Community Bancorp stock since January 30, could potentially have a positive impact on Bitcoin’s price. Investors often turn to alternative assets like Bitcoin during times of economic uncertainty, seeking a safe haven away from traditional banking systems. This increased demand could drive Bitcoin’s price higher in the near term.
Q: Will altcoins follow Bitcoin’s price movement during a banking crisis?
A: Altcoins, which refer to all cryptocurrencies other than Bitcoin, often follow Bitcoin’s price movement as it is considered the market leader and sets the sentiment for the entire cryptocurrency market. Therefore, if Bitcoin’s price increases during a banking crisis, it is likely that altcoins will also experience positive momentum. However, it’s important to note that each altcoin has its own unique characteristics and may exhibit different price patterns compared to Bitcoin.
Polkadot Price Analysis
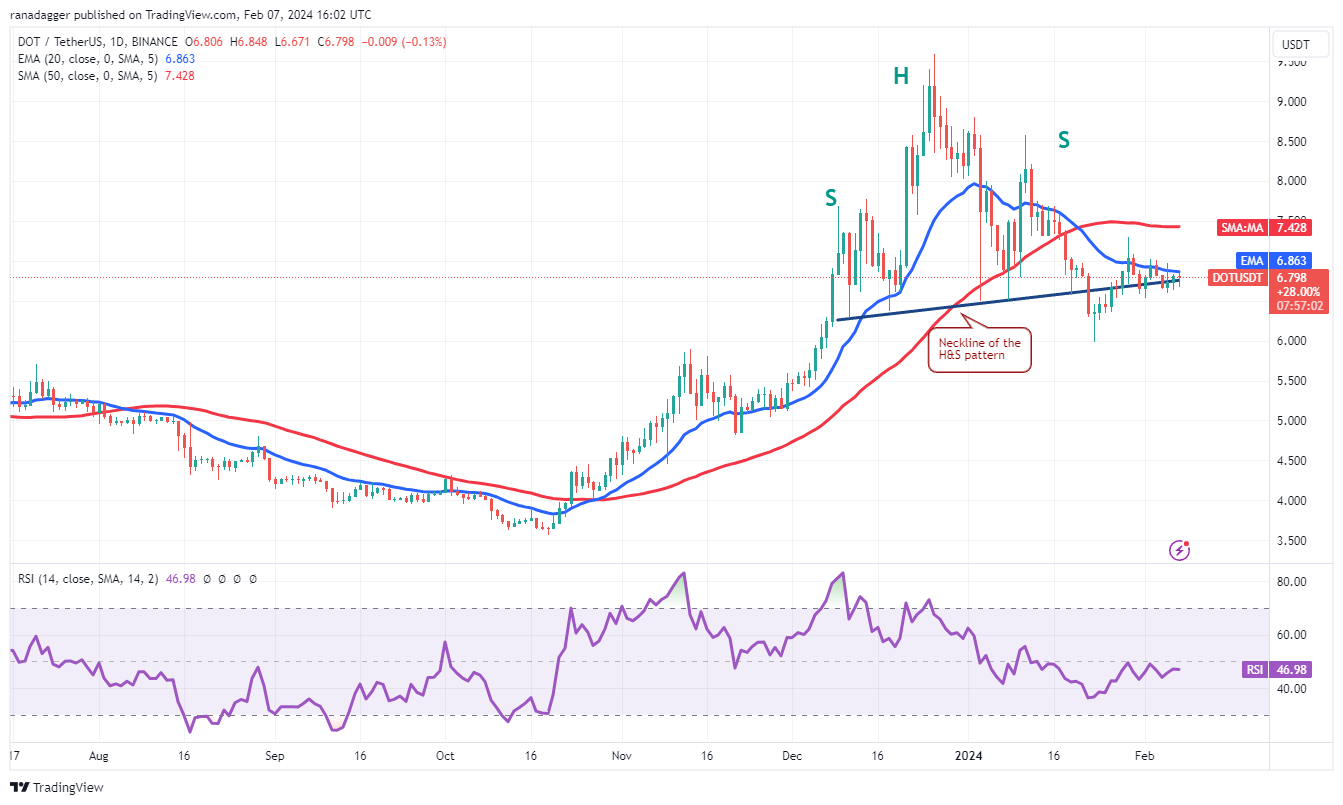
The bulls have repeatedly failed to push and maintain Polkadot (DOT) above the 20-day EMA ($6.86) in the past few days, indicating that bears are aggressively defending this level.
 DOT/USDT daily chart. Source: TradingView
The bears will try to strengthen their position further by pulling the price below the nearby support at $6.50. If they succeed, the DOT/USDT pair could start a downward move to $6 and subsequently to $5.40.
However, any recovery attempt is likely to face selling pressure at the 20-day EMA. If bulls manage to overcome this barrier, the pair may climb to the 50-day SMA ($7.42). A break and close above this level will signal a potential trend change in the near term.
Chainlink Price Analysis
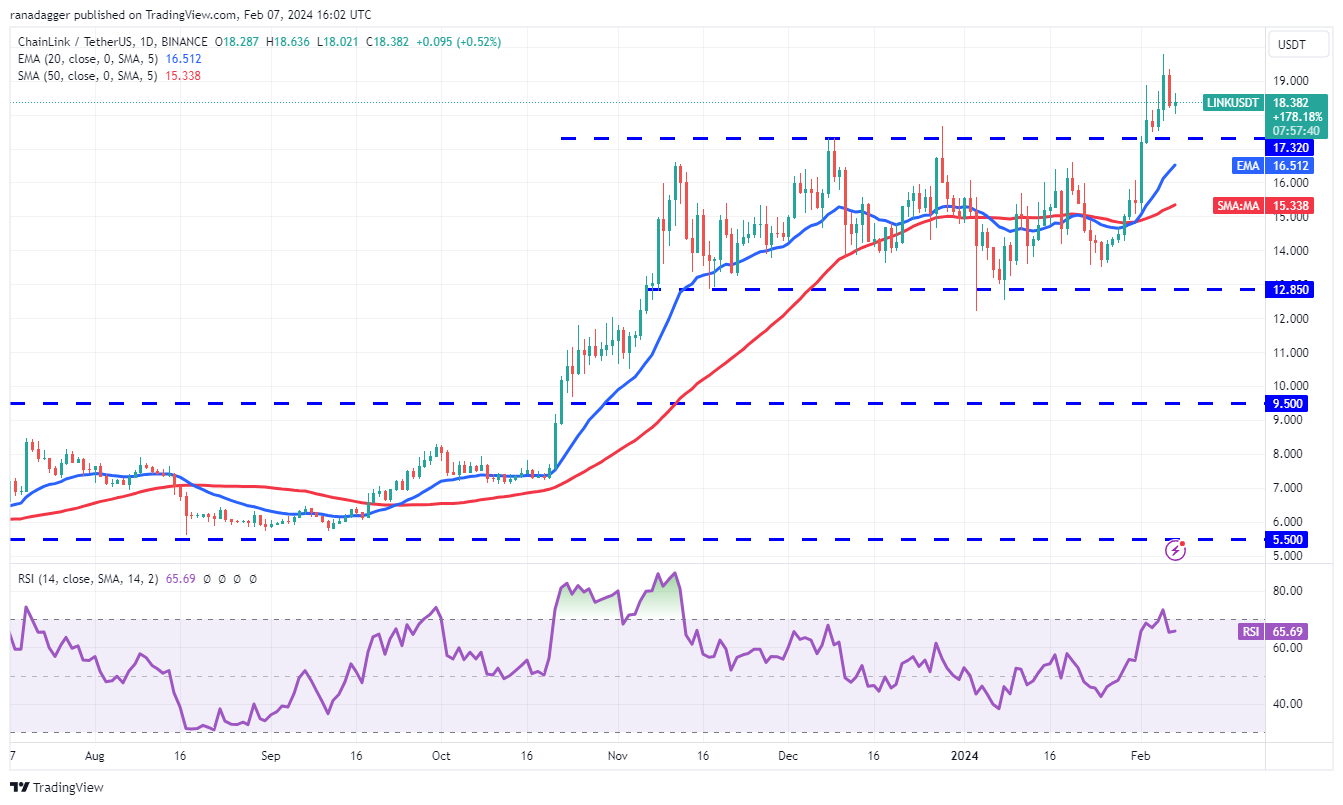
Chainlink (LINK) is currently in an uptrend, but the price turned down from $19.79 on February 5, indicating that bears are vigorously defending the $20 level.
 LINK/USDT daily chart. Source: TradingView
After a breakout from a range, the price usually turns down and retests the breakout level. Therefore, the LINK/USDT pair could drop to $17.32, an important level to keep an eye on.
If the price bounces off $17.32, it will indicate that the bulls have successfully flipped this level into support. This would increase the likelihood of the continuation of the uptrend, with the pair potentially attempting a rally to $21.79.
This positive view will be invalidated in the near term if the price turns down and plummets below the 20-day EMA ($16.51).
Conclusion: What Lies Ahead?
The cryptocurrency market continues to be influenced by ongoing market developments and the broader economic landscape. Bitcoin’s position as a top cryptocurrency and its recent inclusion in ETFs have attracted significant attention from investors.
Future Outlook and Strategies
As we move forward, it’s crucial to keep an eye on key events that could impact cryptocurrency prices. The developing banking crisis and its potential impact on Bitcoin could offer key opportunities for traders and investors alike. Increased adoption and institutional interest in Bitcoin could provide a bullish outlook for the cryptocurrency in the near term.
It’s also important to diversify one’s portfolio and consider the potential of altcoins. While they often follow Bitcoin’s price movement, they can experience unique trends and opportunities. Conducting thorough research and understanding the fundamentals behind each altcoin can help identify potential winners.
Investment Recommendations: It’s recommended to have a combination of Bitcoin and a diversified portfolio of altcoins for the best risk-reward ratio. Careful selection of projects, analyzing team competence, technological innovation, and market demand are key factors to consider.
References – Spot Bitcoin ETFs Expect Day One Trading – Shifting from Gold to Bitcoin – 60% Fall in New York Community Bancorp – Solana’s SOL Dips 100, Slips Back in BNB Crypto Ranking – Regulated OTC desks could spur crypto adoption – XRP Price Prediction: XRP Drops $0.60 Support, Time to Buy the Dip? – Polkadot’s DOT Circulating Market Cap Rockets to $83 Billion, Registers Massive 111% Growth
Feel free to share this article on your social media channels and let us know your thoughts in the comments section below. 💬👇
We will continue to update Blocking; if you have any questions or suggestions, please contact us!
Was this article helpful?
93 out of 132 found this helpful
Related articles
- 🚀 Spot Crypto Trading Volume Soars as Bitcoin ETFs Gain Approval 🚀
- Cardano (ADA) Battles Bullish and Bearish Forces: Mixed Signals Leave Investors Perplexed
- Ethereum Dencun Upgrade: A Game-Changing Boost for ETH 🚀
- Canadian Fintech Investments Shift Towards Crypto and Blockchain
- 🚀 Bittensor Token: Is It Too Late to Buy?
- Tokenization of Real-World Assets Drives Chainlink’s Price Surge
- Bitcoin: Positive Catalysts for a Potential Rally 🚀💰