QKL123 market analysis | US stocks remelt, gold and crude oil fell, bitcoin was cut … chain reaction under crisis (0313)
Abstract: The global capital market is avalanche, and the economic paradigm shift has come; Bitcoin has been affected, and under multiple effects, it has recorded the largest single-day drop since 2014. The haze of the recent global crisis has not disappeared, and Bitcoin has started to make a second bottom in the large cycle, but it is the best time to save money or store coins regularly.
")
At 15:00 today, the 8BTCCI broad market index was reported at 7419.60 points, and the 24-hour rise and fall was -29.95%, reflecting the market's severe fall. The total turnover was 18.41064 billion yuan, with a 24-hour change of + 77.88%, and market activity increased significantly. The Bitcoin strength index was reported at 92.82 points, with a 24-hour change of -4.91%. The relative performance of altcoin in the entire market has weakened significantly; the Alternative sentiment index is 10 (previous value 14), and the market sentiment is expressed as extreme fear; The external discount premium index was reported at 105.58, with a 24-hour rise or fall of + 3.35%, and the intensity of OTC fund inflows increased significantly.
Analyst perspective:
- Babbitt Original | Futures burst in a row, miners have been circled, 3000 dollars is the last pass?
- Anthony Pompliano: Liquidity crisis causes global market shocks, Bitcoin will be the ultimate winner
- Don't despair
In the past 24 hours, the global capital market has collapsed, and the stock markets of dozens of countries, including the US stock market, have melted out. Global capital liquidity is drying up, and gold has also been temporarily sold, with the largest drop of more than 5%. International crude oil fell again sharply (Brent crude oil futures fell 7%). As a result of the debt of most American companies, it increased the possibility of systemic risks in the capital market. The global economic crisis, which has taken place once every ten years or so, has already begun, the economic paradigm shift has officially started, and global stock markets have begun to transition from panic optimism to panic. Now, under extreme panic, cash is king, and it is urgent to wait for the return of funds under economic stimulus.
In the nest, Bitcoin was not spared, and the 24-hour maximum drop was almost cut, creating the largest single-day drop since 2014. The reason why crypto assets such as Bitcoin have fallen so much is not only related to the panic of global capital markets, but also to the crypto asset market itself. On the one hand, the chain reaction of the short positions in the leveraged futures market increased the downside risk of the market, and on the other hand, Bitcoin was concentrated in the $ 7,200 area, and a large number of chips were breached, which in turn triggered an accelerated decline in the future.
At present, bitcoin has severely deviated from the long-term trend. Due to the impact of the "black swan" of the global economy, it has started to make two bottoms in the large cycle after the end of 18th. Is Bitcoin gone forever (pessimistic) or Bitcoin's investment opportunity (optimistic)? The author holds a relatively neutral attitude. Because of the current situation, the organic crisis is inevitable: global economic turbulence is inevitable, market confidence is difficult to repair in the short term, and it is difficult for Bitcoin to get out of the bottom at a glance. This is a potential risk; and the opportunity is that it is no longer at the bottom In the long run, if a flood of floods similar to the 2008 crisis follows, Bitcoin will usher in an important turnaround.
First, the spot BTC market
")
BTC started to rebound at a minimum of $ 3,800, and the rate of decline in the day was much faster than market expectations. During the rebound, there was a significant spread between Coinbase and Huobi, with a maximum of 1,000 US dollars, which narrowed after more than two hours, or caused by poor entry and exit of trading platform funds. The BTC trading volume was released in the day, and the 5000-dollar chips below were relatively concentrated, and they were supported in a short time. The inflow of funds inside and outside the market was obvious and continued to rebound.
Second, the spot ETH market
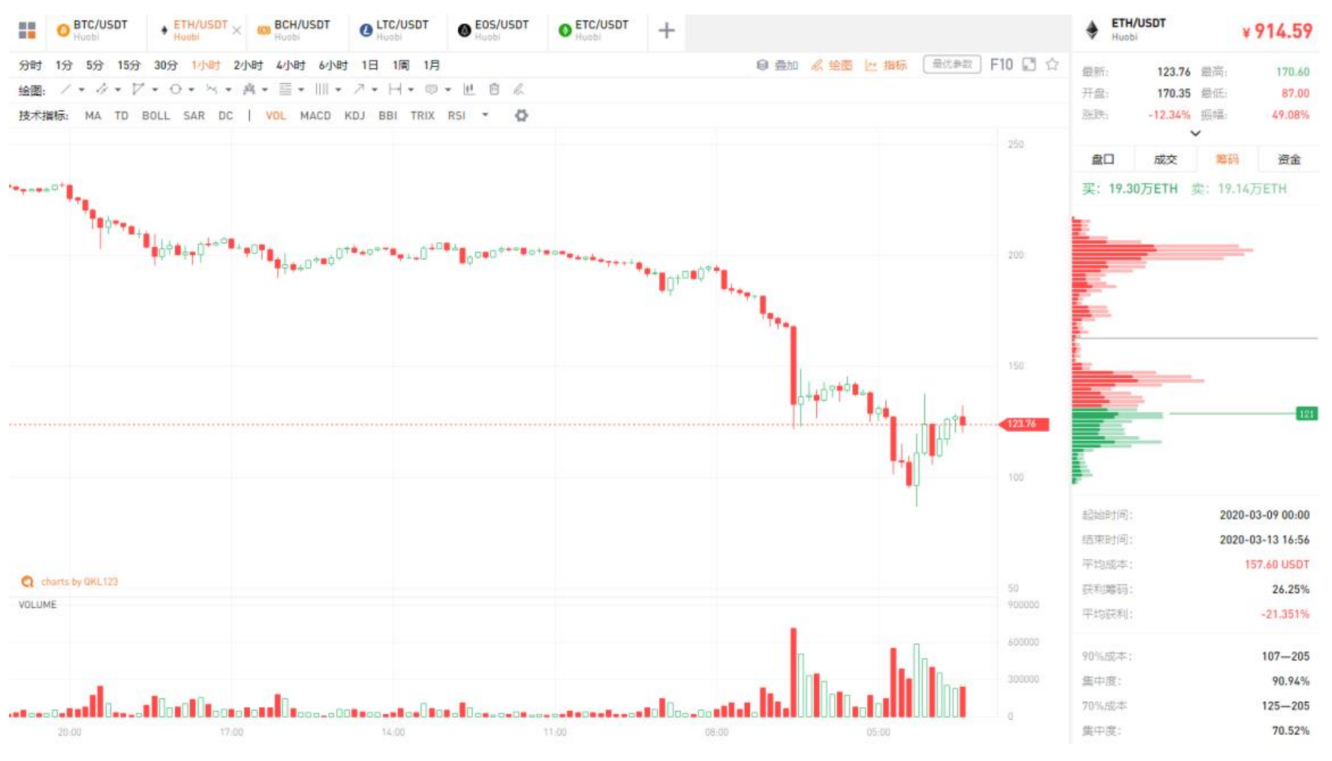
ETH fell sharply, reaching a minimum of 88 US dollars, and then rebounded heavily, but fell after reaching 136 US dollars, indicating that the pressure here is greater. The 120-dollar chips below are more concentrated, and continue to test the pressure for a short time.
Third, the spot BCH market
")
BCH rebounded heavily after hitting a minimum of 130 US dollars. The chip concentration area currently at 176 US dollars will test support shortly.
Fourth, the spot LTC market
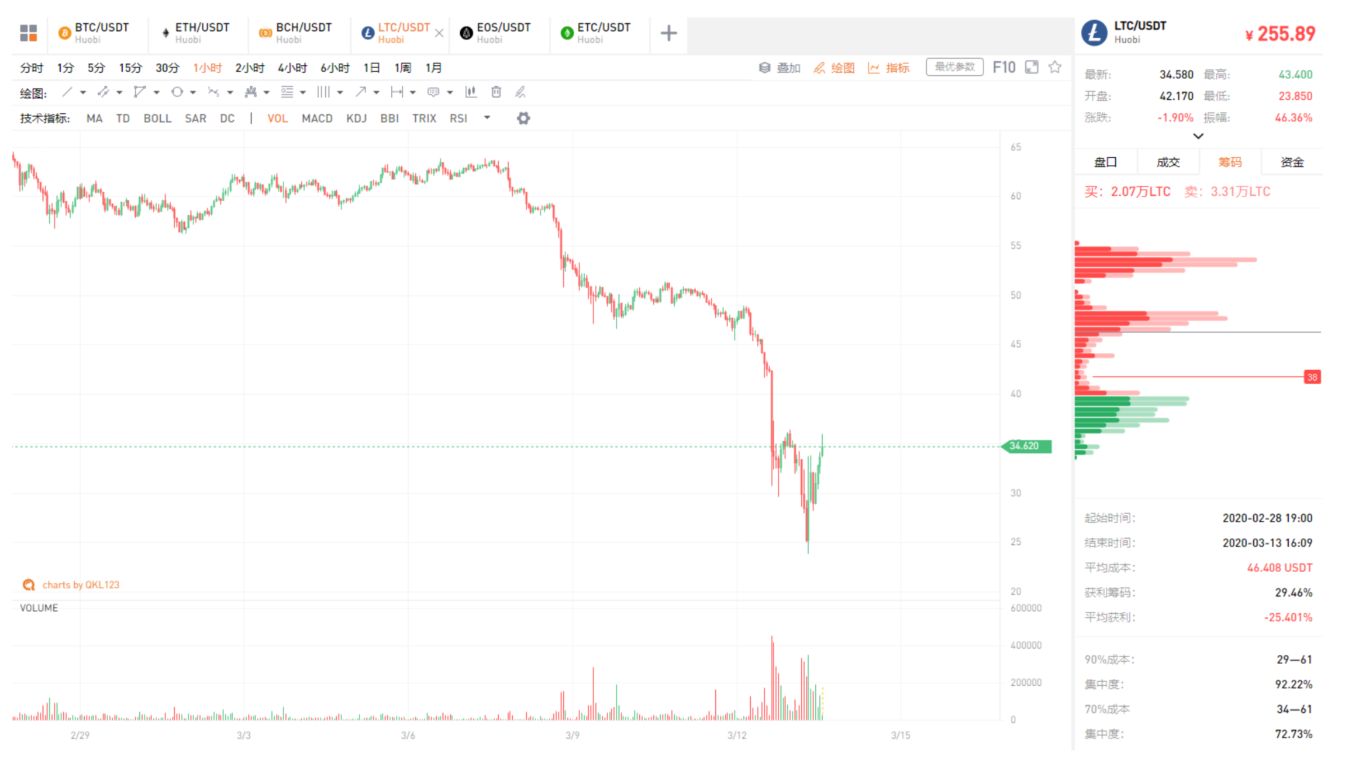
LTC touched a minimum of $ 24, and the current rebound is strong, and the short-term pressure of $ 34 was tested.
V. Spot EOS Quotes
")
EOS broke through multiple support levels and is currently rebounding at a low point of 1.4 dollars. The short-term trading chips are mainly concentrated at 1.8 dollars. The pressure of 2.14 dollars is obvious, and it is expected to continue testing in the short term.
Six, spot ETC market
")
The biggest drop in ETC was almost cut, with a significant volume near $ 3.7, and the pressure above $ 4.6 was greater. The short-term is mainly the inflow of retail funds, the main funds are still hovering, and the main link is Bitcoin.
Analyst strategy
1. Long line (1-3 years)
Although the long-term trend of BTC is bad, but this is not far from the bottom, it is a good time for Tuncoin to invest. You can refer to the coin storage indicator. The smart contract platform leader ETH, altcoin leader LTC, DPoS leader EOS, BTC fork currency leader BCH, and ETH fork currency leader ETC can be configured on dips.
2. Midline (January to March)
Recently affected by the financial environment, panic has been released, but bitcoin has the possibility to continue to bottom, and those who have not heavy positions intervene in batches.
3. Short-term (1-3 days)
There has been a rebound, short-term uncertainty is large, small positions attract low and sell high.
Appendix: Interpretation of Indicators
1. 8BTCCI broad market index
The 8BTCCI broad market index is composed of the most representative tokens with large scale and good liquidity in the existing global market of the blockchain to comprehensively reflect the price performance of the entire blockchain token market.
2.Bitcoin Strength Index
The Bitcoin Strength Index (BTCX) reflects the exchange rate of Bitcoin in the entire Token market, and then reflects the strength of Bitcoin in the market. The larger the BTCX index, the stronger the performance of Bitcoin in the Token market.
3.Alternative mood index
The Fear & Greed Index reflects changes in market sentiment. 0 means "extremely fearful" and 100 means "extremely greedy." The components of this indicator include: volatility (25%), transaction volume (25%), social media (15%), online questionnaire (15%), market share (10%), and trend (10%).
4.USDT OTC Premium Index
The ChaiNext USDT OTC INDEX index is obtained by dividing the USDT / CNY OTC price by the offshore RMB exchange rate and multiplying by 100. When the index is 100, it means the USDT parity, when the index is greater than 100, it means the USDT premium, and when it is less than 100, it means the USDT discount.
5.Net Funds Inflow (Out)
This indicator reflects the inflow and outflow of funds in the secondary market. By calculating the difference between the inflow and outflow of funds from global trading platforms (excluding false transactions), a positive value indicates a net inflow of funds, and a negative value indicates a net outflow of funds. Among them, the turnover is counted as inflow capital when rising, and the turnover is counted as outflow capital when falling.
6.BTC-coin hoarding indicator
The coin hoarding indicator was created by Weibo user ahr999 to assist bitcoin scheduled investment users to make investment decisions in conjunction with the opportunity selection strategy. This indicator consists of the product of two parts. The former is the ratio of Bitcoin price to the 200-day fixed investment cost of Bitcoin; the latter is the ratio of Bitcoin price to Bitcoin fitting price. In general, when the indicator is less than 0.45, it is more suitable to increase the investment amount (bottom-sweeping), and the time interval accounts for about 21%; when the indicator is between 0.45 and 1.2, the fixed investment strategy is suitable, and the time interval accounts for about 39. %.
Note: Crypto assets are high-risk assets. This article is for decision-making reference only and does not constitute investment advice.
We will continue to update Blocking; if you have any questions or suggestions, please contact us!
Was this article helpful?
93 out of 132 found this helpful
Related articles
- Is Bitcoin too hot? $ 400 million in Grayscale secretly picked up the disk
- Bitcoin cuts: 10 billion yuan in single-day short positions in the entire network.
- Babbitt Column | What Can I Use to Save You
- Global market stampede panic plunges: bitcoin has been bloodbathed, and the blockchain sector has plummeted
- In-depth research 丨 Lightning attacks in efficient markets
- ShapeShift CEO Open Letter: Born from Dark Bitcoin
- Dogecoin founder Jackson Palmer: forget about the financial nature of cryptocurrencies, this is just a technology