2019 second quarter cryptocurrency report: Why does BTC stand out?


In the financial industry, analysts widely use correlation indicators to effectively allocate assets for diversification. Although the crypto-asset industry is still in its infancy, such metrics have gradually gained the attention of stakeholders, both institutional and retail.
Based on the research on the correlation of some large-scale cryptographic assets in the first half of 2019, this report was formed. The aim is to analyze and anticipate future trends by observing recent changes in the relevance of the digital asset industry.
The report points are as follows:
- Bitcoin's total network computing power plunged 10% every day? That is the lucky value at work.
- "Bitcoin's biggest benefit this year" finally started.
- Platform development, protocol upgrades, code delivery – 2nd anniversary of the birth of BCH
- The digital asset market has experienced the best three months since 2017, as measured by changes in overall market capitalization;
- BTC showed a high average correlation with other crypto assets in the first quarter of 2019, but its correlation declined significantly in the second quarter. During this period, BTC prices rose by 300%, and the market share reached more than 60%, setting a new high for the year;
- In the second quarter of 2019, encrypted assets, such as BNB, LINK, or BSV, that were affected by more significant traits (such as major news events) exhibited lower average correlations with other cryptographic assets;
- “coin security effect”: the average correlation of digital assets that are not on the currency platform is lower than that of the digital assets in the previous currency;
- The correlation between the privacy currencies is higher than the average;
- The correlation between two cryptographic assets with similar functions (such as XRP and XLM) seems to be above average;
- The cryptographic assets publicly released on the Binance Launchpad are, on average, less correlated with each other, probably because they are affected by more trait factors. However, the two projects that started IEO in March 2019 showed a very high correlation (0.87) between Fetch (FET) and Celer Network (CELR).


Strong performance in the second quarter of 2019
Despite a fall in the last few days of the second quarter, the overall performance of the crypto asset market in the first two quarters of 2019 was very strong.
In the last quarter, the total value of the crypto-asset industry rose by 139%, the third fastest growth rate in the industry since 2014. In terms of absolute dollar amounts, the total dollar value of crypto assets increased by approximately $19 billion in the second quarter of 2019, ranking second in the quarterly increase history since 2014, second only to the bull market in the fourth quarter of 2017. rise.
Figure 1: Quarterly change in the market value of crypto assets in 2019 (%)
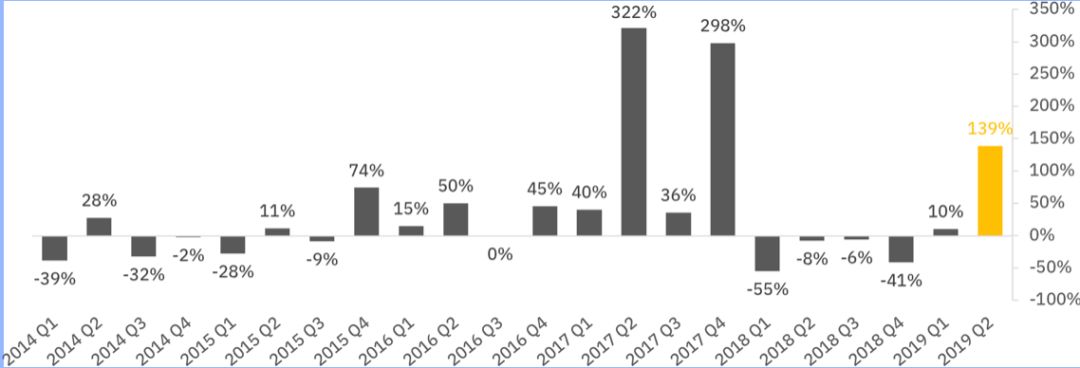
Source: Binance Research, CoinMarketCap
Figure 2: Quarterly change in the market value of crypto assets in 2019 (billions of US dollars)
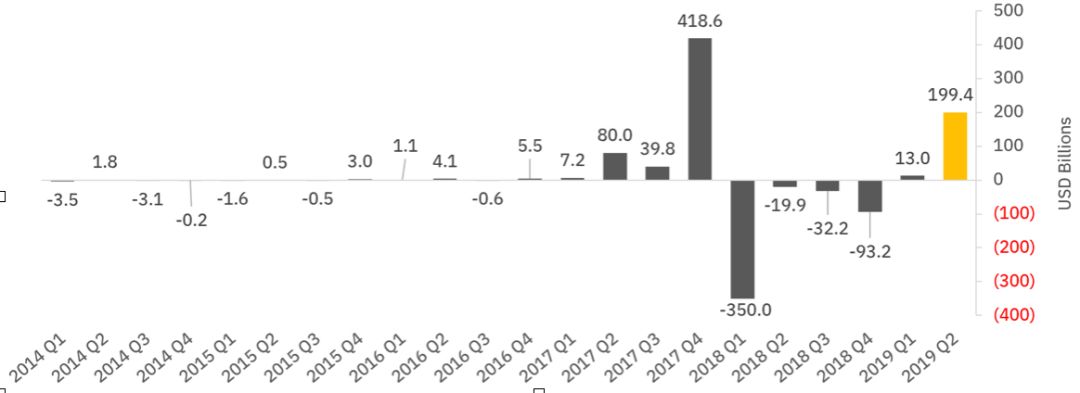
Source: Binance Research, CoinMarketCap

Relevance overview for the second quarter of 2019
Statistically, correlation measures the strength of the linear relationship between two random variables, ranging from -1 to 1.
In general, assets with correlation coefficients above 0.5 or below -0.5 are considered to have strong positive/negative correlations. Conversely, a correlation coefficient close to zero indicates a lack of a linear relationship between the two variables. In this analysis, these two variables refer to the yields of the two assets.
If the yields of the two assets are positively correlated, it indicates that the fluctuations of the two assets tend to be in the same direction, so they face similar risks. If the yields of the two assets are negatively correlated, it means that the two assets have the opposite direction of fluctuation, so one of the assets can be used to hedge the risk of the other.
This report selects 30 cryptographic assets as samples, based mainly on the average market value ranking from January to June 2019.
In the next section, we explore the relevance of the second quarter of 2019 and draw observations from the data set.
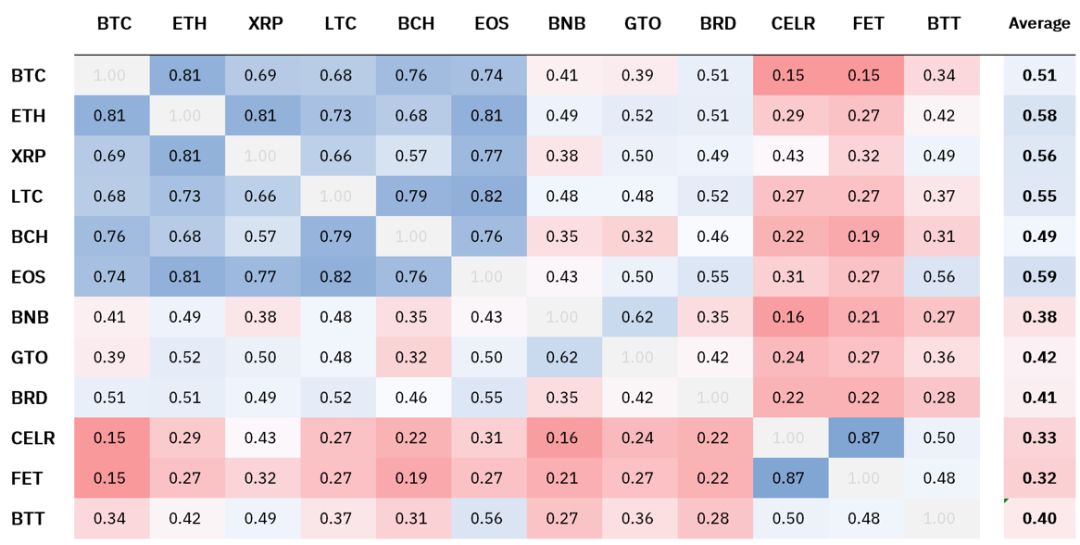
Figure 3: Main Market-Value Assets Second Quarter 2019 Quarterly Rate of Return Correlation Matrix (in US dollars)

Source: Binance Research, CoinMarketCap
The overall correlation between the above-mentioned digital assets with higher market capitalization is still high, and the correlation between most of the assets and other encrypted assets is above 0.5.
In addition, there is no negative correlation between any pair of cryptographic assets, which indicates that the impact of specific factors on the performance of individual digital assets is still relatively slight, and the price of individual crypto assets is still affected by the overall market changes.
However, analysis of several specific factors and events suggests that they may have an impact on the relevance of specific crypto assets in the second quarter of 2019.
- Chainlink (LINK): In June, the company announced that Google would integrate Chainlink for smart contract functionality. The Matic Network, which successfully completed the token sale on the Binance Launchpad, also announced a partnership with Chainlink.
- Bitcoin SV (BSV): The founder's words and deeds were inappropriate, and the rumors were rumored to be rumored. The product was removed from several large trading platforms (such as BCHSV/BSV), which resulted in its independence from the entire market. Abnormal price fluctuations.
- Coin (BNB): BNB changed from the largest ERC-20 token in Ethereum to the original currency of the coin chain, and the price continued to rise in the first half of 2019. Other news and events related to the currency have also contributed to the market's increased interest in the currency, such as new features such as spot leverage trading published on centralized trading platforms (eg OCO orders), and new currency transactions around the world. Development of the platform (coin security Singapore trading platform, etc.).
In addition to the specific “catalysts” associated with the project, we have previously used “consensus mechanism design” and “exchange on the currency” as key factors influencing the relevance of specific crypto assets. In reviewing these factors, we observed some similar effects in the second quarter of 2019.
- The “coin security effect”: Tezos (XTZ), Doge (DOGE) and Bitcoin SV (BSV) all show a low correlation with other cryptographic assets. Interestingly, Bitcoin SV was removed from the currency, resulting in a very low correlation with other crypto assets in the first and second quarters of 2019.
- Consensus mechanism: Compared to previous reports, consensus mechanism design still seems to affect the correlation between assets. On average, in the second quarter of 2019, assets that use the workload proof mechanism are more relevant to each other than to assets that use non-workload proof mechanisms.
In addition, from the dataset, we have observed other specific factors that influence correlation (see Figure 3):
- Privacy factor: The correlation between Dash and Monroe (XMR) is extremely high (0.85), and as both focus on protecting privacy, this trend seems clear. If Litecoin (LTC) implements MimbleWimble in the future, it will be interesting to closely monitor the follow-up correlation between Litecoin and the above two digital assets.
- Functionally similar: A very high correlation (0.87) is shown between Ripple and Star (XLM). Although the stellar coin was originally created based on the Ripple protocol, its code was quickly forked and modified. However, these two crypto assets still have several similarities, as they are all committed to “reinventing the global remittance industry”.
Next, we compare these results with the results for the first quarter of 2019.

Horizontal comparison of two quarters
Figure 4: Daily market yield correlation matrix for large market capitalizations in the first quarter of 2019 (in US dollars)

Source: Binance Research, CoinMarketCap
Most of the correlations are similar to our March 2019 report on the relevance of cryptographic assets. However, it is worth noting that the average correlation between BTC and all other major crypto assets in the second quarter fell from 0.73 to 0.61.
On the other hand, in the first quarter and the second quarter, the average correlation between other cryptographic assets has remained stable between 0.57 and 0.58. However, the average correlation coefficient of each of these cryptographic assets has changed, as shown in the following table:
Figure 5: Q1-Q2, average correlation change

Some interesting phenomena can be found from the above table:
The correlation between BTC and other cryptographic assets declined in the second quarter of 2019 compared to the first quarter. The correlation between BTC and altcoin decreased, and the average correlation decreased by 0.11.
As mentioned above, the overall market value of crypto assets increased by 139%, while the total market value of altcoin (including stable currencies) increased by only 71%. This is most likely because crypto-investors will make safe investment transfers in the early bull market.
Compared with the first quarter of 2019, the correlation between cryptographic assets (such as BCH, DOGE, BTC, ETC, BTG) using the workload proof mechanism and other cryptographic assets is reduced. Encrypted assets using the workload proof mechanism do not appear to be highly correlated with each other, and the correlation with other cryptographic assets is more significantly reduced.
The average correlation between Tezos (XTZ), Ontology (ONT) and Wavefield (TRX) and other digital assets increased the most.
On the other hand, the average correlation of BSV declined the most, probably because it was removed from Kraken and the currency trading platform. Interestingly, the correlation between Dogecoin (DOGE) and other cryptographic assets is further reduced, but remains highly correlated with Litecoin (0.55), probably due to the merger of the two currencies.
Despite some structural changes from the first quarter of 2019 to the second quarter, the correlation between most cryptographic assets is still high, with an average correlation of 0.57 in the second quarter.
Therefore, within the crypto-asset industry, it is still difficult to achieve risk diversification by only making long positions in large-cap value-encrypted assets.
However, investing in low-capital-encrypted assets or adopting alternative strategies such as long/short combination may help investors build market-neutral portfolios. As investors have access to more DeFi and leveraged products, they may be able to access more liquid and complex financial instruments to help them build more unique investment strategies in the future.

Digital Asset Correlation on the Launchpad Platform
From January to March 2019, Binance Launchpad successfully completed three IEOs (the first trading platform release):
- On February 3, 2019, BitTorrent (BTT) was issued;
- On March 2, 2019, Fetch.AI (FET) was issued;
- On March 24, 2019, the Celer Network (CET) was released.
This section analyzes the correlation strength of these IEO digital assets in the last quarter in the second quarter (March 31-June 30, 2019).
Although the target niche markets for these projects are not relevant (BitTorrent focuses on decentralized file sharing, Fetch focuses on advanced data markets, and Celer focuses on Tier 2 scalability), but they are all in similar market conditions. The shelves were put on the open market immediately after the completion of the public offering.
We selected the seven digital assets with the largest market capitalization on June 30, and five projects that sold tokens on the currency trading platform before the start of the second quarter of 2019. Then, the correlation calculation was carried out using the closing and closing of each item between March 31 and June 30.
Figure 6: Digital Assets Daily Yield Correlation Matrix (in US dollars) issued on Launchpad in the second quarter of 2019
It is clear that the three IEO projects in the first quarter of 2019 are highly independent of other digital assets on the market and have the lowest correlation with high market capitalization assets.
This effect is more evident in the recent release of Launchpad, but it is quite different from the two projects in the year of 2017, Bread (BRD) and Gifto (GTO). On average, the average correlation between the three IEO projects and all other digital assets in the group was 0.32, while the average correlation of the other nine projects was 0.58.
We can see that although the first three IEO projects were recently priced at BNB (at least in part), their correlation with BNB is also low, averaging 0.22.
Interestingly, among the three, BitTorrent (BTT) is the only one that accepts both BNB and TRX digital assets for fundraising at the time of sale, but it has the highest correlation with BNB ( Just 0.27).
The correlation between the three IEO projects is relatively high compared to the recent correlation between IEO projects and non-IEO projects, with the lowest correlation being BTT and FET (0.48). One of these odd numbers occurred between Fetch and Celery, which showed an amazingly high correlation in the second quarter of 2019, reaching 0.87. This phenomenon may occur because they were released under similar market conditions in March, and BitTorrent was issued a full one month earlier than them.
It remains to be seen how many industry characteristics or the nature of the project itself contribute to the overall relevance. As more and more assets go into IEO, we also need to see if some of the results in this report will remain the same in the future and whether they will apply to a wider range of cryptographic assets.

Conclusion: The correlation volatility trait factor can not be ignored
Overall, the average correlation between BTC and most other large-capacity crypto assets in the second quarter of 2019 has decreased compared to the previous quarter, however, the overall correlation between other crypto assets remains high. .
The trait factor is a key factor affecting the correlation between different digital assets, which is consistent with our previous observations.
The significant decline in the correlation between BTC and other assets may be caused by the “quality preference” of potential investor behavior, which is very similar to the situation when the BTC market share increased in the early bull market in 2017.

Binance Research author
Edited by Sonny Sun
Roy typesetting
The content is for reference only, not as an investment recommendation.
Copyright is strictly prohibited without permission
We will continue to update Blocking; if you have any questions or suggestions, please contact us!
Was this article helpful?
93 out of 132 found this helpful
Related articles
- Why can Libra fight against Alipay and WeChat?
- Getting started with the blockchain | Luo Yonghao: Most people don't understand the blockchain, so can't talk to the blockchain with friends?
- Bakkt is finally here, it’s time to buy a Starbucks with it.
- Nearly half of the UK and Americans don't believe in Facebook's Libra
- Blockchain Industry Weekly | Firecoin Hong Kong stock platform acquires Japanese IDC assets, Facebook hearing is not yet to be continued
- Mercedes-Benz parent company Daimler loves the blockchain and wants to develop an open car hardware wallet solution
- Jingdong Cloud launched the problem that Zhiyun chain “cloud” planning has to face