🚀 Bitcoin Price Analysis: Is $76,000 Next? 🌝
A bullish indicator known as the inverse head and shoulders (iH&S) pattern has emerged on the 1-hour chart of Bitcoin.Bitcoin is showing an inverse head and shoulders pattern and targets $76,000.
Just below the all-time high of $69,000, the Bitcoin price has shown more volatility in recent days, only to now tread water around $67,000. But this boredom could soon be over. Following the recent price movements, a notable pattern has emerged on the Bitcoin (BTC) price chart, as recognized by the seasoned crypto analyst Josh Olszewicz.
📈 An Inverse Head and Shoulders Pattern On the Rise
An inverse head and shoulders (iH&S) pattern, often seen as a bullish indicator, has formed on the Bitcoin 1-hour chart, suggesting a potential upward price movement. This pattern, while admittedly imperfect as per Olszewicz, is considered tradeable in his view. “[The] pattern is definitely not perfect but still tradeable imo,” he remarked.
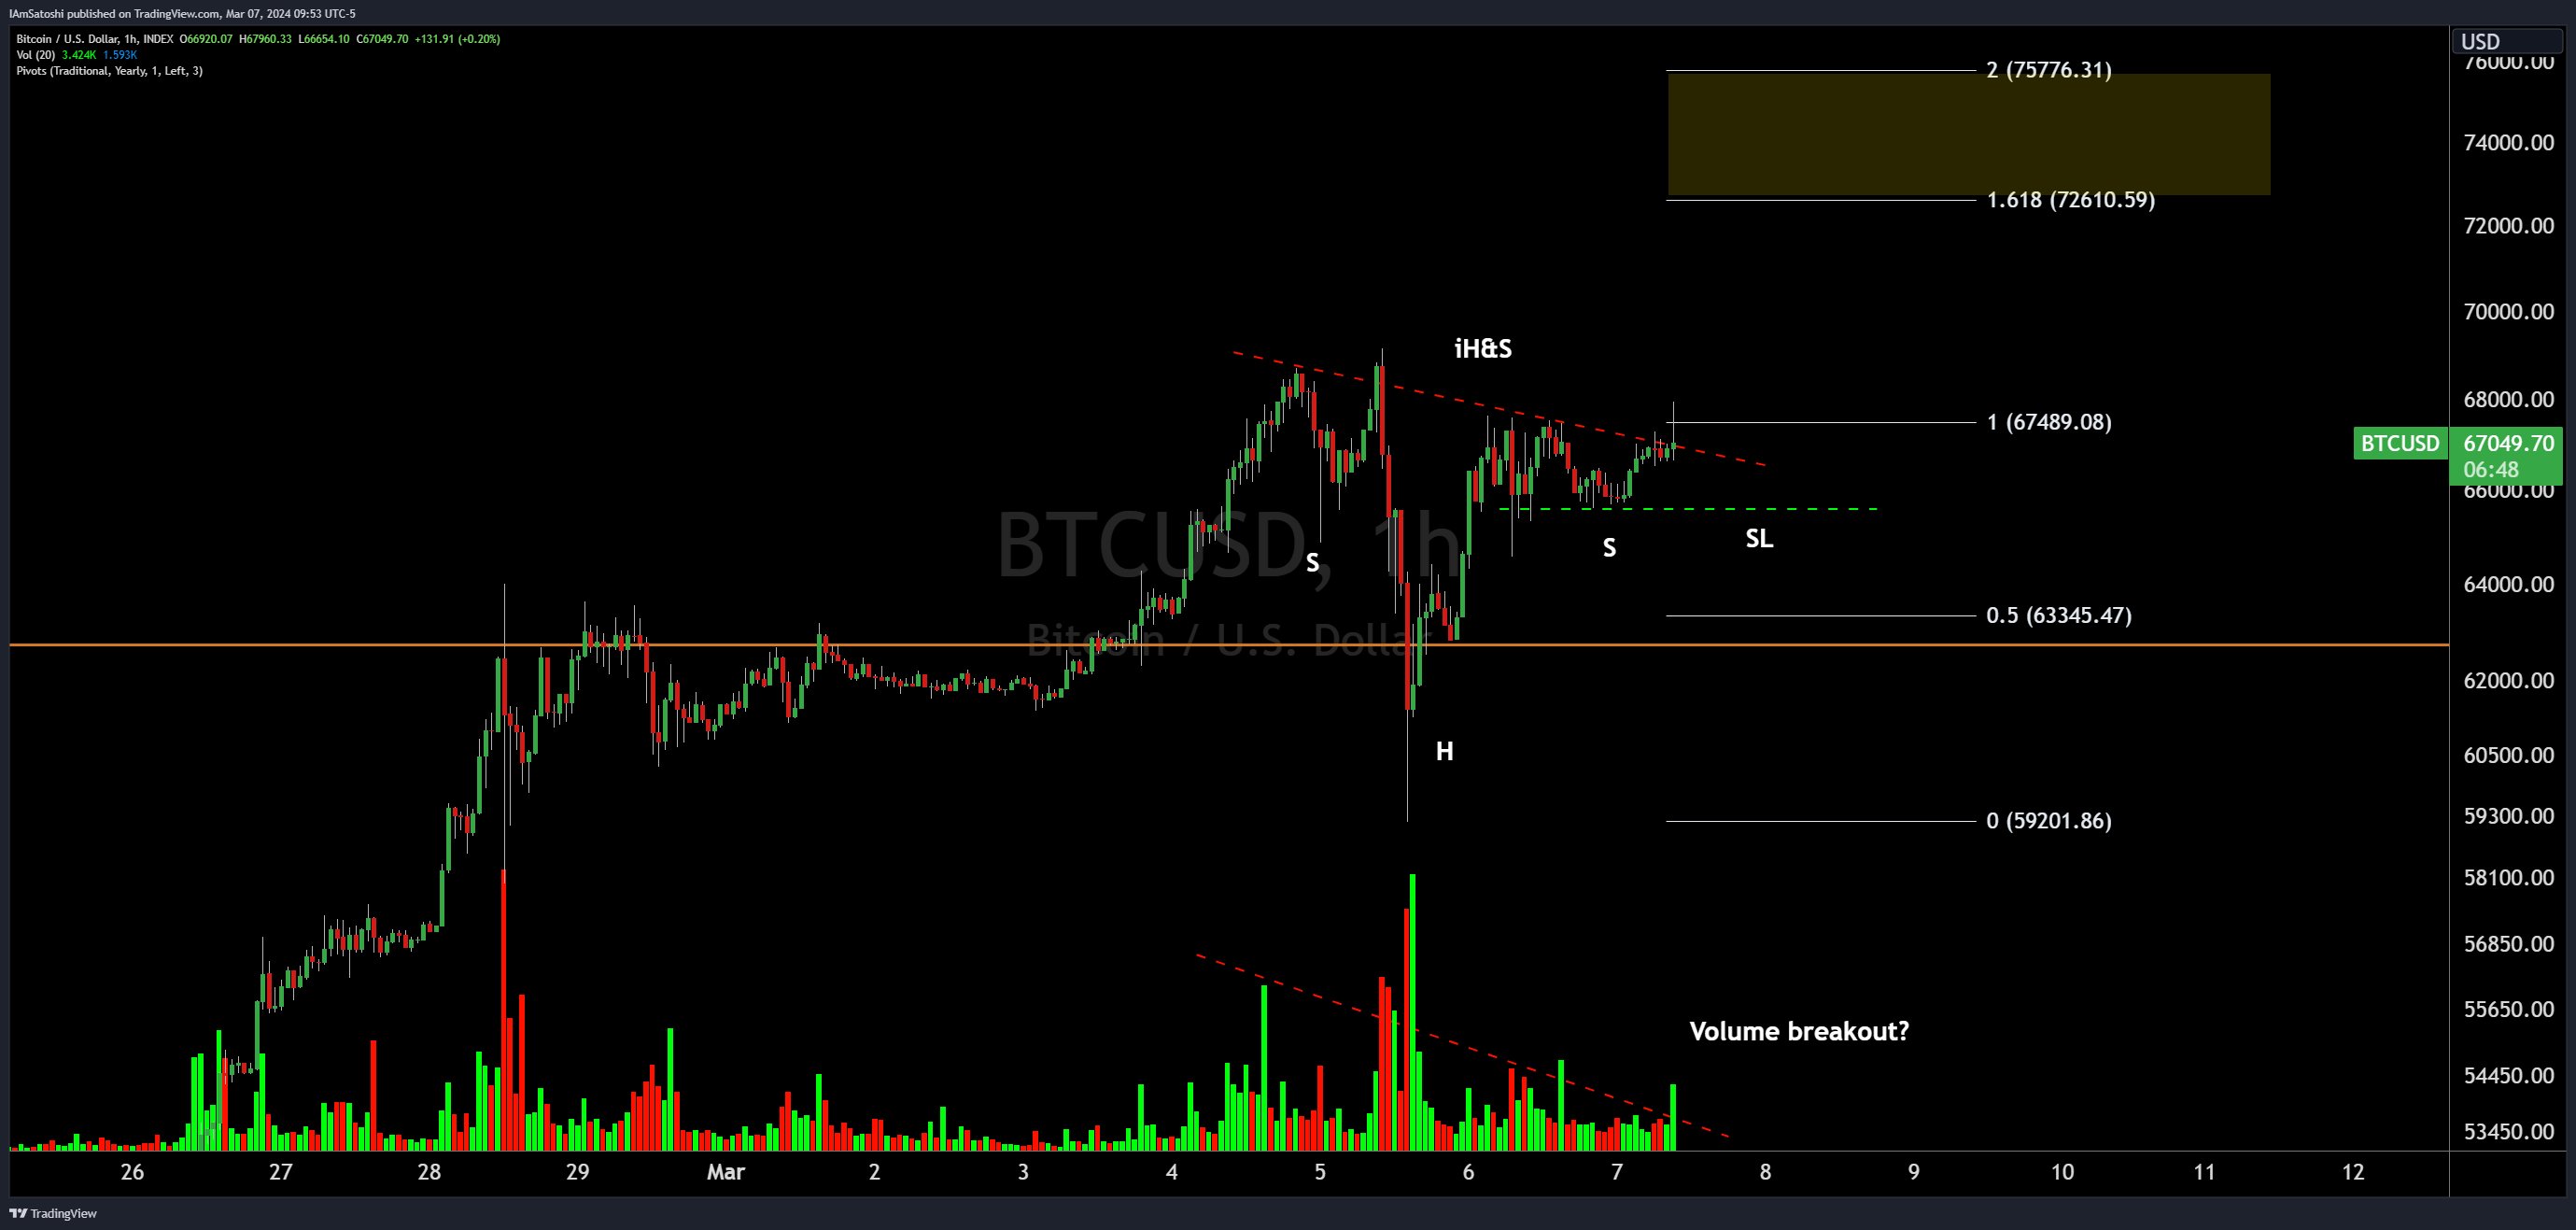 Bitcoin inverse head and shoulders (iH&S) pattern, 1-hour chart | Source: X @CarpeNoctom
An Inverse Head and Shoulders (iH&S) pattern is a bullish reversal pattern in technical analysis, signaling a potential upward reversal in price trends. It consists of three troughs with the middle trough being the lowest, resembling the shape of a head and two shoulders, but flipped upside down.
- Bitcoin ETF Boom: BITX Nears $1 Billion in Assets Amid Crypto Surge
- The Impending Surge of Bitcoin: Insights from Willy Woo and Peter Brandt
- Bitcoin Price Could Double in Short Order, Says Analyst
📉 The Neckline Breakout
In this scenario, Bitcoin’s chart shows the formation with a head at approximately $59,000 and shoulders forming around the $65,000 and $65,700 mark. The pattern suggests that a bullish move is brewing. Traders often use iH&S patterns to identify potential buying opportunities, with entry points typically near the neckline breakout.
The analyst’s chart points to a neckline (dotted red line) slanting downward, intersecting with the right shoulder in the coming days. A breakout above this line is typically required to confirm the pattern. At the current price, Bitcoin is trading just below the neckline.
🎯 Price Targets and Fibonacci Extension
For traders eyeing potential targets, Olszewicz’s analysis projects an ambitious goal of $73,000 to $76,000, aligned with the Fibonacci extension levels of 1.618 ($72,610.59) and 2 ($75,776.31). These levels represent significant price points that Bitcoin might test if the pattern is confirmed with a solid breakout.
One element that could fortify the potential upward journey is a volume breakout, which the analyst has hinted at with a question mark. The volume indicator on the chart shows an increasing trend, but a decisive surge in volume is typically sought after to confirm an iH&S pattern.
Moreover, Olszewicz has marked a potential stop loss (SL) level with a dashed green line. This level around $65,680 serves as a risk management tool for traders should the pattern fail to realize the upward breakout.
💡 Expert Q&A: Addressing Additional Concerns
Q: How reliable is the inverse head and shoulders pattern?
A: Although the pattern is not perfect, it has proven to be a reliable bullish indicator in many cases. However, traders should always consider other factors, such as market sentiment and fundamental analysis, before making any investment decisions.
Q: What could cause the pattern to fail?
A: Patterns can fail due to various reasons, such as lack of market interest, unexpected news events, or a shift in market dynamics. It’s essential to monitor the market closely and adapt your strategy accordingly.
Q: Are there any other patterns or indicators to watch for?
A: Traders use a variety of technical indicators and patterns to analyze price movements. Some popular ones include moving averages, MACD, RSI, and Bollinger Bands. It’s recommended to use a combination of different indicators for a more comprehensive analysis.
🌐 The Future of Bitcoin Price
At press time, BTC traded at $67,124. While the iH&S pattern suggests a potential upward move, it’s important to remember that the cryptocurrency market can be unpredictable. Traders and investors should approach the market with caution and consider the risks involved.
To fully understand the future outlook trends, it’s crucial to analyze a wide range of factors, including market fundamentals, investor sentiment, and regulatory developments. By staying informed and adapting strategies accordingly, investors can increase their chances of making sound investment decisions.
🤝 Join the Discussion and Share on Social Media
What are your thoughts on the potential breakout of the inverse head and shoulders pattern for Bitcoin? Do you believe the price could reach $76,000? Join the discussion and share your insights on our social media platforms!
References: – The $69,000 Bitcoin Question: Expert Forecasts When Price Will Breakout – Bitcoin’s Crucial Lifeline: Analyst Unveils Support That Could Prevent Crash To $60K – Bitcoin needs to address scaling if ETFs are to drive momentum – Bitcoin price rally: Could it breach $50,000 this month?
Featured image created with DALL·E, chart from TradingView.com
Tags: #bitcoin #BitcoinNews #bitcoinprice #bitcoinpriceprediction #btc #btcprice
We will continue to update Blocking; if you have any questions or suggestions, please contact us!
Was this article helpful?
93 out of 132 found this helpful
Related articles
- 🚀 Bitcoin Price Projection: Is $120,000 within Reach? 🌙
- Solana’s DEX Volume Soars, Challenging Ethereum’s Dominance ☀️💥🚀
- Ethereum: Security or Commodity? SEC Chairman Gensler Keeps Market on Edge
- Kiyosaki Predicts Bitcoin to Reach $300K This Year
- Injective Protocol and Ethena Collab: Unleashing the Power of DeFi Beyond Ethereum
- Bitcoin Miner Revenue Hits Second-Best Day in History
- 🚀 Hut 8 Investors Seek Legal Action After Nasdaq Plunge: What You Need to Know