Bitcoin Price Breakout Signals Potential Rally Towards $55,000 🚀
The price of Bitcoin has risen significantly by over 4% in the past 12 hours, breaking away from the recent period of low activity.Bitcoin aims for $55,000 after breaking out of a bullish pennant formation.
🔥 The Bitcoin price has experienced a notable increase of over 4% in the last 12 hours, marking a departure from the recent lull. This movement follows a bull pennant breakout, with the price of Bitcoin now aiming for the $55,000 mark.
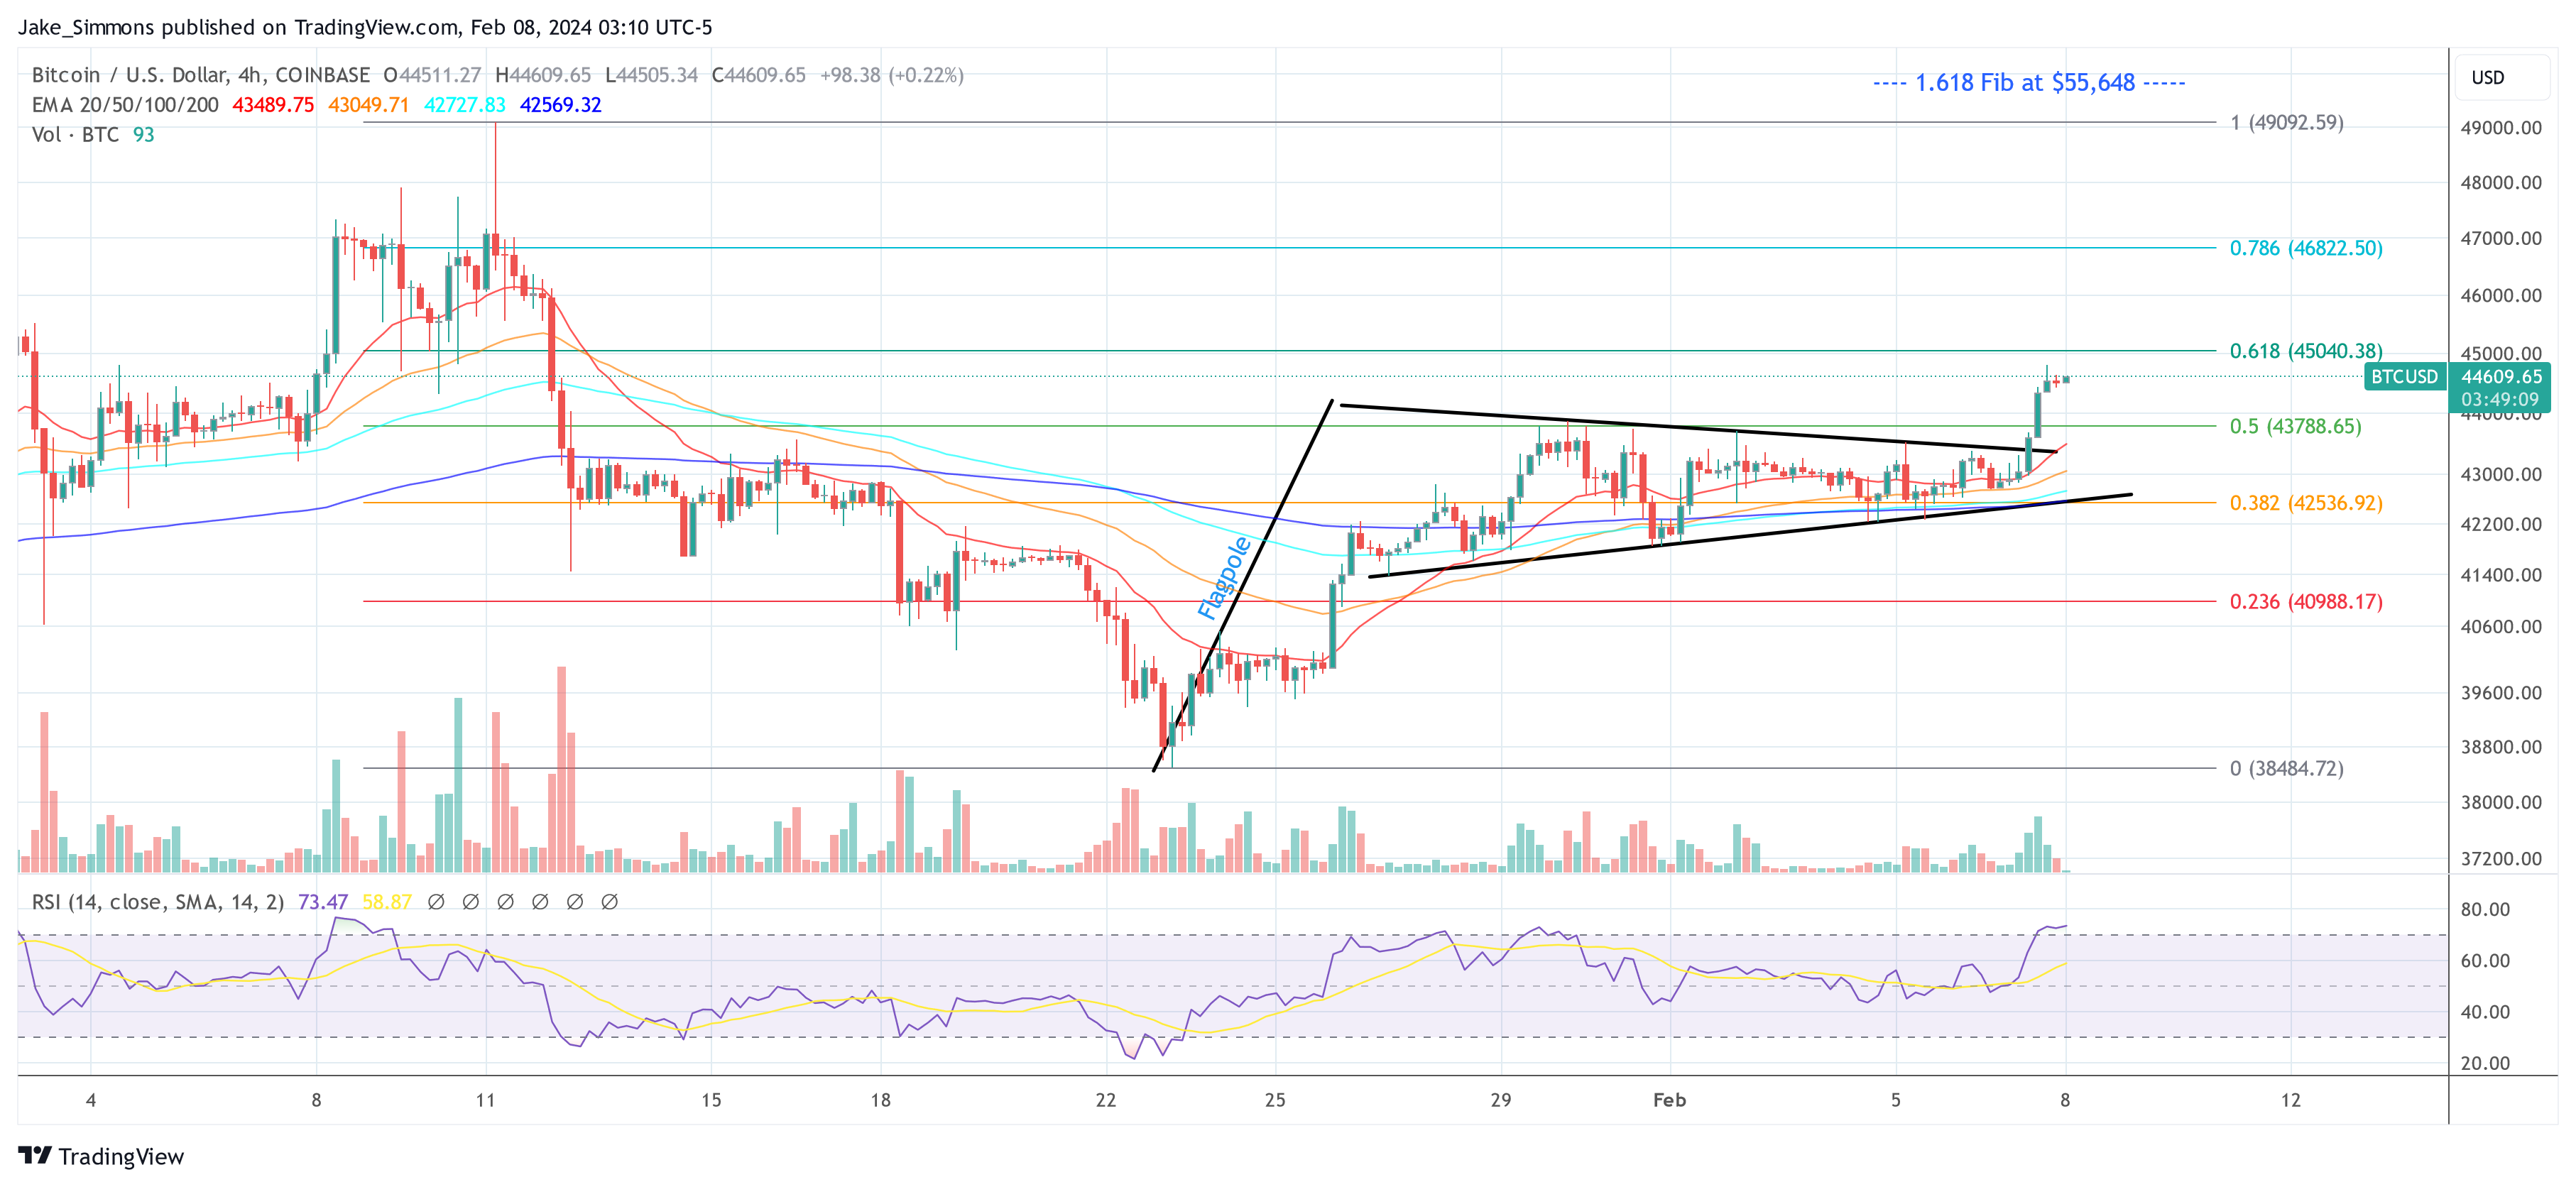 BTC price, 4-hour chart | Source: BTCUSD on TradingView.com
What This Means For Bitcoin Price
The pennant, which is characterized by converging trend lines following a substantial price move, signifies a pause in trading before the market resumes its prior uptrend. The breakout from the pennant suggests a continuation of the bullish trend with a potential target that is often extrapolated from the length of the prior move, known as the flagpole, which initiated the pennant formation.
💡 Key Takeaways: – The Bitcoin price has increased by over 4% in the last 12 hours. – Bitcoin has broken out of a bull pennant pattern, indicating a potential rally. – The Fibonacci retracement levels suggest key resistance at $45,040 and $46,822. – The golden cross pattern and increased volume support the bullish outlook.
- Bitcoin Coinbase Premium Negative Impact on Price Recovery
- Is Bitcoin Preparing For A Big Move?
- Bitcoin Miners Sell Off Reserves, Implications for BTC Price
The Golden Cross Pattern and Increased Volume
Looking at the moving averages, Bitcoin has displayed a golden cross pattern, with the 20-period EMA ascending above the 50-period EMA and the 100-period EMA. This cross underpins the bullish sentiment in the market. 📈
Volume, a key indicator of the strength behind price movements, has also shown an uptick as the breakout occurred, further validating the bullish scenario. The increased volume suggests a higher level of participation and conviction from traders. 💪
Fibonacci Retracement and Price Targets
The Fibonacci retracement tool, applied from the swing high at $49,092 to the swing low at $38,484, shows Bitcoin’s price breaking above the 0.5 ($43,788) retracement level. The next critical levels to watch are the 0.618 ($45,040) and the 0.786 ($46,822) Fibonacci levels, which may serve as resistances in the short term.
Beyond that, the full 1.0 extension ($49,092) is on the horizon, with the 1.618 extension ($55,648) aligning closely with the target of $55,000, reinforcing its significance as a potential price objective. 🎯
RSI Indicates Strong Buying Pressure
The RSI, at 73.47, indicates strong buying pressure but also suggests caution as the market approaches overbought conditions. However, it is important to note that Bitcoin price in its strongest moments tends to reach very high levels, exhibiting massive momentum. Therefore, it is essential for traders to watch for any potential divergence that may signal a weakening of the current momentum.
Potential Support Levels to Watch
While the breakout suggests a bullish trend, traders should remain vigilant of the overbought conditions that could prompt a retest of key support levels. The most crucial support is found at the 0.5 Fibonacci level ($43,788), with further support levels at 0.382 ($42,536) and 0.236 ($40,988). A sustained move below these levels could challenge the bullish thesis and shift focus to the next significant support at $38,484.
Q&A: What Readers Want to Know
Q: What does the golden cross pattern signify in Bitcoin trading?
The golden cross pattern is a technical analysis indicator that occurs when the short-term moving average (in this case, the 20-period EMA) crosses above the long-term moving average (such as the 50-period EMA and the 100-period EMA). This pattern is often seen as a bullish signal, indicating a potential upward price trend.
Q: How does Fibonacci retracement work in determining price levels?
The Fibonacci retracement tool is used to identify potential levels of support and resistance in a price chart. By applying it to a previous price swing, traders can identify key retracement levels based on the Fibonacci sequence. Common retracement levels include 0.382, 0.5, and 0.618. These levels can act as support or resistance, indicating potential turning points in the price movement.
Q: What is divergence in Bitcoin trading?
Divergence refers to a discrepancy between price movements and technical indicators. It occurs when the price of an asset moves in one direction while the indicator moves in the opposite direction. Divergence can be a signal of a potential trend reversal or a weakening of the current trend.
Future Outlook and Investment Recommendations
Considering the bullish development of Bitcoin’s price breakout from the pennant pattern, along with the golden cross pattern and increased volume support, the outlook for Bitcoin remains optimistic. However, it is important to monitor potential overbought conditions and any signs of divergence.
Investors and traders may consider strategies such as setting price targets based on the Fibonacci retracement levels, while also closely watching for key support levels to manage risks. As always, it is crucial to conduct thorough research and seek professional advice before making investment decisions.
Reference List
- Bitcoin Miner Reserves Drop To June 2021 Levels, What This Means For Price
- Ticking Time Bomb: Bitcoin Mega Squeeze Predicted In The Next 10 Days
- Bitcoin Needs to Address Scaling As ETFs Drive Momentum
- Bitcoin Price Rally: Breach of $50,000 within a Month — Matrixport
- Bullish Sentiment Grows as Centralized Exchanges See Record Outflows in 12 Months
Remember, the crypto market is always dynamic, so stay informed and adapt to changing circumstances. 📚🌟
If you found this article insightful, feel free to share it with your friends on social media and start a discussion about the current state of Bitcoin! 💬📢
We will continue to update Blocking; if you have any questions or suggestions, please contact us!
Was this article helpful?
93 out of 132 found this helpful
Related articles
- Microstrategy’s Huge Bitcoin Holdings and Unrealized Profits
- Bakkt Warns of Cash Shortage, May Not Continue as a Going Concern 😱
- Bitcoin Price Surges Above $44,000 as Bullish Momentum Builds
- 📰 Bitcoin Outshines Gold as the New Investment Star
- CleanSpark Doubles Hash Rate with Acquisition of Four New Mining Facilities
- Hut 8 CEO Departs, Shares Slide: What’s Happening in the Bitcoin Mining World?
- Bitcoin Prepares for an Explosive Move: Mega Squeeze Imminent 🚀💥