Why is Cardano’s (ADA) price rising this week?
The recent increase in ADA's value this week can be attributed to overall market uptrends and the impact of the recent Solana network downtime.Cardano (ADA) Price Rises Amid Market Trend
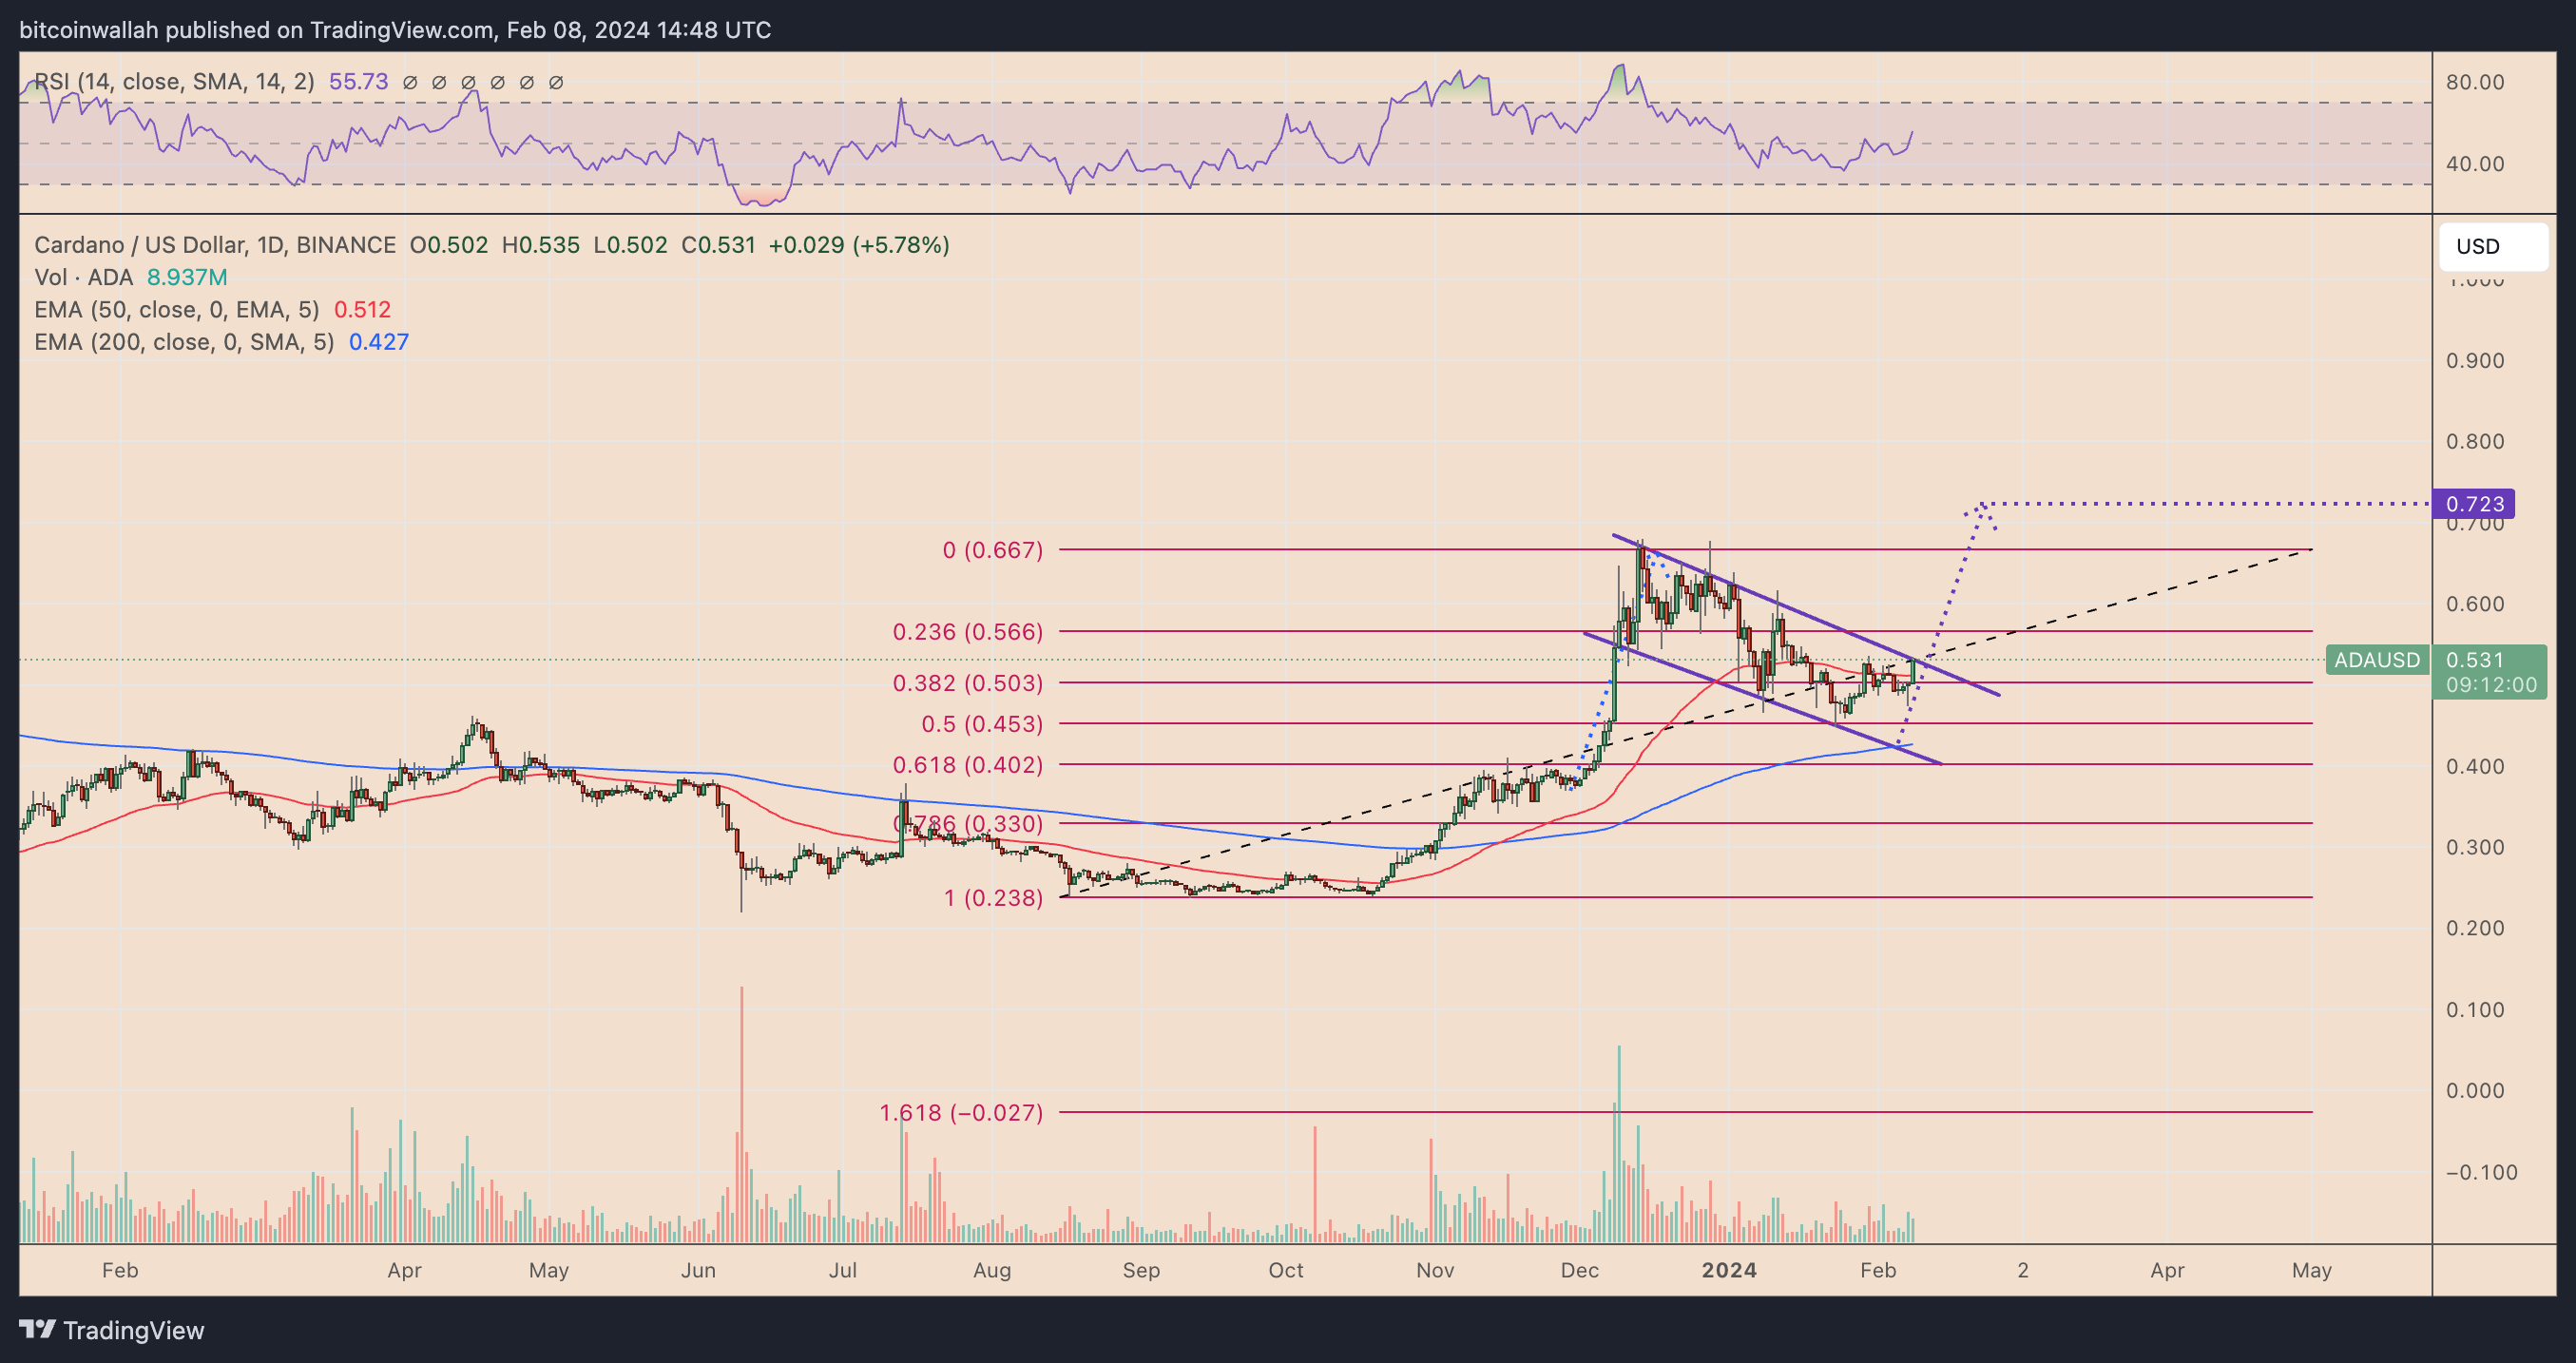
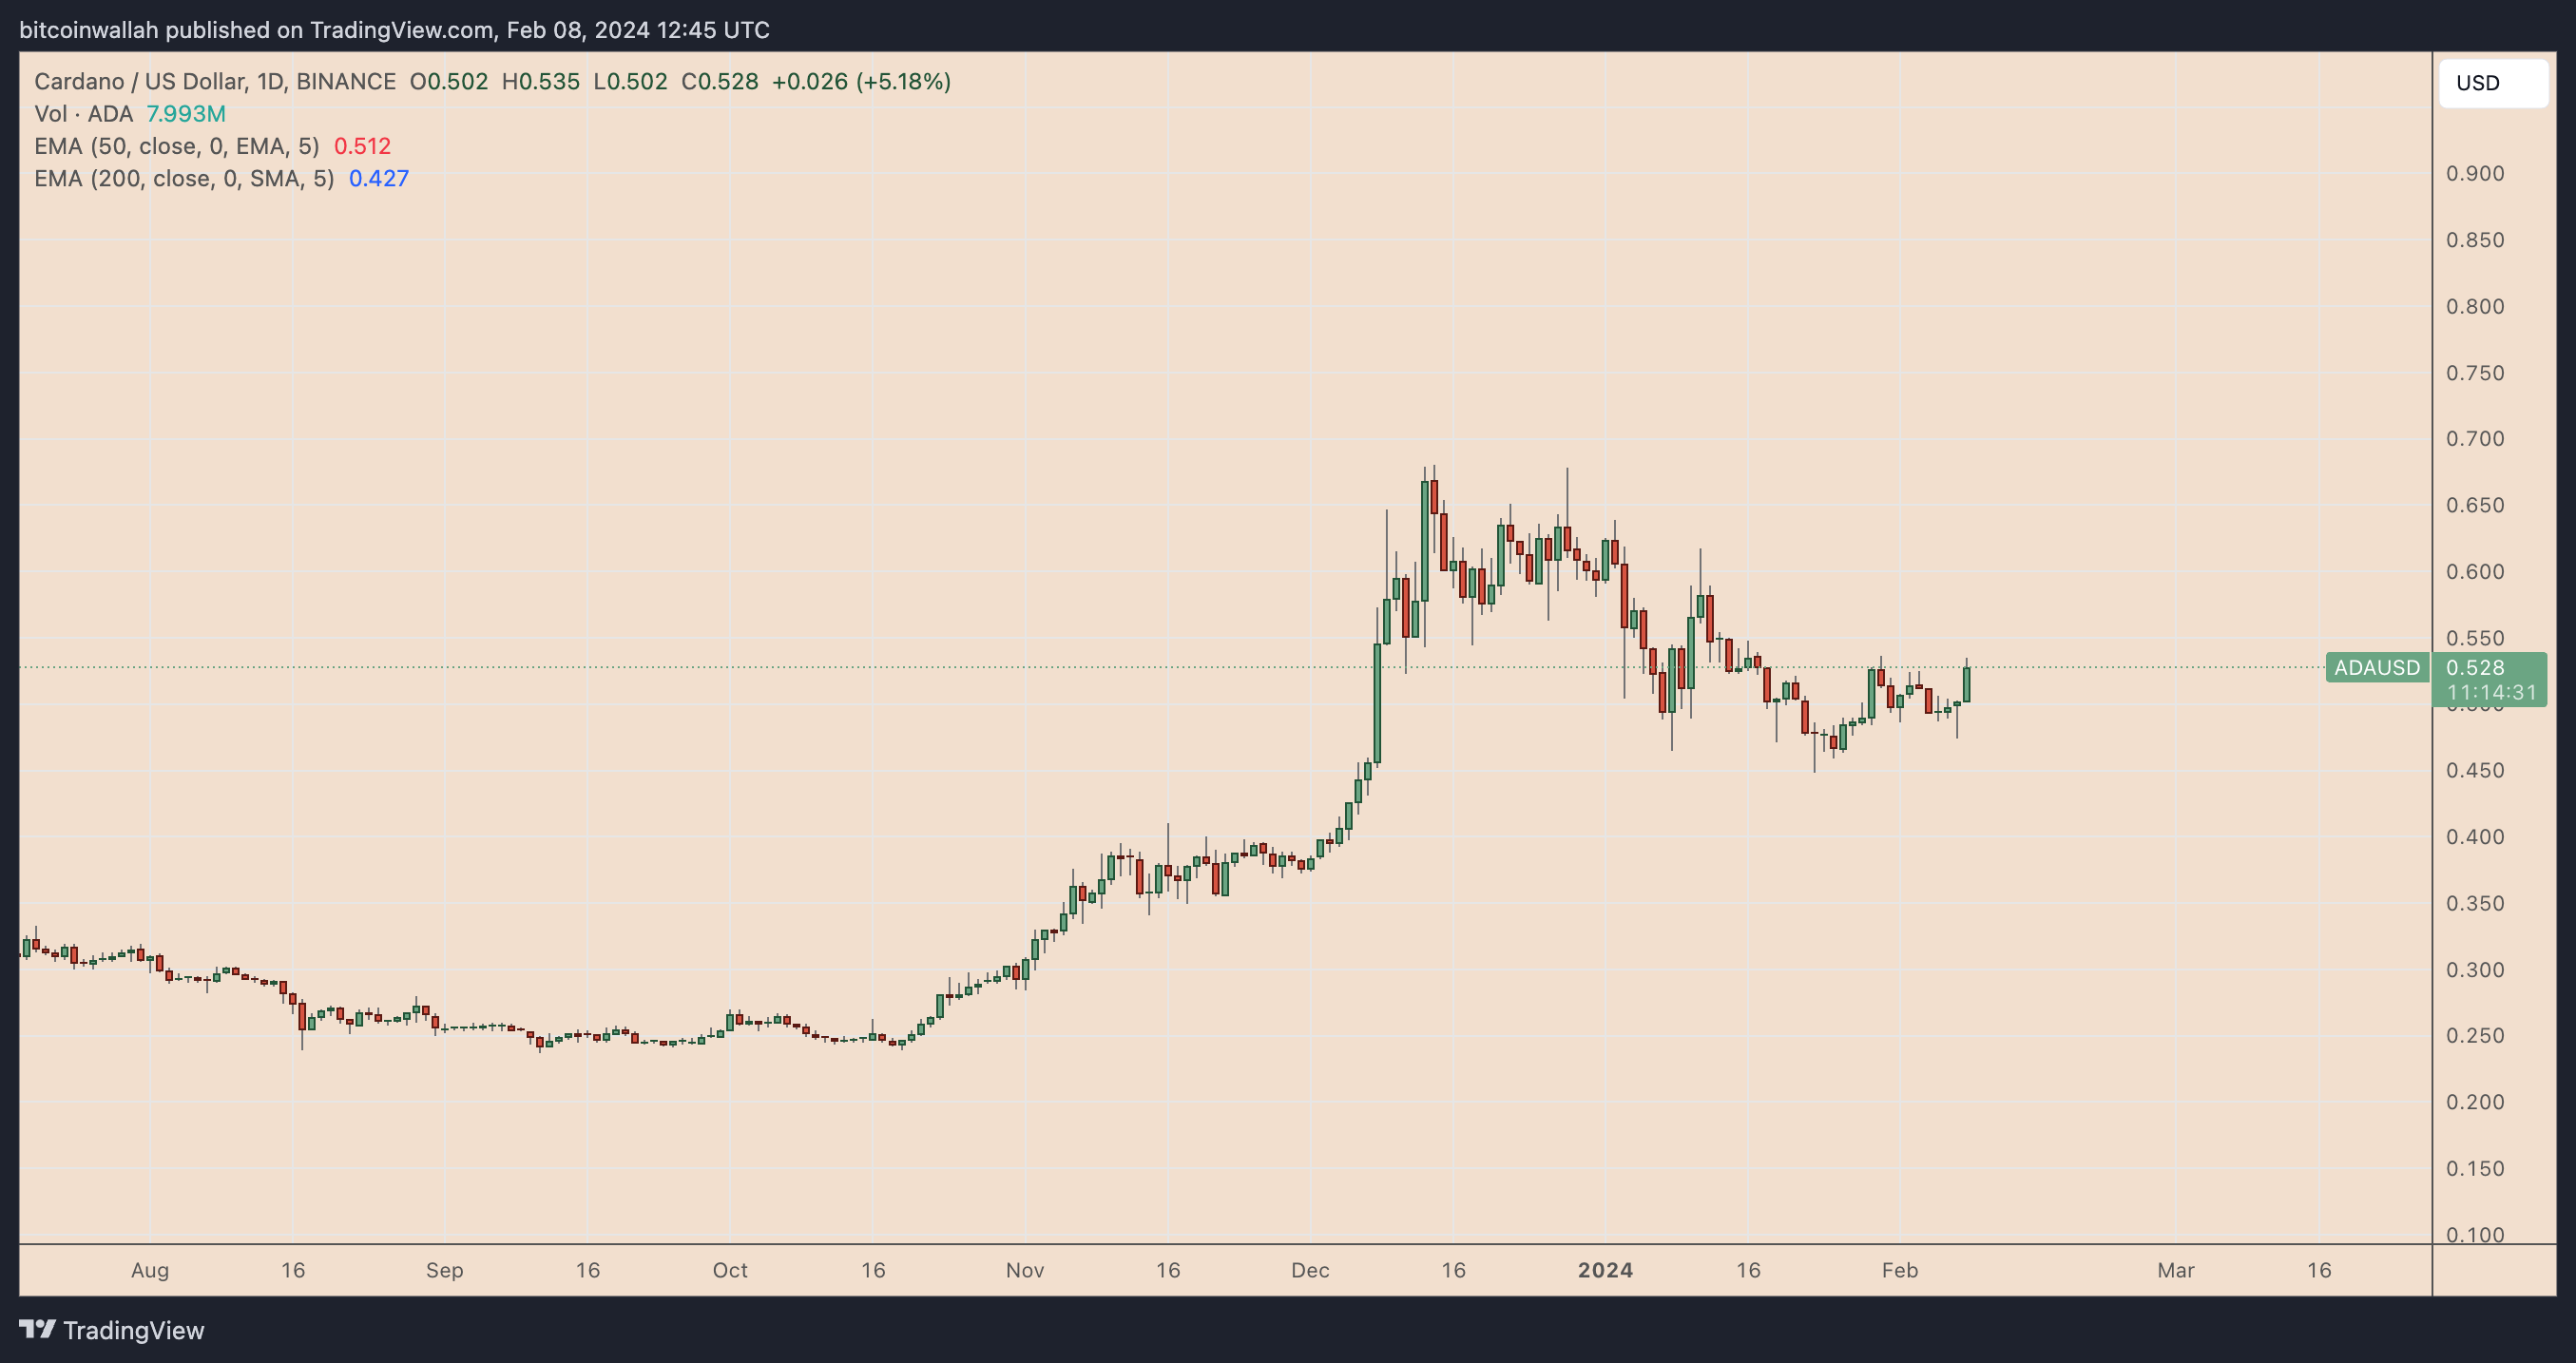 ADA/USD daily price chart. Source: TradingView
Cardano (ADA) has experienced a notable rise this week, increasing over 8.5% to reach $0.535 by February 8th. The majority of this appreciation, approximately 6.5%, occurred within the last 24 hours. The price surge can be attributed to a combination of technical indicators, on-chain data, and foundational developments.
Overall Market Trend Pushes Cardano Up
Cardano’s rise this week reflects positive sentiment in the overall cryptocurrency market. Bitcoin (BTC) and Ether (ETH), the leading cryptocurrencies by market cap, have also seen increases of over 4% and 5.25% respectively, since the start of the week.
The daily correlation coefficient between Cardano and Bitcoin has historically remained mostly positive, and as of this week, it stands above 0.75.
- BlackRock and Fidelity Dominate Bitcoin ETF Holdings 💼
- Bitcoin Rallies as U.S. Government Debt Soars 🚀✅
- Bitcoin Hits $45,500 as Bulls Continue to Dominate
This upward trend indicates a heightened interest in crypto assets, driven by the recent approval of Bitcoin-based spot exchange-traded funds (ETFs) in the United States and the anticipation surrounding Bitcoin’s upcoming halving event in April.
Travis Kling, the chief investment officer at Ikigai, has attributed the crypto market rally to the Federal Reserve’s rate cut policy. He humorously noted on Twitter, “A week ago, the market was pricing six cuts starting in March. Last week, [Jerome] Powell told you to go [in] March. Last night on 60 Minutes, he told you three cuts, not six… result? Stocks up. Crypto up.”
Increased On-Chain Activity
In addition to broader market trends, Cardano’s recent price rally can be attributed to improvements in network activity. The total-value-locked (TVL) across the Cardano ecosystem has seen a growth from 660.30 million ADA to 720.91 million ADA in the last 24 hours. This increase in TVL suggests a growth in adoption as more assets are being locked in Cardano smart contracts.
Furthermore, the recent surge in Cardano’s price aligns with a modest rebound in both daily active addresses and daily transactions count.
Solana Outage Benefits Rival Cardano
Cardano’s price rally this week coincided with the news of Solana’s network outage on February 6th. Cardano and Solana (SOL) are layer-one blockchain rivals.
Since then, ADA’s value has seen a 6.7% increase compared to SOL, indicating a possible shift in investor strategy. Traders seem to be reallocating funds from the Solana ecosystem to Cardano, seeking safety amid the volatility.
 ADA/SOL daily price chart. Source: TradingView
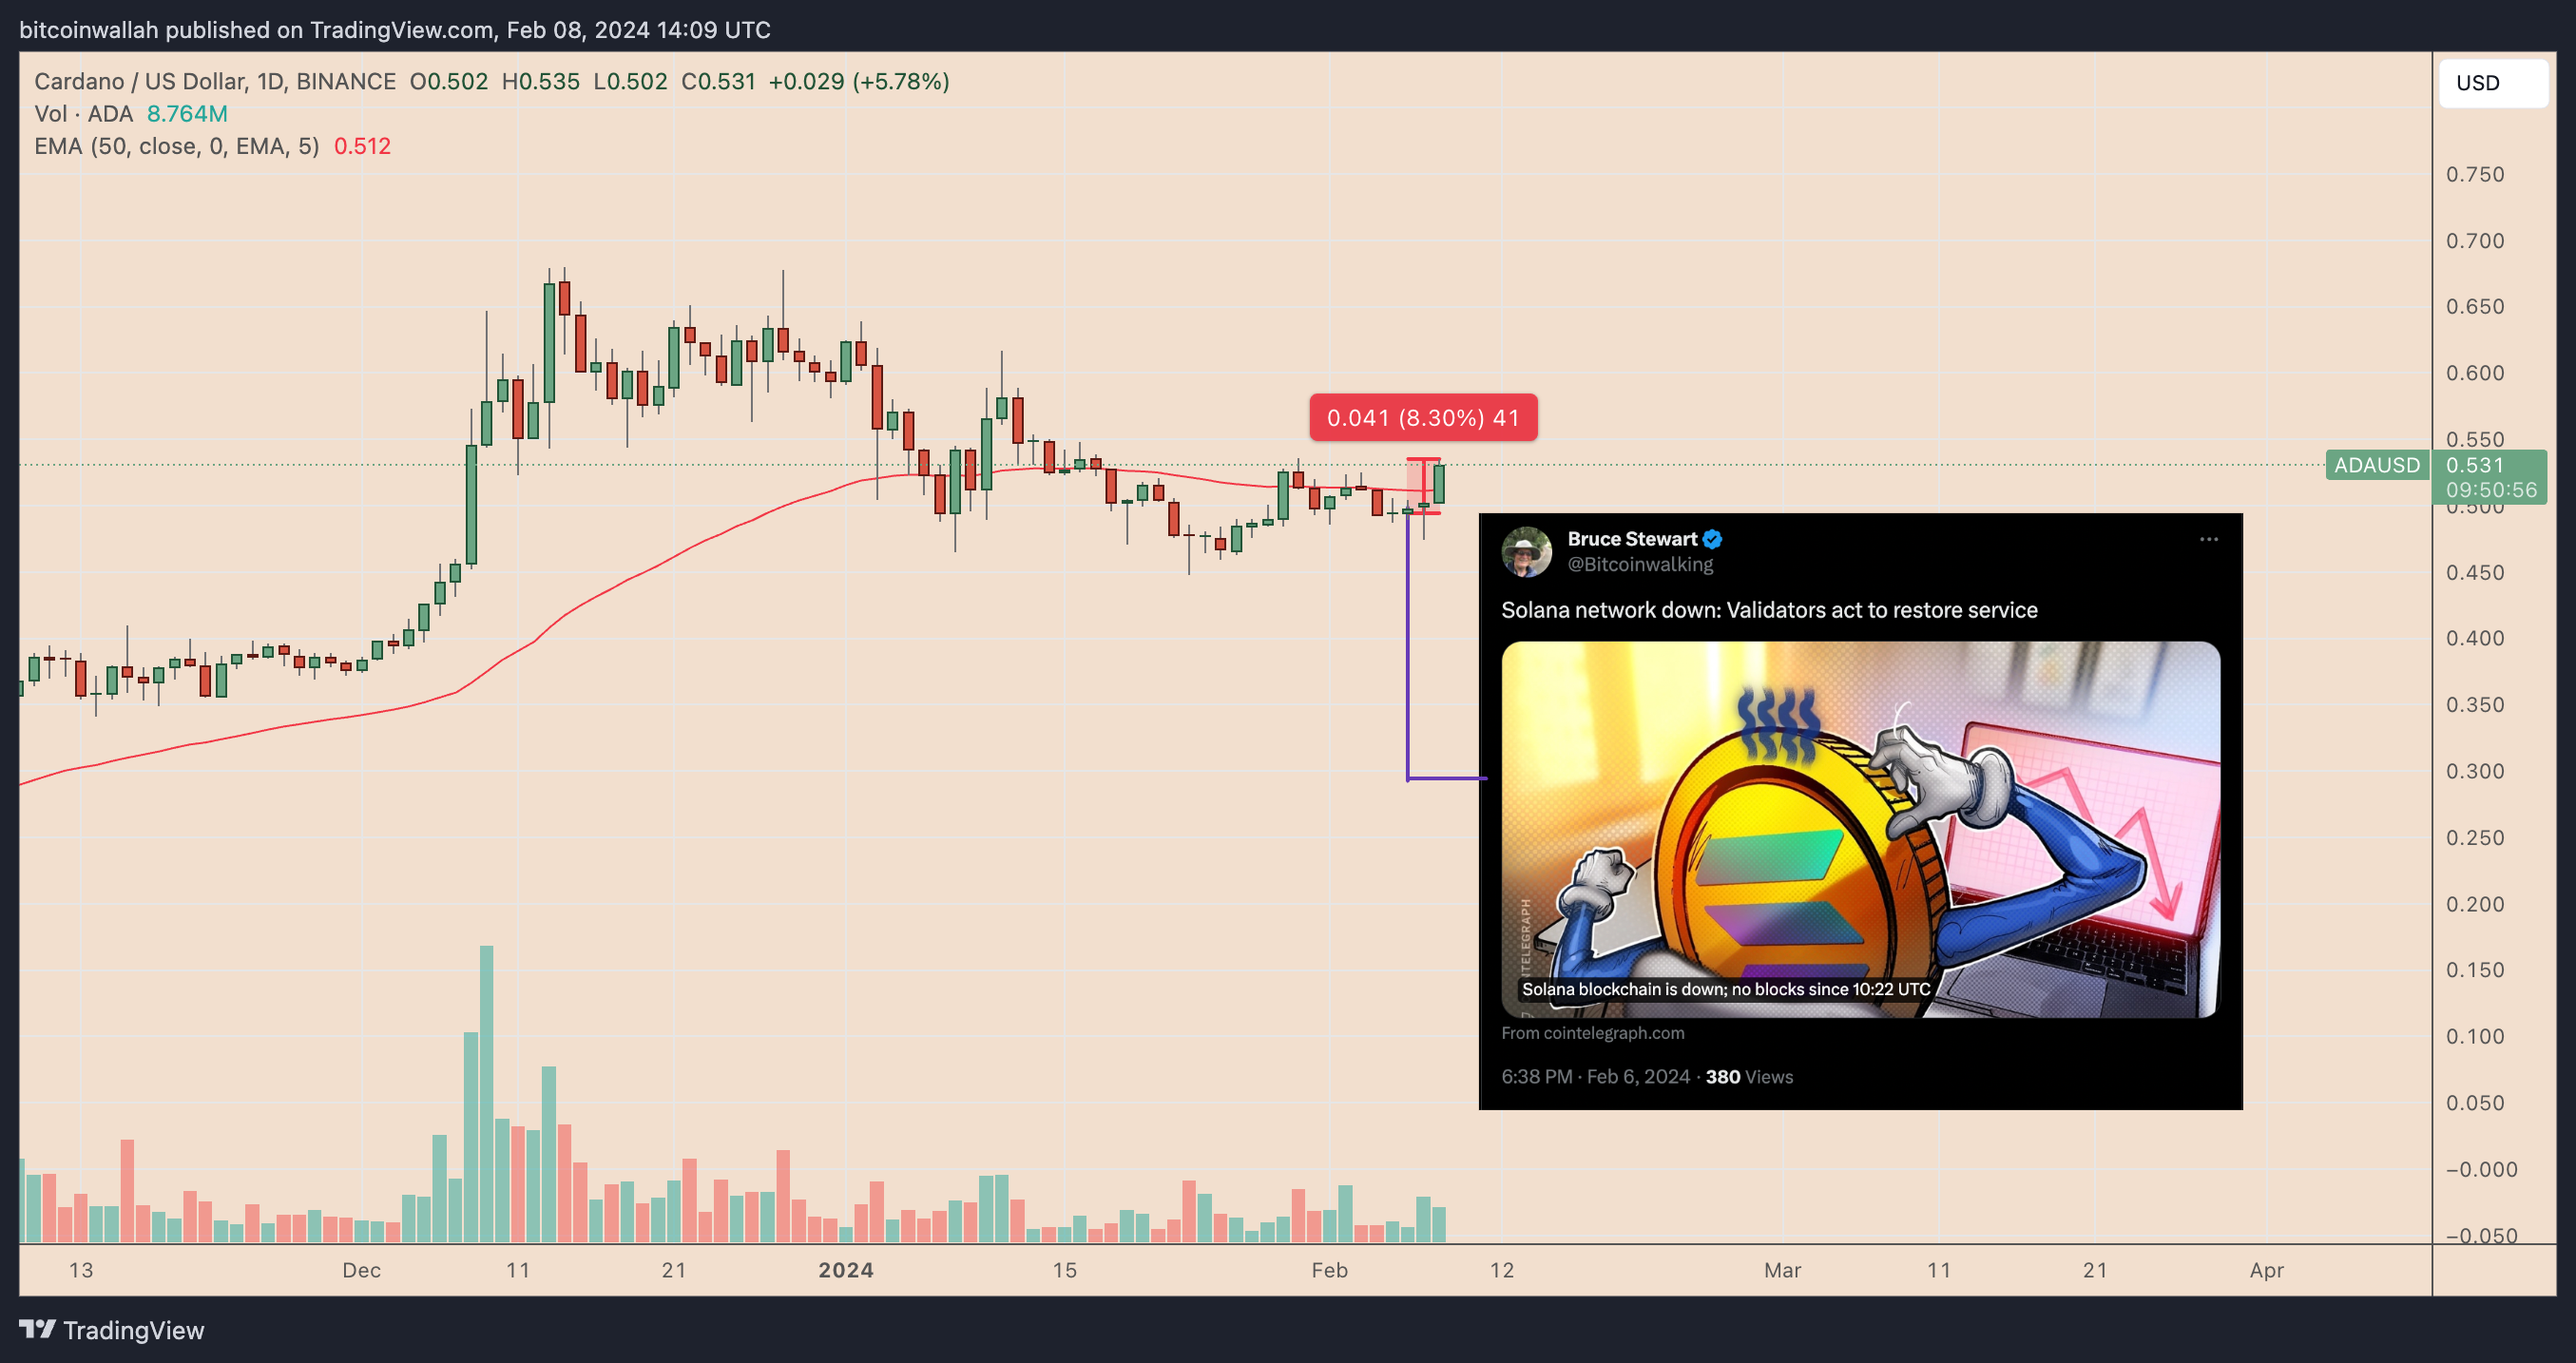
Cardano Price Technical Setup
Cardano’s upward trajectory began at a critical support level, identified by the confluence of a horizontal trendline at $0.494 and the lower trendline of ADA’s existing bear flag formation.
As of February 8th, ADA’s price has its sights set on an upward continuation towards the upper trendline of the bear flag near $0.55. However, since bear flags are bearish continuation patterns, there is a high likelihood of a breakdown, with a price target around $0.421.
Should such a breakdown occur, ADA’s targeted price level by the end of February could potentially adjust to around $0.421, a decrease of approximately 20% from the current price levels.
 ADA/USD daily price chart. Source: TradingView
ADA’s Bull Flag Setup
The bear flag downside target aligns with the lower trendline of ADA’s broader descending channel pattern, which resembles a bull flag. This indicates the potential for ADA’s price to rise towards $0.72 by March or April.
 ADA/USD daily price chart. Source: TradingView
Q&A
Q: What are the main factors driving Cardano’s recent price rise?
A: Cardano’s price rise can be attributed to a combination of factors, including the overall positive sentiment in the crypto market, the correlation with Bitcoin’s price movements, improvements in network activity, and a potential shift in investor strategy following Solana’s network outage.
Q: What is the significance of Cardano’s increased on-chain activity?
A: The increase in Cardano’s total-value-locked (TVL) suggests growing adoption as more assets are being locked in Cardano smart contracts. Additionally, the rebound in daily active addresses and transactions count indicates increased usage and engagement within the Cardano ecosystem.
Q: What technical pattern is Cardano currently exhibiting?
A: Cardano is currently displaying a bear flag pattern, which is a bearish continuation pattern. This indicates a potential breakdown in price with a target around $0.421. However, there is also a broader descending channel pattern, resembling a bull flag, that suggests a potential rise towards $0.72 by March or April.
Q: How does Cardano’s price performance compare to other cryptocurrencies like Bitcoin and Ether?
A: Cardano’s price rise reflects the overall positive sentiment in the crypto market, with Bitcoin and Ether also experiencing increases in price. The correlation coefficient between Cardano and Bitcoin has historically remained positive, indicating a similar trend in price movements.
Future Outlook and Investment Recommendations
Looking ahead, the future outlook for Cardano remains optimistic. The increased network activity and growing adoption suggest a strong foundation for further growth. However, investors should closely monitor the technical patterns, such as the bear flag and descending channel, to make informed investment decisions.
It is important to conduct thorough research and consult with a financial advisor to understand the risks associated with cryptocurrency investments and make investment decisions that align with individual financial goals.
References
- Approval of Bitcoin-based spot exchange-traded funds (ETFs)
- Bitcoin’s upcoming halving event in April
- Travis Kling’s tweet about the Federal Reserve’s rate cut policy
- Solana’s network outage
- Bear flag pattern
- Bitcoin leveraged traders in control
Remember to share this article on social media and engage in the comments below. Let’s continue the discussion!
We will continue to update Blocking; if you have any questions or suggestions, please contact us!
Was this article helpful?
93 out of 132 found this helpful
Related articles
- Bitcoin Shows Signs of Upside Momentum as Open Interest Rises 💥💰
- Spot Bitcoin ETFs Hold More Bitcoin than MicroStrategy, Exclusions Apply 🚀
- US lawmakers are near to completing an agreement on stablecoins, according to Maxine Waters.
- Bitcoin Miners in the Face of Changing Conditions: Challenges and Opportunities
- Banks on the Brink: Robert Kiyosaki Warns Investors to Prepare
- PIXEL: The Game-Changing Web3 Game on Binance Launchpool 🚀
- How Blockchain Technology Could Have Saved Americans Billions in Credit Card Fees