On-chain data February scan: Coin price roller coaster, boosting on-chain data, is there a relationship between the two?
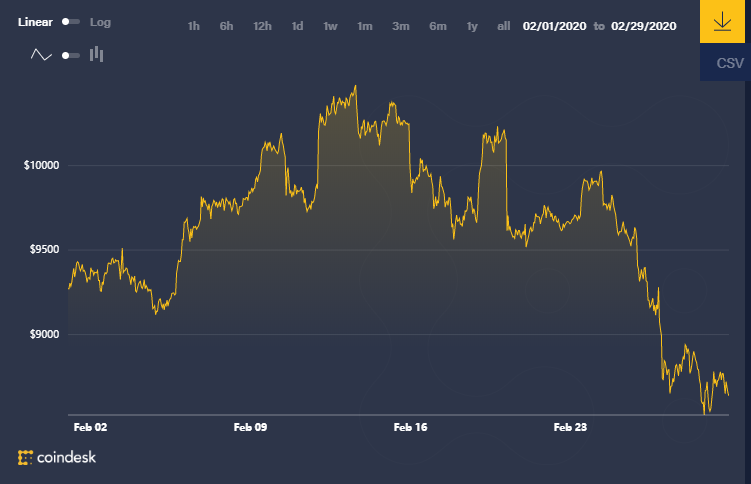
According to CoinDesk data, in February 2020, the price of Bitcoin continued to rise in January, but began to adjust in the middle of the month and fell rapidly at the end of the month. With this ups and downs, what is the trend of Bitcoin's on-chain transactions throughout February, let's review and analyze the February data on the chain.
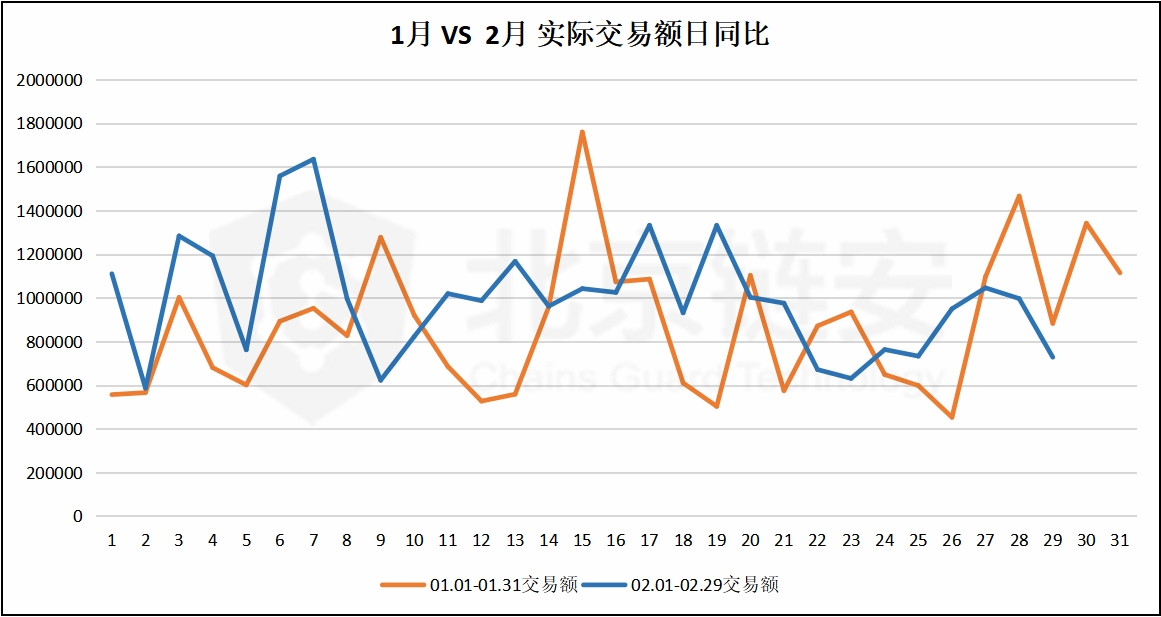
In February 2020, the transaction value on the Bitcoin chain was 28849656.86 BTC. Although there were only 29 days in this month, it was 6.44% higher than the 27104098.46 BTC in January 2020, ending two consecutive transactions on the Bitcoin chain. Monthly downward trend.
- Insert pins up and down at night, dish washing continues
- Ethereum mining shuffle: nearly 40% of the entire network computing power in April or will evaporate
- South Korea's Special Financial Law and Market Analysis: Cryptocurrency finally welcomes its name after 4 years of regulatory "passiveness"
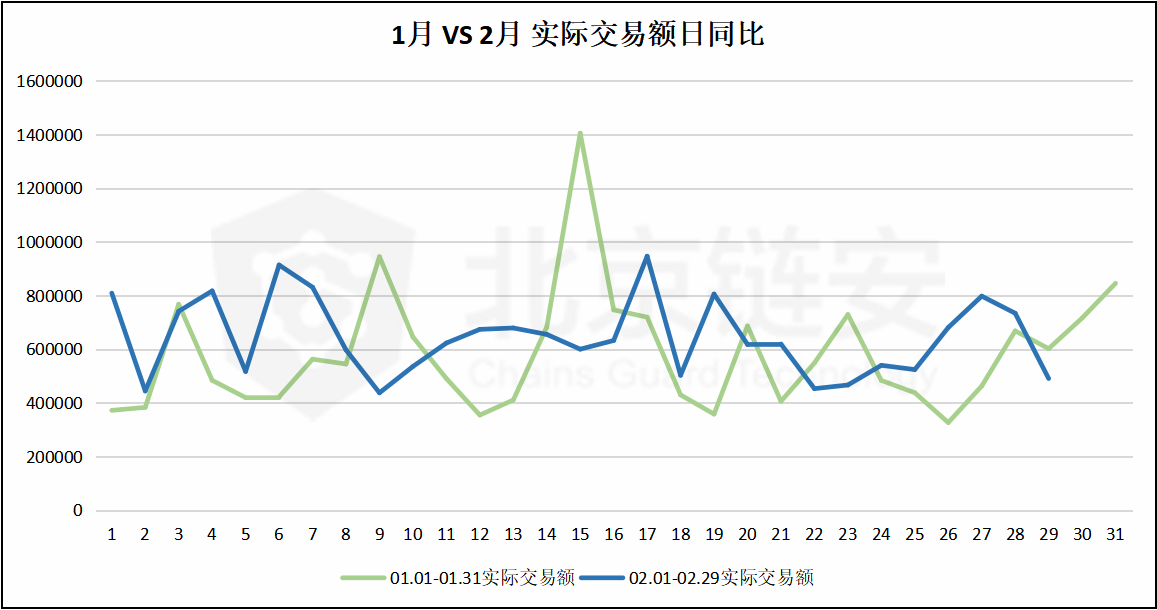
In February 2020, the actual transaction amount on the Bitcoin chain was 18677488.12 BTC, which was an increase of 3.49% compared to 18047330.32 BTC in January 2020. The actual transaction amount we defined is to exclude transactions such as "changes" that are not The actual bitcoin transferred out is relatively more accurate. Compared with January, the main transactions are concentrated in the first half of the month, and especially in the middle of the month, the distribution of on-chain transactions in February is relatively more balanced.
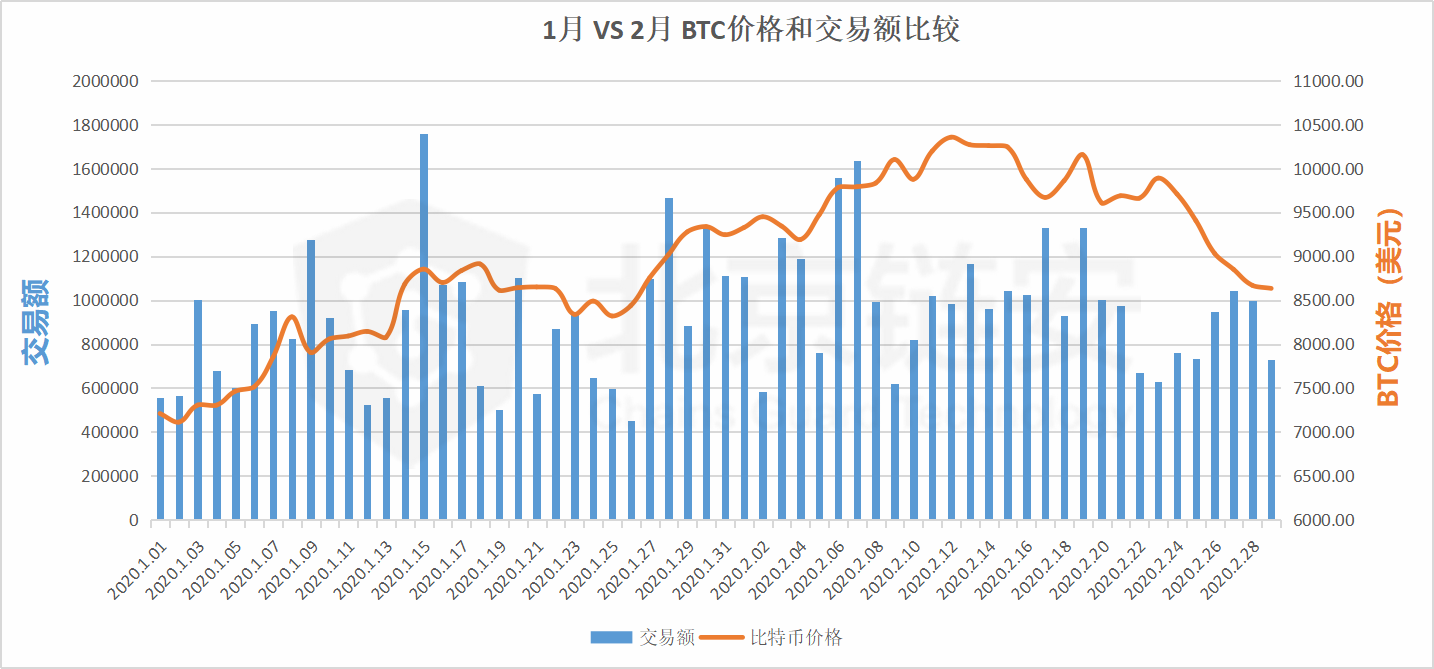
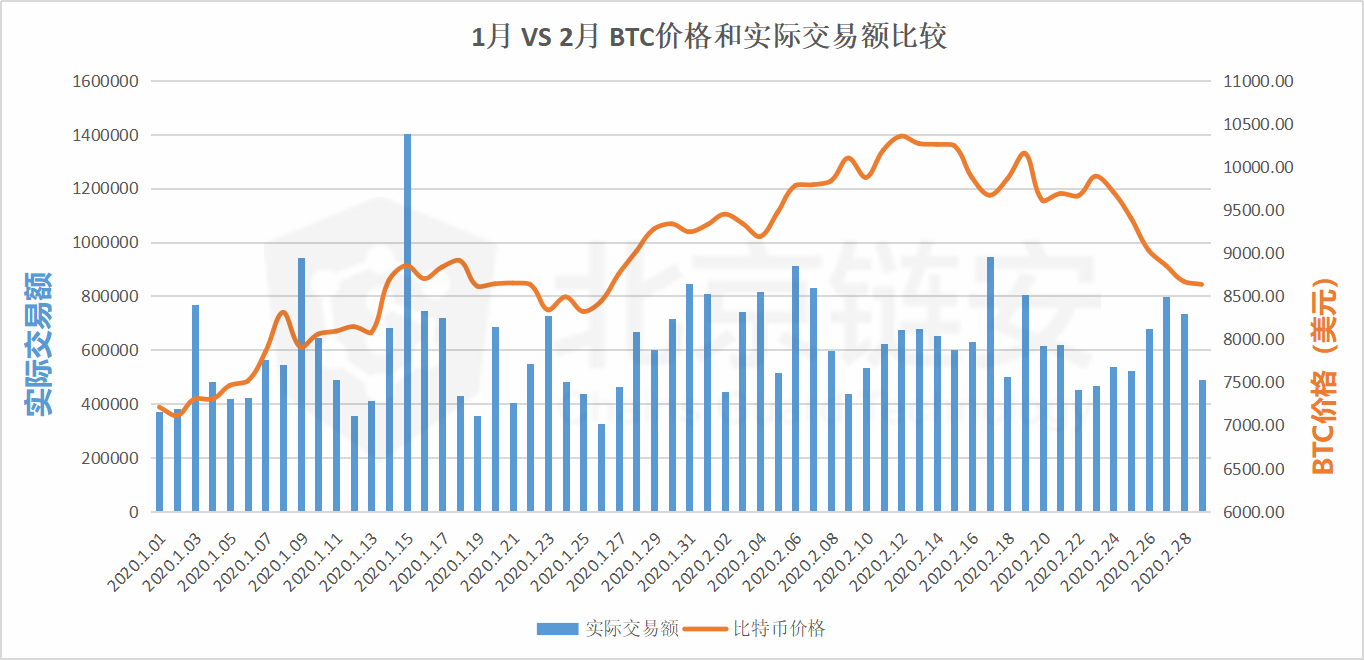
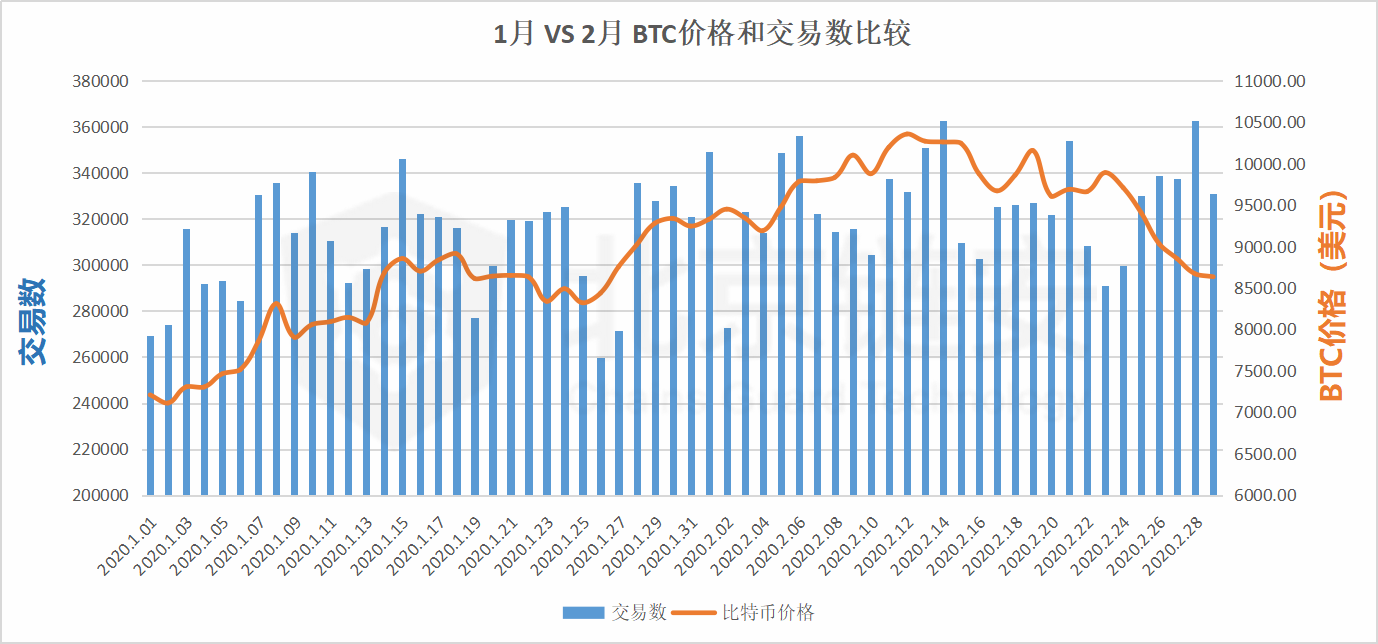
From the comparison of the bitcoin price and transaction volume in the past two months, during the price rise in the first half of February 2020, the overall transaction volume on the chain was still relatively high, but during the price shock period, the on-chain transaction was significantly reduced, and then appeared The price fell sharply.
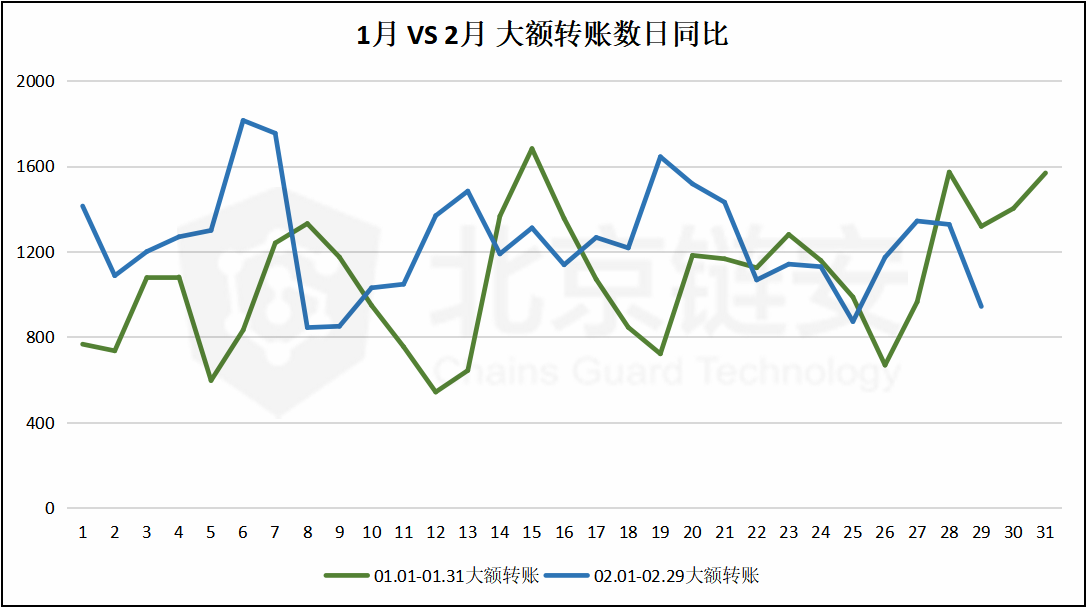
Compared with the on-chain data transaction volume that may be affected by some special transactions, the large number of transfers above 100BTC often reflects the activity of on-chain transactions. In February 2020, the number of large-scale transactions on the chain was 36,166, which is 33148 in January 2019
This time it rose by 9.10%. Similarly, the number of large transfers in February was relatively small compared to January.
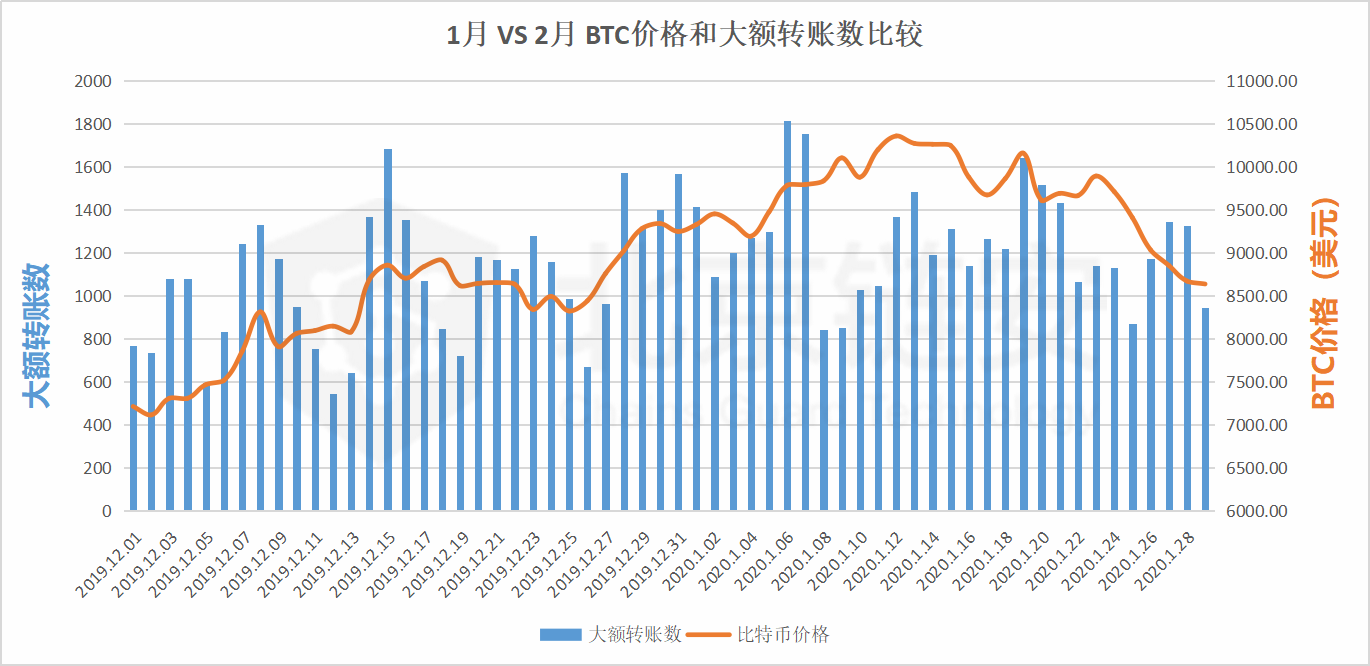
From the comparison with the price of bitcoin in the same period, the number of large transfers during the price rise period is obviously high, and even upwards, and during the price crisis, the number of large transfers began to decline, especially before the price of bitcoin plunged. The trend, which seems to have appeared many times in the previous interaction of large transfers and the price of Bitcoin.
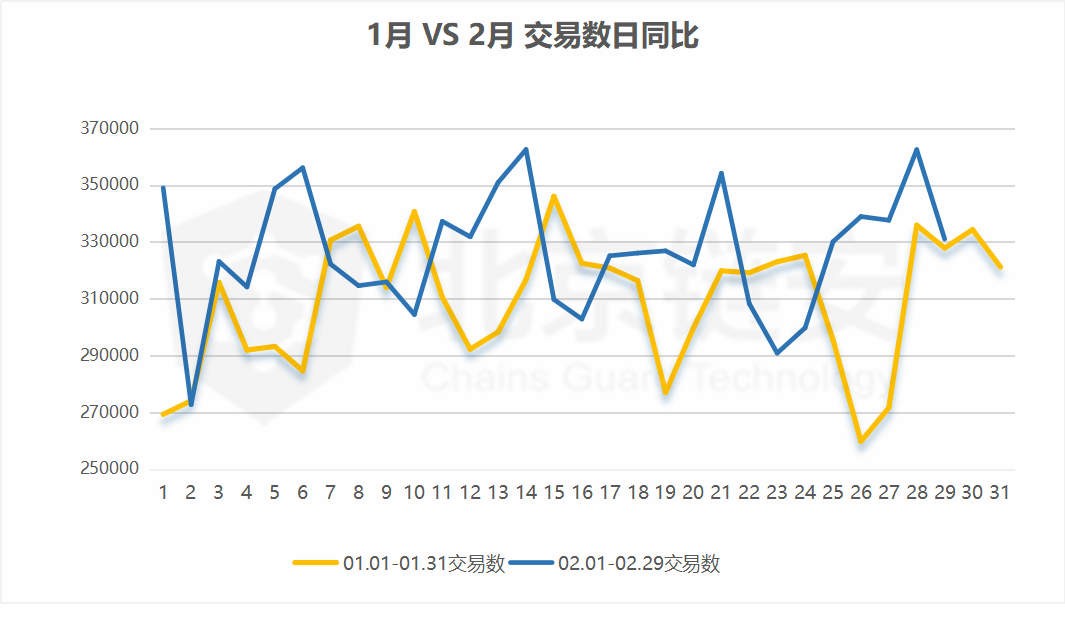
In February 2020, the total number of transactions on the Bitcoin chain was 9,468,704, which was slightly 1.19% lower than the 9,582,599 in January. Given that the number of days in February was two days less than January, this was also expected.
From the comparison of the number of transactions on the chain and the price of bitcoin in the past two months, when the price has changed significantly, the number of transactions on the chain will also increase significantly, reflecting the more active on-chain transfer of market participants during the same period.
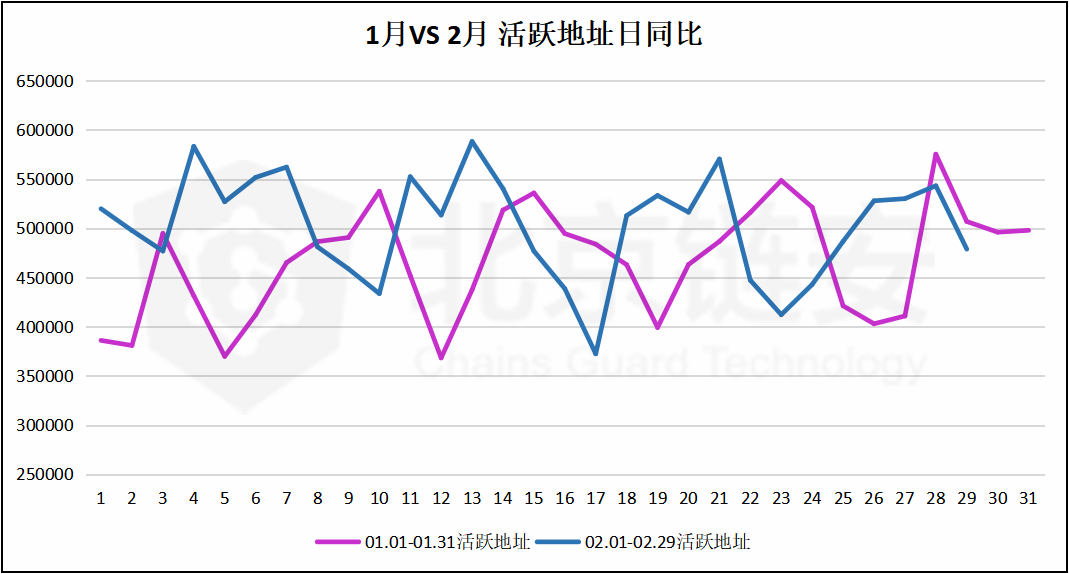
Look at the number of active addresses, that is, the number of addresses that initiate transfers actively. The number of active addresses in February 2020 is
14,576,714, a slight increase of 0.85% from 14,454,357 in January 2020.
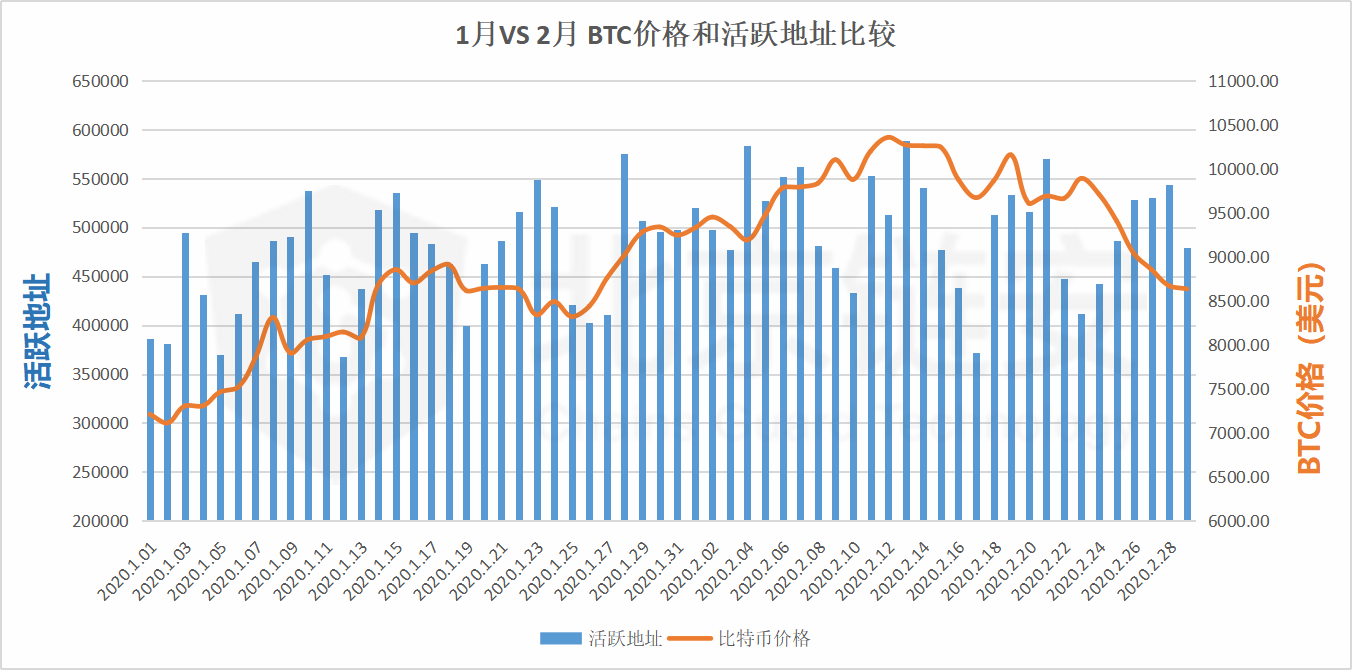
From the comparison of the number of active addresses and the price of bitcoin in the past two months, we can see that the price has been adjusted downward several times in February, including the number of active addresses before the final plunge.
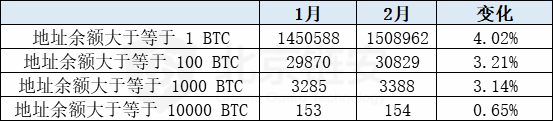
Finally, in this monthly report, we add a new data comparison, that is, the address distribution of different balance amount ranges at the end of each month. As of the end of February, the number of addresses on the Bitcoin chain totaled 618,747,147, of which the number of addresses in different balance ranges was distributed. as follows
1,508,962 address balances greater than or equal to 1 BTC
30,829 address balances greater than or equal to 100 BTC
3,388 addresses with a balance of 1000 BTC or more
There are 154 address balances greater than or equal to 10,000 BTC
Next, please continue to pay attention to the second part of "February Scan of ChainsMap Chain Data" to see the details of the inflow and outflow of Bitcoin from Binance and Huobi from the perspective of data on the Bitcoin chain.
We will continue to update Blocking; if you have any questions or suggestions, please contact us!
Was this article helpful?
93 out of 132 found this helpful
Related articles
- DeFi Ventures Framework announces $ 900,000 investment in Commonwealth Labs and FutureSwap to complement DeFi's missing link
- Bitcoin's Secret History: The Price of Bitcoin Has Changed
- Why India's lifting of crypto ban is the biggest positive factor in 2020
- Where will the safe-haven funds go after Black Monday?
- Telegram says recent ruling "fundamentally" overturns SEC ban
- Dialogue | Where is the Blockchain in the New Infrastructure?
- Japanese financial regulator launches global blockchain governance initiative network


