Ethereum’s bullish momentum persists as it approaches the $3K mark.
The value of Ethereum is increasing with optimistic strength above the support level of $2,700. ETH is still backed and aims for further growth towards the resistance of $3,000.Ethereum Price Analysis: Bullish Momentum Gains Above $2,700 Support
Ethereum’s price is showing bullish momentum as it continues to gain strength above the $2,700 support level. The second-largest cryptocurrency remains well-supported and eyes further upsides toward the $3,000 resistance.
Consolidation Above Key Support Zone
Ethereum is currently consolidating gains above the $2,770 support zone. The price is also trading above $2,780 and the 100-hourly Simple Moving Average, indicating a positive trend. Additionally, there is a key bullish trend line forming with support at $2,700 on the hourly chart of ETH/USD (data feed via Kraken).
Ethereum Mimics Bitcoin’s Positive Trend
Similar to Bitcoin, Ethereum price has held strong above the $2,650 level. It surpassed the $2,700 barrier and entered a positive zone. The bulls successfully pushed the price above the $2,750 and $2,800 levels, resulting in a new multi-week high near $2,826. Currently, Ethereum is consolidating these gains.
Immediate Resistance and Potential Upside
The price of Ethereum is currently trading above the 23.6% Fibonacci retracement level of the recent rally from the $2,589 swing low to the $2,826 high. It is also trading above $2,780 and the 100-hourly Simple Moving Average, which indicates a favorable outlook. The immediate resistance is near the $2,825 level, followed by the major resistance at around $2,850. If Ethereum manages to surpass these levels, it could rise further and test the $2,950 resistance. Should it succeed in breaking above this resistance, Ether might even spike above the $3,000 mark and approach $3,045.
- XRP Advocate John Deaton Considers Senate Bid Against Elizabeth Warren
- Welcome to ENON: Redefining the Crypto Trading Experience 🚀
- China Plans to Revise AML Law to Tackle Virtual Asset Risks
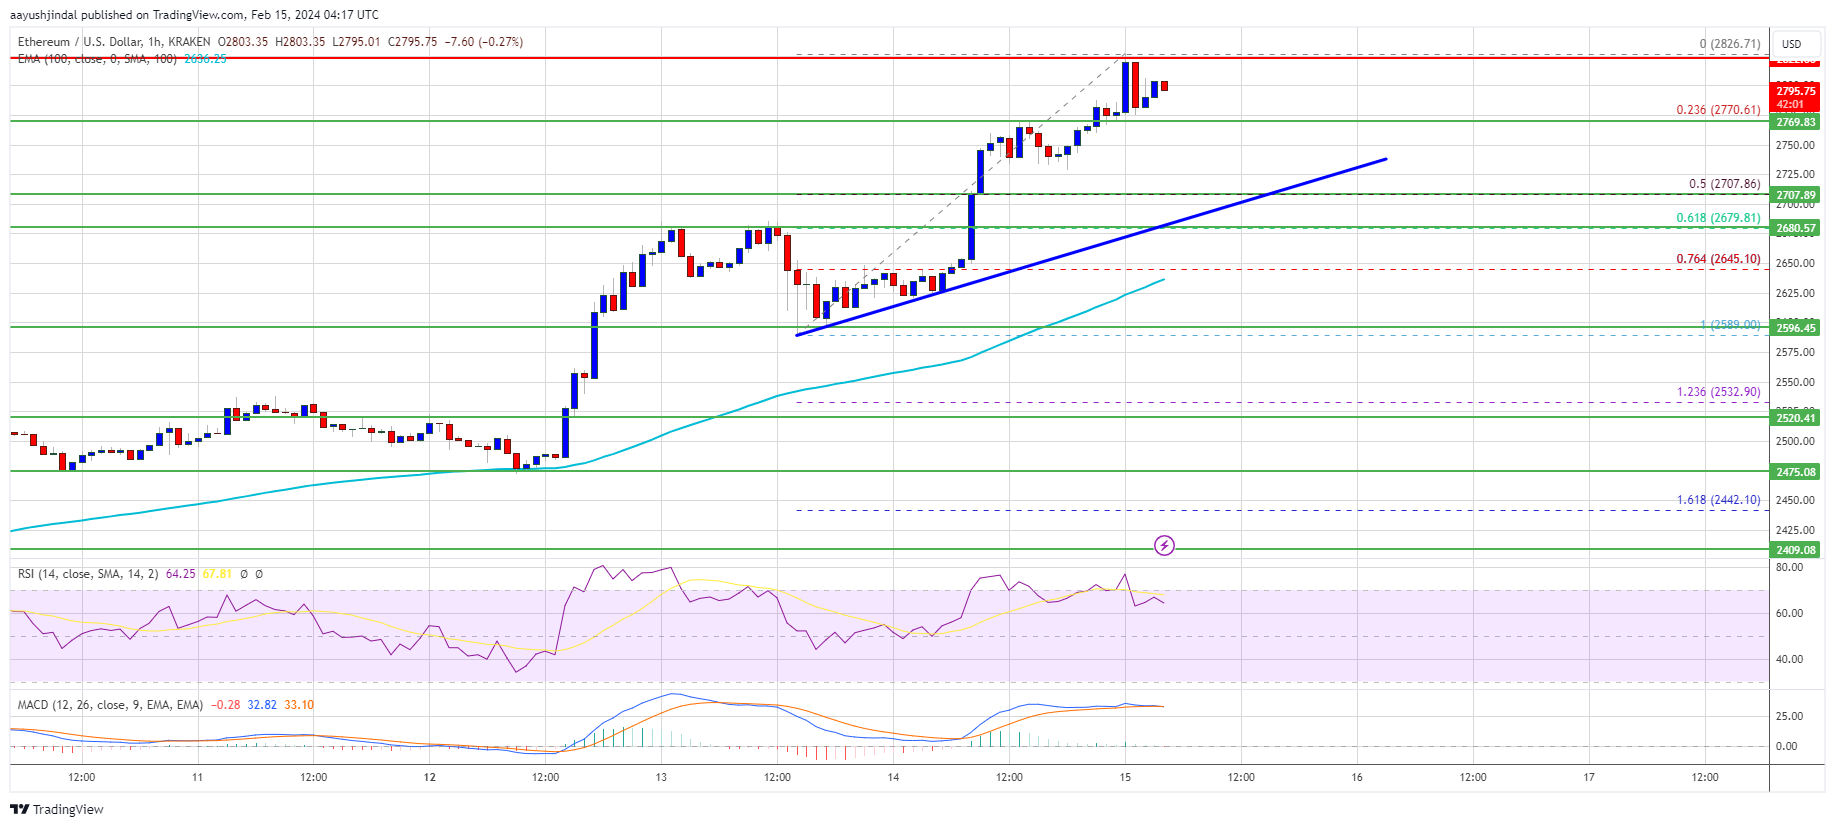
Source: ETHUSD on TradingView.com
Are Dips Limited In ETH?
In the case that Ethereum fails to clear the $2,825 resistance, a downside correction could occur. The initial support on the downside is near the $2,770 level, followed by the $2,725 zone. A decisive break below $2,725 might lead to a further decline towards the trend line at $2,700 or the 50% Fibonacci retracement level. The major support levels to watch are located at $2,640 or the 100 hourly SMA. Substantial losses could potentially drive the price towards the $2,550 level.
Technical Indicators
Hourly MACD: The MACD for ETH/USD is gaining momentum in the bullish zone. Hourly RSI: The RSI for ETH/USD is now above the 50 level.
Major Support Level: $2,700
Major Resistance Level: $2,880
Tags: ethbtc, ethereum, ethusd, ETHUSDT
Q&A: Frequently Asked Questions
Q1: Why is Ethereum gaining bullish momentum? – Ethereum’s bullish momentum is driven by increased investor confidence and positive market sentiment. The cryptocurrency’s ability to hold above key support levels and surpass resistance zones contributes to its upward movement.
Q2: What is the significance of the $3,000 resistance level? – The $3,000 resistance level is an important psychological barrier for Ethereum. Breaking above this level would indicate a strong bullish signal and could attract further buying interest from investors.
Q3: What are some potential risks to Ethereum’s bullish trend? – One potential risk is a market-wide correction or downturn, which could impact Ethereum’s price. Additionally, regulatory actions or negative news related to the cryptocurrency market could also pose risks.
Q4: How does Ethereum’s price movement compare to that of Bitcoin? – Ethereum’s price movement often mirrors that of Bitcoin, as both cryptocurrencies are considered leading assets in the market. When Bitcoin experiences a positive trend, Ethereum tends to follow suit, and vice versa.
Q5: What are the key technical indicators to watch for Ethereum? – The MACD (Moving Average Convergence Divergence) and RSI (Relative Strength Index) are important technical indicators to monitor. When the MACD gains momentum in the bullish zone and the RSI rises above the 50 level, it indicates a potential continuation of the bullish trend.
Future Outlook and Investment Recommendations
Based on the current market conditions and Ethereum’s bullish momentum, it is likely that the price will continue to move upward. Breaking above the $2,825 resistance level would be a positive development and could lead to Ethereum testing higher levels, including the crucial $3,000 mark. Investors should closely monitor the market trend and watch for potential breakout opportunities.
Furthermore, it is worth considering the long-term potential of Ethereum and its role in the blockchain ecosystem. As one of the most prominent cryptocurrencies with multiple real-world use cases, Ethereum has the potential to deliver significant returns for investors. However, it is important to conduct thorough research, assess risk tolerance, and consider diversification before making any investment decisions.
Reference List:
- Ethereum
- Bitcoin
- Kraken
- ETHUSD on TradingView.com
- Epic Rally Alert: Solana Hourly Chart Reveals Bull Flag Formation – SOL Targets $163
We will continue to update Blocking; if you have any questions or suggestions, please contact us!
Was this article helpful?
93 out of 132 found this helpful
Related articles
- 🚀 Blockchain Mining Firm Phoenix Group Sees Impressive Growth Following IPO
- Microsoft and Google Make Big Investments in AI Development in Europe
- Crypto Law Founder John Deaton May Run Against Senator Elizabeth Warren in 2024 Senate Elections
- OpenAI and Microsoft Collaborate to Combat Cyberattacks
- Over 1 Million Telegram Users Embrace Blockchain Wallets: What Does This Mean for the Future of Digital Assets?
- Bonk (BONK) Set to Skyrocket with Potential Listing on Revolut: Learn, Earn, and Have Fun!
- Shiba Inu: Breaking Out of the Doghouse

