Global FinTech Financing Report 2019: Blockchain Financing Amount Leads Above 261.9 Billion
In 2019, the Zero One Fintech Investment and Financing Index (01GFI) reached the highest value of 180 in June, the second highest point in March was 179, and then fluctuated around 160. The latest index in December was 151.
· According to incomplete statistics from Zero One Think Tank, at least 1166 financings (another 55 mergers and acquisitions) occurred in the global financial technology sector in 2019, a decrease of 46 from 2018; the total amount of publicly disclosed financing was approximately 261.9 billion yuan, a decrease of 1212 from 2018. Billion yuan. The peak of the amount and amount of financing for the whole year appeared in July, with 134 financings involving a total amount of 41.9 billion yuan.
· China has 285 fintech financing events, accounting for 24.4% of the world's total; the United States and the United Kingdom have 273 and 128, respectively. The total amount of public financing disclosed by the United States is 74.4 billion yuan, accounting for 28.4% of the world's total. It is far ahead of China (65.6 billion yuan) and India (38.4 billion yuan).
The popularity of online lending and blockchain continues throughout the year. The former has 110 financings with a total of about 48.7 billion yuan; the latter has 258 financings with a total of about 13.6 billion yuan. The auto finance boom is rising. Although there were only 30 financings in the year, the total funds involved reached 14.9 billion yuan.
- Watch | Policies continue to assist, Bitcoin options go public, this week is a lot better
- DeFi weekly selection 丨 the total value of the lock position exceeds 1.1 billion US dollars, the DeFi era of sailing is beginning
- Observation | Blockchain accelerates the digital transformation of commercial banks
I. One One Global Fintech Investment and Financing Index (01GFI)
1. The overall 01GFI trend is oscillating upward
Throughout 2016 ~ 2019, 01GFI showed an overall upward trend. The index climbed from the benchmark of 100 in January 2016 to 151 in December 2019, an increase of 51%.
The index hit an all-time high of 227 in June 2018, and a second high of 190 occurred in March 2018. Except that the GFI in January and March of 2016 was below the baseline value of 100, the rest of the month fluctuated around 130.
Figure 1: Trends of the Fintech Investment and Financing Index (01GFI) over the years
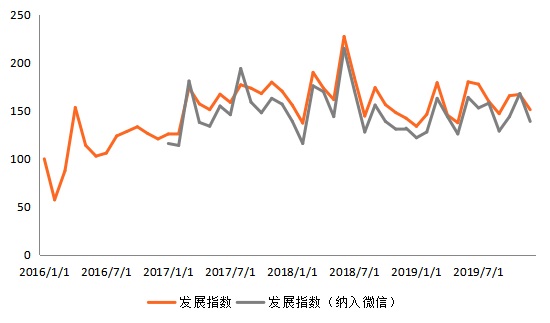
Source: Zero One Think Tank
Note: 01GFI (01 Global Fintech Index) is the first domestic fintech index launched by Zero One Finance? The index is based on January 2016 with a base of 100 and is published monthly. See the standard for details: http://www.01caijing.com/article/38862.htm
After the WeChat search index was included in the 01GFI in January 2017, it changed in the same direction as the development index (not included in WeChat), with only three increases exceeding the development index, respectively in March 2017 (181) and August (194). And November 2019 (168).
2. 01GFI showed a volatile trend in 2019, reaching a maximum of 180 in June
In 2019, the Zero One Fintech Investment and Financing Index (01GFI) showed a volatile trend. The index reached a peak of 180 in June, a second high of 179 in March, and fluctuated around 160 in the second half of the year. The GFI after the inclusion of the WeChat index is similar to the overall trend before it was included, reaching a peak of 168 in November.
Figure 2: Trends of 2019 One One Fintech Investment and Financing Index (01GFI)
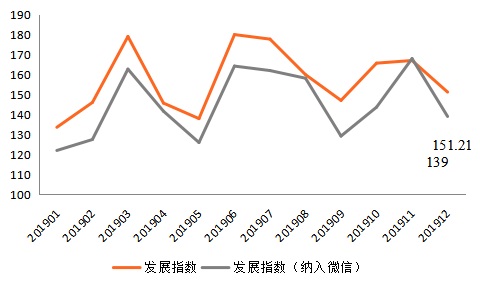
Source: Zero One Think Tank
In December, the Zero One GFI index was 151, a 9.6% decrease from the previous month, and an increase of 6.3% year-on-year. The GFI, which has been included in the WeChat index, has fallen from a high point to 139, a 17.2% decrease from the previous month and a 5.3% increase from the previous year.
Overview of global fintech financing from 2015 to 2019
1. Financing fever is increasing year by year, hitting a record high in 2018
According to incomplete statistics of the Zero One Think Tank, the number of global fintech investment and financing and the total amount of publicly disclosed financing increased from 2015 to 2018, and there was a slight decline in 2019, but the amount of financing was still at a high level.
Figure 3: Global Fintech Financing Volume and Amount from 2015 to 2019
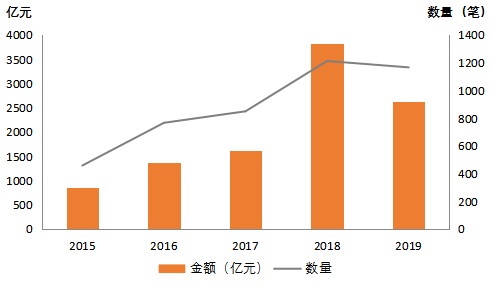
Source: Zero One Think Tank
2018 is undoubtedly a year of rapid development for the global fintech industry. A total of 1,212 projects worldwide received a total of 383.1 billion yuan in financing, an increase of 43% over the amount of financing in 2017. It is particularly noteworthy that Ant Financial's Pre-IPO financing amounted to US $ 14 billion, accounting for 25% of the total financing amount in 2018.
2. In 2019, there were 1,166 fintech financings worldwide, with a total financing amount of 261.9 billion yuan.
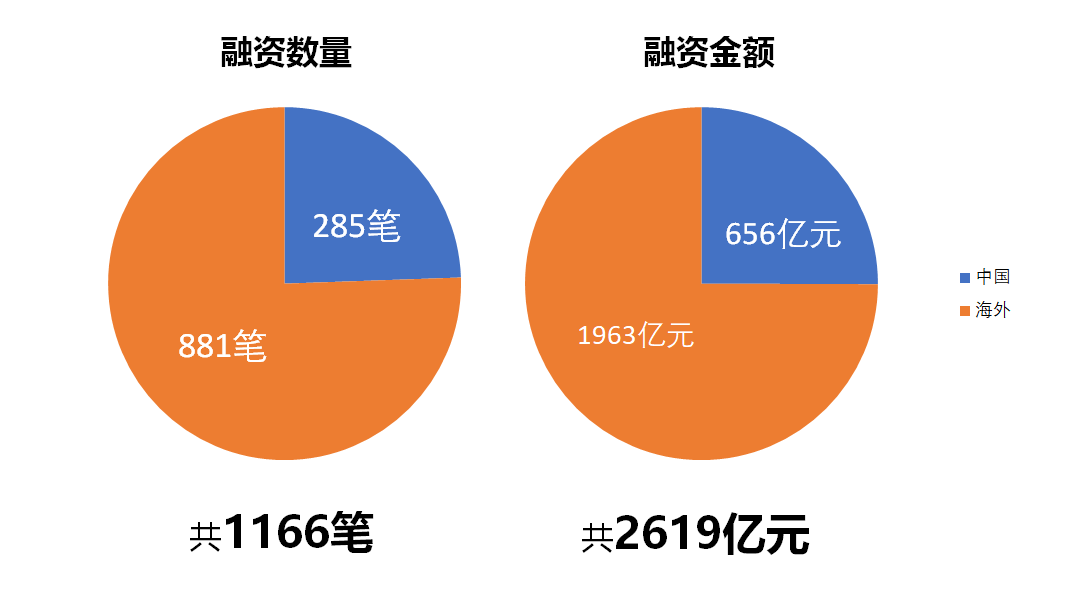
According to incomplete statistics from Zero One Think Tank, there were 1,166 equity financing events in the global fintech sector in 2019, a decrease of 46 from 2018, a decrease of 3.8%; the amount of publicly disclosed financing was approximately 261.9 billion yuan, a decrease of 121.2 billion from 2018. A decrease of 31.6%.
Figure 4: Number and amount of FinTech financing at home and abroad in 2019
Source: Zero One Think Tank
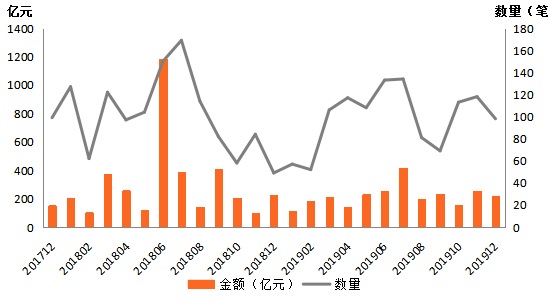
The global fintech financing volume has stabilized in 2019 after undergoing significant fluctuations in 2018, and the overall amount and amount of financing in the second half of 2019 are slightly higher than the first half.
Figure 5: Monthly trends in global fintech investment and financing from 2017.12 to 2019.12
Source: Open Channel, Zero One Think Tank
Note: For the convenience of statistics, this article converts foreign currencies into RMB at the opening exchange rate on the last trading day of the month in which the financing is disclosed. The same applies below.
The peak amount of global fintech financing in 2019 all appeared in July, with 134 financings involving a total of 41.9 billion yuan. On the whole, the average monthly financing event in 2019 is about 100, and the total financing is around 20 billion yuan. The amount of financing in January and February is small, and the amount of financing in June and July is large.
Analysis of Global Fintech Financing and M & A in 2019
1. China has the largest amount of financing in the world, and the United States has the largest amount of financing
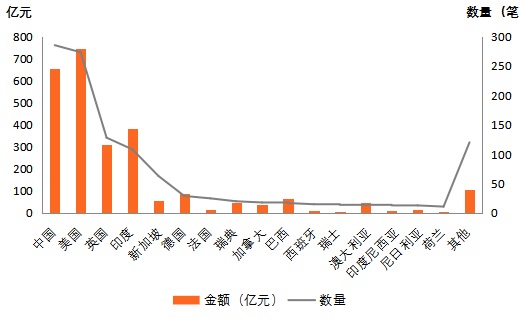
According to the incomplete statistics of the Zero One Think Tank, the global fintech financing incidents in 2019 involved 56 countries, mainly in China, the United States, the United Kingdom and India. China's fintech investment and financing totaled 285, accounting for 24.4% of the world's total; the United States and the United Kingdom followed with 273 and 128 respectively, and India ranked fourth with 108. Except for Singapore's 63, other countries have not reached 30.
Figure 6: Number and amount of financing in fintech in various countries in 2019
Source: Open Channel, Zero One Think Tank
From the perspective of the amount of financing, the total amount of publicly disclosed financing in the United States was 74.4 billion yuan, accounting for 28.4% of the world. (30.8 billion yuan). The financing amount of other countries is less than 10 billion yuan, the highest of which is 9 billion yuan in Germany.
Figure 7: Financing in “other” countries in fintech in 2019 (39 countries)
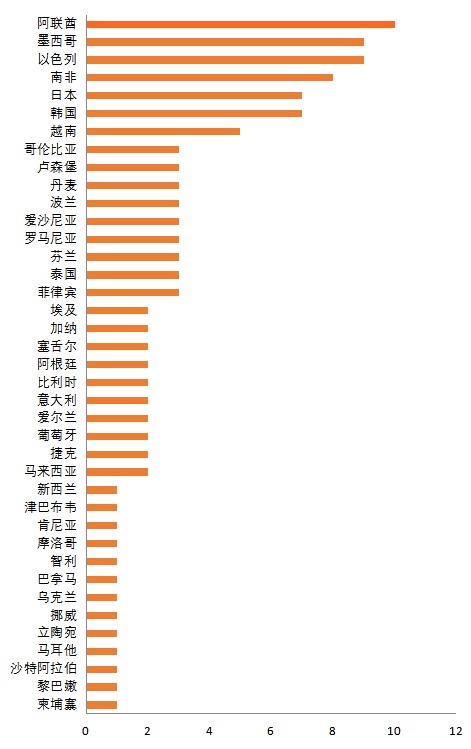
Source: Open Channel, Zero One Think Tank
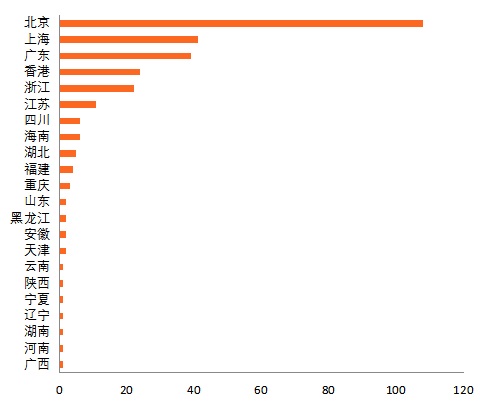
In 2019, the overall distribution of China's fintech investment projects still appears to be converging towards economically developed regions. Jiangsu, Zhejiang, and Shanghai in Beijing, Guangdong, and the Yangtze River Delta region have performed well, highlighting regional advantages.
Figure 8: Regional distribution of China's fintech investment projects in 2019
Source: Open Channel, Zero One Think Tank
2. Online lending and payment fields are popular with capital, and the number of blockchain investment and financing ranks first
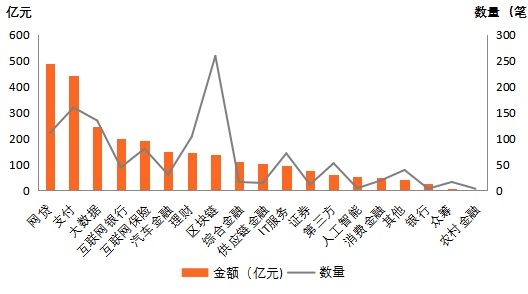
In 2019, the field of online lending and payment was favored by capital, with the financing amount accounting for 35.5% of the total financing amount, which was 48.7 billion yuan and 44.2 billion yuan, respectively. In the whole year, there were 10 areas where the amount of financing exceeded 10 billion yuan. Among the remaining areas, the highest amount of financing was 9.6 billion yuan in IT services, and the lowest was 12 million yuan in rural finance.
Figure 9: Number and amount of financing in the hot segment in 2019
Source: Open Channel, Zero One Think Tank
Note: A company / project may involve multiple business types. For convenience, we make corresponding statistics for its main business.
Although the blockchain field has only 13.6 billion yuan in financing, the number of projects invested has reached 258, ranking first. Followed by payment and big data, there were 159 and 134, respectively.
Internet insurance and wealth management in the second echelon also maintained financing enthusiasm, and the amount and amount of financing were higher than the average: Internet insurance financing amounted to 80, the amount of financing was 19.2 billion yuan; the number of wealth management financing was 103, and the amount of financing was 14.6 billion yuan.
The auto finance boom is rising. Although there were only 30 financings in the year, the total funds involved reached 14.9 billion yuan. In contrast, crowdfunding has been cold-shouldered, with 16 financings, but the total amount is only 179 million yuan.
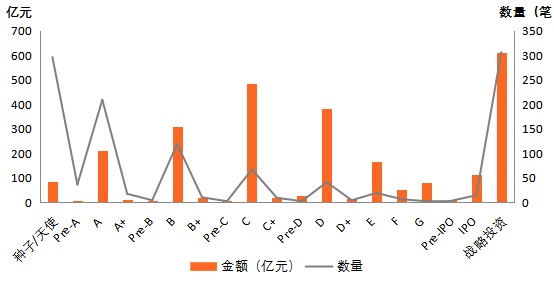
3. The financing amount before the C round accounted for 59%, and the financing amount accounted for 25%.
In 2019, there were a total of 693 pre-C financing rounds worldwide, accounting for 59% of the total; the corresponding financing amount was 65.4 billion yuan, accounting for 25% of the total. From a single round, the top 3 rounds with the largest number of financing are strategic investment, seed / angel round, and round A; the top 3 rounds with the largest amount of financing are strategic investment, round C, and round D.
Figure 10: Distribution of global fintech financing rounds in 2019
Source: Open Channel, Zero One Think Tank
There are 19, 6, and 2 companies that have received E, F, and G rounds respectively: China Dianrong.com has received $ 100 million in Series F financing; Indian mobile payment platform Paytm has completed $ 1 billion in Series G financing; and US digital loan technology companies Blend raised $ 130 million in Series E funding.
There were 167 rounds of C rounds and subsequent rounds, of which 55 were in the US (1 IPO), accounting for 33%; China had 52 (13 IPOs), accounting for 31%. There were 13 rounds of financing in the E, F, and G rounds in the United States and only 2 in China. Taken as a whole, the maturity of the US fintech investment and financing market is relatively high.
4. 55 mergers and acquisitions occurred in the second half of the year, with China and the United States accounting for 60%
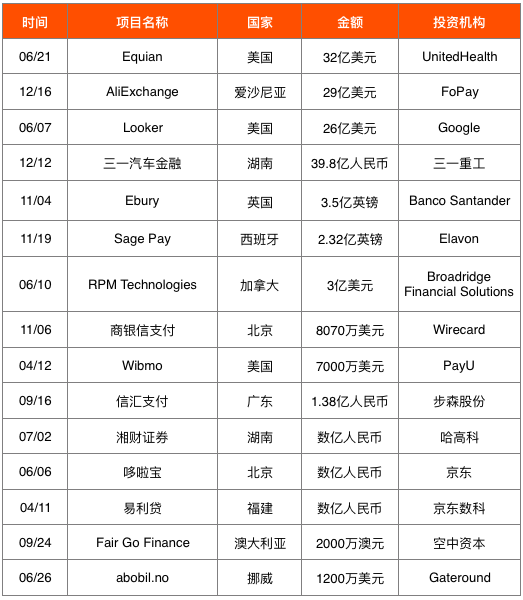
According to the incomplete statistics of the Zero One Think Tank, in 2019, the global fintech industry conducted a total of 55 M & A transactions with a total value of more than 73.8 billion yuan (only publicly disclosed amounts are counted). There were only 5 M & A events in the first half of the year, and 49 in the second half, accounting for 89% of the total.
Table 1: Major Global Fintech M & A Events in 2019 (listed in descending order by M & A amount)
Source: Open Channel, Zero One Think Tank
There were 23 mergers and acquisitions in China, the largest number, followed by the United States (10). The largest M & A transaction was June 21 when United Health Group Inc. (UNH) spent about $ 3.2 billion to acquire American healthcare payment company Equian LLC from a private equity firm.
4.Top 20 Global Fintech Financing Lists for 2019
Although the number and amount of investment and financing have declined compared to the overall investment, large-scale financing of investment cases in 2019 is not a minority, and at least 100 Fintech companies / projects have received more than 100 million US dollars in financing.
The top 20 list of global fintech investment and financing in 2019 is shown in Table 1. The 20 companies raised financing amounts of nearly 300 million US dollars or more. It is worth noting that Greensill, a British supply chain financial service provider, completed two strategic financings in 2019, and the financing amounts were within the Top 20, which were 800 million and 655 million US dollars invested by Softbank, respectively.
Table 2: Top 20 global fintech companies / project financing in 2019 (in descending order of financing amount)
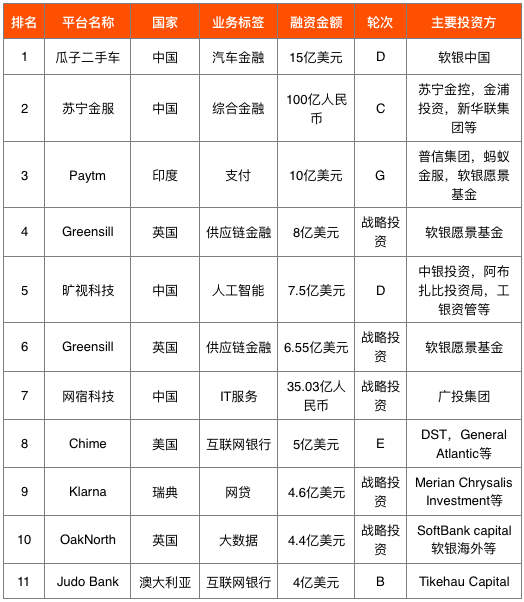
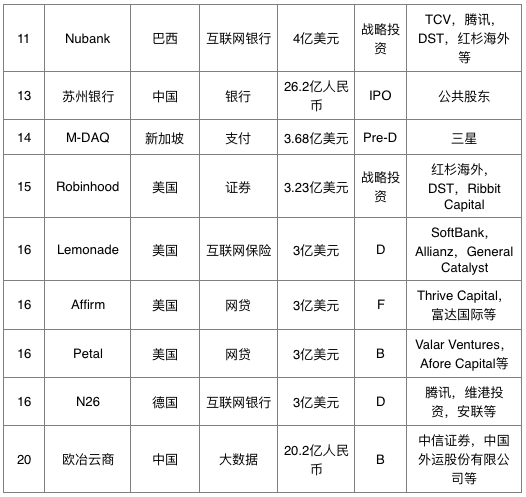
Source: Zero One Think Tank
Chinese fintech companies occupy 6 seats on the list, followed by the United States (5) and the United Kingdom third (3). Beijing Guazi second-hand car parent company Car Haotuo Group received US $ 1.5 billion in Series D financing and ranked first in the list; Suning Financial Services completed its Series C financing of RMB 10 billion and ranked second. It is worth noting that after this financing, Suning Finance officially operated independently and became a holding subsidiary of related party Suning Financial Holdings.
Figure 11: Top20 company country and round distribution
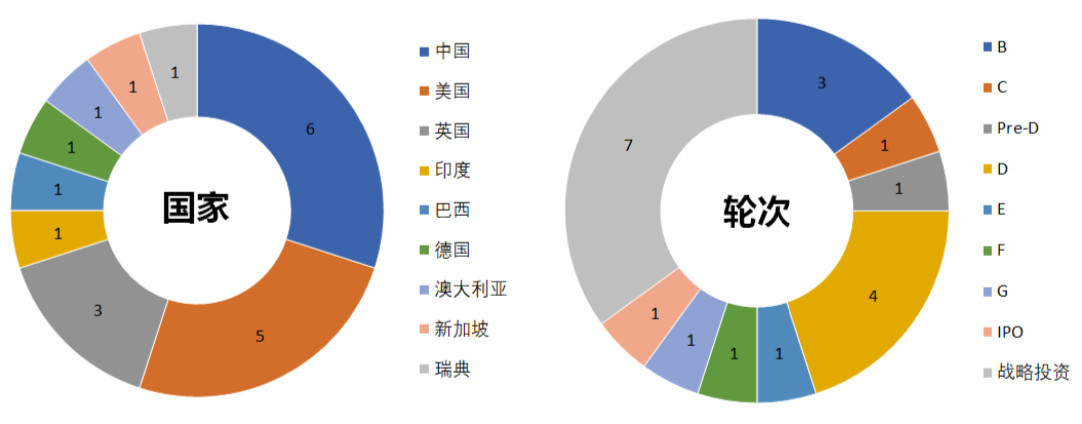
Source: Open Channel, Zero One Think Tank
It can be seen from the distribution of rounds that large-scale financing of fintech is more concentrated in the higher rounds. In addition to strategic investment, round D and above account for 40%. In contrast, round B can get 3 There are only three companies with more than US $ 100 million in financing: Australian internet bank Judo Bank, US online loan platform Petal, and Shanghai Big Data service platform Ouye Cloud Merchants.
We will continue to update Blocking; if you have any questions or suggestions, please contact us!
Was this article helpful?
93 out of 132 found this helpful
Related articles
- Xiao Yan: What is the legal boundary of blockchain technology and its application?
- Featured | Examining various centralized and decentralized crypto lending platforms
- Money laundering, stolen money, murder, Malta's bad crypto dream
- Can the central bank digital currency replace the US dollar in the future?
- Promote the progress of digital currencies in various countries. Will stable currencies such as Libra still have huge development potential in the future?
- Counting mining 2019: the seven major mining pools have annual revenues of more than 10 million and a variety of cloud computing power contract losses
- 27 blockchain companies' performance forecast last year