How to correctly view the data of the currency circle
In the trading industry, there are many analytical reports and data to be faced every day. Before judging, you will first examine their validity and credibility.
The validity is that this statistic, whether this indicator has realistic meaning, such as investigating per capita income, the median is more convincing than the average, but most studies focus on the latter; credibility depends on whether its mathematical characteristics are accurate enough .
I thought it was –
If the logic of the analysis is correct, it doesn't matter if the data is less.
01
This picture has recently been circulated again, but the information and analysis it contains has a lot of loopholes.
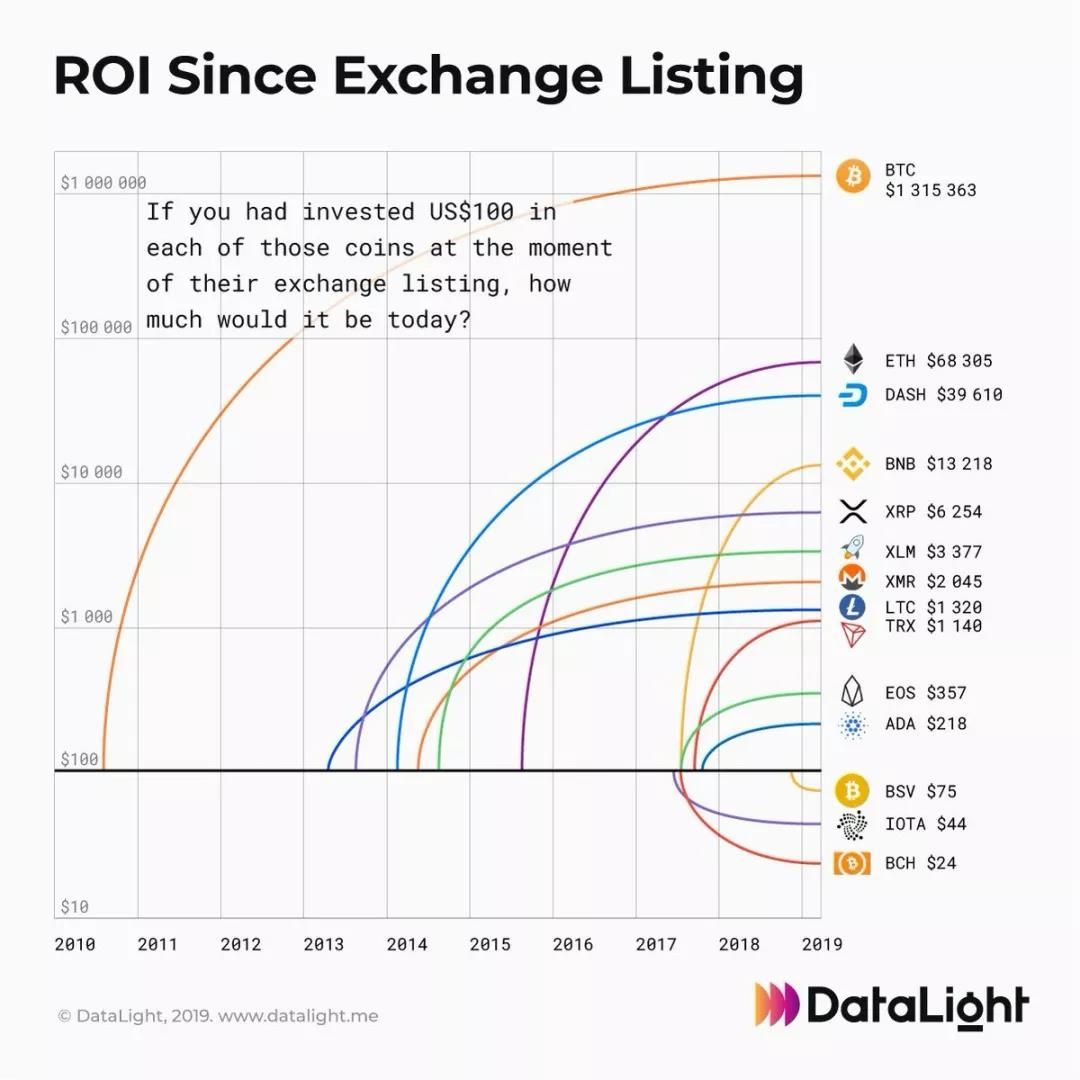
ROI is Return on Investment, which shows the performance of several cryptocurrencies since the first online exchange. If you buy $100 at the beginning and hold it so far, then the highest profit is BTC and the lowest is BCH.
However, an obvious mistake is that it overemphasizes the return on income and ignores the time dimension , at least in visual terms.
It can be seen that the BTC cycle is 9 years, while the BCH cycle is only 20 months. Therefore, comparing the return on investment of various currencies based on this has a serious logic flaw. It's not just because it doesn't take into account its past situation, and it doesn't catch up with the future. It's just a gimmick.
A more realistic problem: there are 1 billion real trading situations, that is, without this, I bought 100 knives on the online date, and then I kept it and waited for it to be described by the cartographer. If so, where is that person?
In the market, there are many analysts trying to predict the future trend. Even the most famous counter-finger can occasionally be the last time, but the ROI in the picture has successfully avoided all the past and future situations, which is really admirable.
02
There are many people, the data is tens of millions, true or false, right or wrong, how much good and bad, old and new, how to choose to check?
To be more precise, how to avoid misunderstanding and misjudgment caused by misreading?
for example–
Bitcoin, I have calculated the amount of money required from 3900 to 5100, and no more than 60,000 bitcoins, so that the entire market can move around 1200 knives, so it is still quite small in terms of transaction volume, liquidity. It is the most important indicator to measure the market bulls and bears.
Obviously, how is the calculation of "no more than 60,000 bitcoins"?
How does this seemingly accurate data without the verification process support the following conclusions? You can't just rely on the position of the assertor in the industry. Another possibility is that he borrowed money to buy bitcoin for you.
This passage is quoted from an article written by a writer who was quoted from a circle of friends.
One layer of filtration, one pass, can guarantee the final view of the data, the conclusion is the original taste?
03
In the field of data science, data acquisition, cleaning, and mining are endless. There are not only three paradigms of the database, but also the CRUD principle based on this. This is a very professional job.
The following are the personal views and experiences of the data, for the Secretary to participate, not enough.
Raw
Raw is raw data, which is different from deductive data.
Suppose you are the general manager of an investment company. Today is the end of the month. You have to look at the performance of 10 intern managers in the past month. The assistant has placed their comprehensive results on your desk.
The overall score is the weighted subjective indicator and objective indicator. Subjectively dressed as clothes, talk, etc., objective indicators are the return on investment, risk control capabilities.
But you are suddenly dissatisfied with the weight of the subjective indicators, because the company is too strict with the formal dress, which is unfair to managers with strong business capabilities.
As a veteran who has been in the industry for many years, you know that a manager who looks like a takeaway brother may be better suited to the job than a manager who looks like a manager. In the words of Taleb, " Choose the person who looks like a butcher to be your surgeon ." This is the primary and secondary compensation.
You have developed a new weight index, but the assistant tells you that only the weighted results on the report, the original data has been archived, so now you can't immediately weight it.
So, you and the assistant look at each other. She has grown a lot.
From raw data to deductive data, deductive methods are needed, but how to ensure that a deductive method is the best?
There are various indicators in the trading market, which are derived from basic data such as price, trading volume, turnover rate, and order ratio, such as the GBI (Global Blockchain Index) and ROI (off-site). Index), BMLS (bitcoin margin long-short ratio).
I never look at those indicators. First, their changes lag behind the original data. So why bother to refer to them; second, the more important things, not the models they make, don’t believe it.
There is nothing wrong with deduction, and it is not a bad solution to return to the original.
From deductive data to raw data, it is actually the dimensionality reduction of the data, that is, the multidimensional data is reduced to a low dimension as much as possible. This not only improves accuracy but also reduces the amount of work.
Remember what you said at the beginning? As long as the logic of the analysis is correct, it does not matter if there is less data.
Dynamic
The goal of pursuing dynamic data is to capture trends. The simple way is to clarify the variables and the dependent logic.
For example, in motion, acceleration affects speed and speed affects distance. In the trading market, the bulls and bears are cyclically converted, and the ups and downs cannot be consumed in the short term. In the industry, capital gathers technology and personnel to form an industrial company, so that ordinary participants have jobs to do.
Therefore, in data selection, acceleration is more important than speed, volume is more important than price, and profit growth is more important than growth.
The essence of finding dynamic data is to gain dynamic thinking and realize that everything is changing. The most extreme practice is to verify that the data it references is out of date each time you view a report. Timeliness is included in the dynamics.
Dynamic thinking can largely avoid short-sightedness caused by path dependence and mindset. The old man of the coin circle has predicted that the bitcoin bull and bear cycle will remain in the “spring, summer, autumn and winter”.
So far, almost no analysis has been reported, and the bitcoin transaction volume began to explode in May 2017. Another fact is that the K-line charts of several major exchanges are currently starting in the fourth quarter of 2017.
A person has his own time, and a group of people form a collection. If you want this person or group of people to experience all the market conditions, the only way is to achieve a dynamic balance.
Origin
Origin, the meaning of "source".
This is the basic literacy of (scientific) work. This is not a matter of concern. However, when I saw various analysis reports, I couldn’t help but list them separately for warning.
Not only the currency circle, but in other places, this practice of not asking the source of the source is also frequent. Wisdom without provenance is not worth emulating, and data without sources is not trustworthy.
There are two main reasons why rotten-source analysis reports are popular. First, the research is a bit cumbersome, and readers are not willing to spend time. Second, the burden of proof lies with the opposing party. Before the criticism, the report's views are correct by default.
Think about it, can you have a problem with a writer because of a problem with a data in a report? But we can always remember the report with the wrong data.
If you analyze a blockchain project report, your data may come from
> 1. Citing its official report; > 2. Citing a professional research institution report; > 3. Citing an industry-recognized research report; > 4. Citing a big WeChat friend circle, Weibo dynamics; > 5. Active Seek data on its chain.
However, the acquisition, processing, and analysis of data on the chain requires a lot of work, and the average person can do the job. Otherwise, any institution like Goldman Sachs can enter.
Other data, how do you guarantee that they are first-hand and correct?
Therefore, it is difficult to believe that project analysis reports written by people without professional data background, especially put a lot of data and charts. They use a lot of data to disguise their logical incompatibility.
Review the previous conclusions –
If the logic of the analysis is correct, you don't need too many charts and data.
Of course, we can't ask all analysts to have strong data acquisition, processing, and analysis capabilities. Considering that the research data used by everyone is the same, let the current plan be the correct rule under the same principle.
One thing to emphasize is that if the key data in an article does not give a specific source or an explicit algorithm, don't believe it. ** The more precise the thing, the easier it is to make mistakes. **
At this point, Raw, Dynamic, and Origin have all been finished, and the three may not always match. But using them to correspond can greatly avoid misreading and misinformation.
04
In addition, it is worth mentioning that Multi-dimension (multidimensional), which is not contradictory with Raw.
Raw For individual data, Multi-dimension is aimed at the whole system. For example, to look at the heat of a project, not only depends on the number of Weibo fans, but also on its twitter, reddit, telegram, WeChat group, etc.; not only the number of fans How much depends on the fan activity and the amount of post forwarding…
A lot of indicators, choose the key one as much as possible. If you don't know what is the key data, then multi-dimensional measurement, machine learning is so powerful, on the one hand because it can practice infinitely, on the other hand, it naturally has multi-dimensional processing capabilities.
(Author: bits complaining)
We will continue to update Blocking; if you have any questions or suggestions, please contact us!
Was this article helpful?
93 out of 132 found this helpful
Related articles
- USDT black history is a basket, how far can the stable currency go away from supervision?
- In 2019, BTC rose 45%, and digital gold defeated physical gold! The whale is also constantly moving
- Digital currency analysis company chain analysis is currently monitoring 10 digital currencies
- Kraken's BTC fell below $5,000 before the Bitfinex incident triggered market suspicion
- Studies have shown that the encryption hijacking behavior for consumers is "essentially extinct"
- Ripple's XRP online trading market broke through 1000+
- Will the tax become a fatal injury to the cryptocurrency of the equity certificate?


