Overview of the crypto asset industry in 2019: the rotation of the cycle and the dawn of dawn
Source: BlockVC
2019 is a year in which the crypto asset industry has gradually recovered from the slump in the bursting of the bubble, and it is also a year in which the industry has transformed from a primary market investment to a secondary market trading style. Boosted by the IEO model, the primary market experienced a brief boom in the first half of the year, and topics such as DeFi and stablecoin continued to ferment. With the rise of Bitcoin's main rising wave, the properties of crypto asset trading have begun to highlight, compliance exchanges have entered the market, and the development of financial derivatives has once again stimulated participants' hype.
The periodic rotation of the global macro economy forms a resonance with the halving cycle of crypto assets. The geopolitical and deglobalization processes have promoted the hedged attributes and risk asset attributes of crypto assets to be superimposed on each other. Pushing the concept to the stage again, it also sheds light on the future development of the crypto asset industry.
Facing the "half quotation" in 2020 and the "paradigm shift" of the global macro economy, the first half of the crypto asset industry is still in the ascendant, with both opportunities and challenges.
- What would Soros do if he wanted to destroy Bitcoin?
- These 7 directions are expected to become "new air outlets"! “ Sichuan Province Blockchain Industry White Paper (2019) '' released
- Higashino Keigo and Zhang Xinzhe all "boarded"! Concert ticket data on the chain
1. Primary market
1.1 Investment and financing were dismal, IEO became the only bright spot
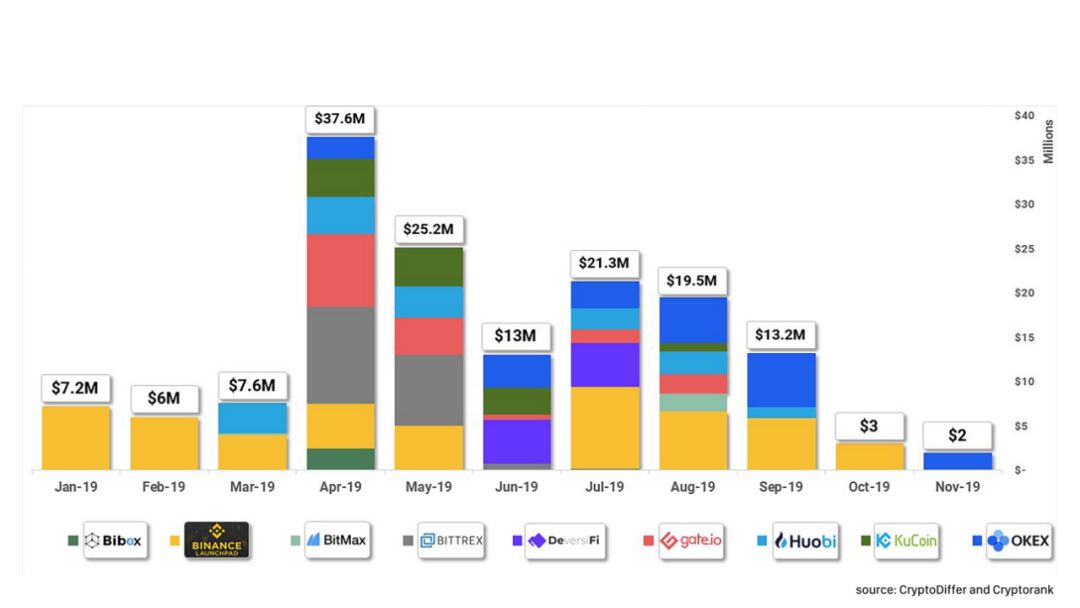
Figure 1 IEO funds raised and proportion in 2019
Source: CryptoDiffer, CryptoRank
Figure 1 shows the total amount and proportion of funds raised by IEOs through IEOs in the whole year of 2019. The total IEO funds raised in the market rose from 9.2M USD in January to 37.6M USD in April, slightly lagging behind, at 7 It rebounded in August and then bottomed.
From the perspective of the proportion of exchange fundraising, Binance is the initiator and backbone of the IEO boom. Since April, this form of fundraising has spread to other exchanges.
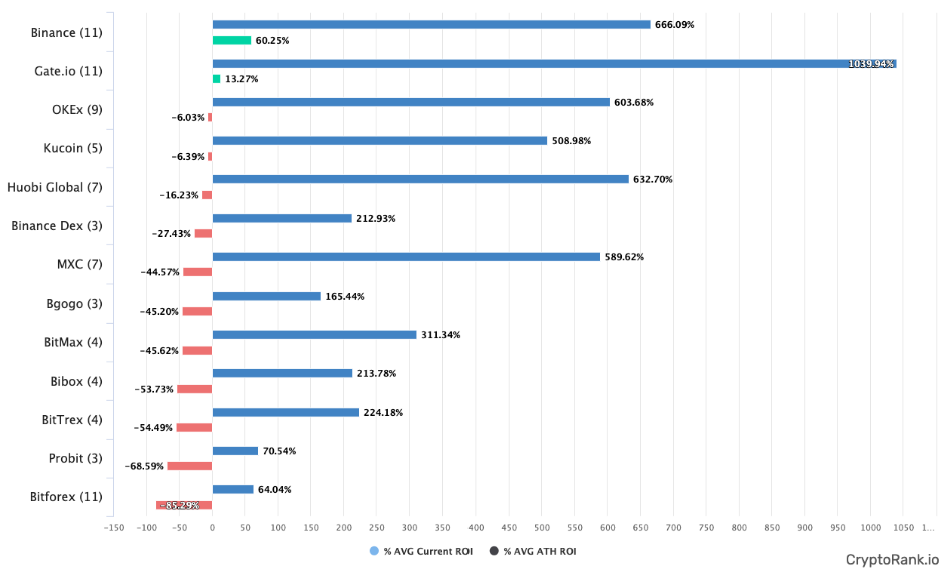
Figure 2 IEO average ROI of mainstream exchanges in 2019
Source: CryptoRank
It can be seen from Figure 2 that in the primary market investment in 2019, the return of participating IEOs is remarkable. The average maximum return of IEO on Binance is 666%, and the average maximum return of IEO of Huobi Global is 632%. The average maximum return of IEO on io is as high as 1040%.
1.2 IEO led the platform coin to lead the rise, public chain and anonymous coin theme hot spots gradually faded
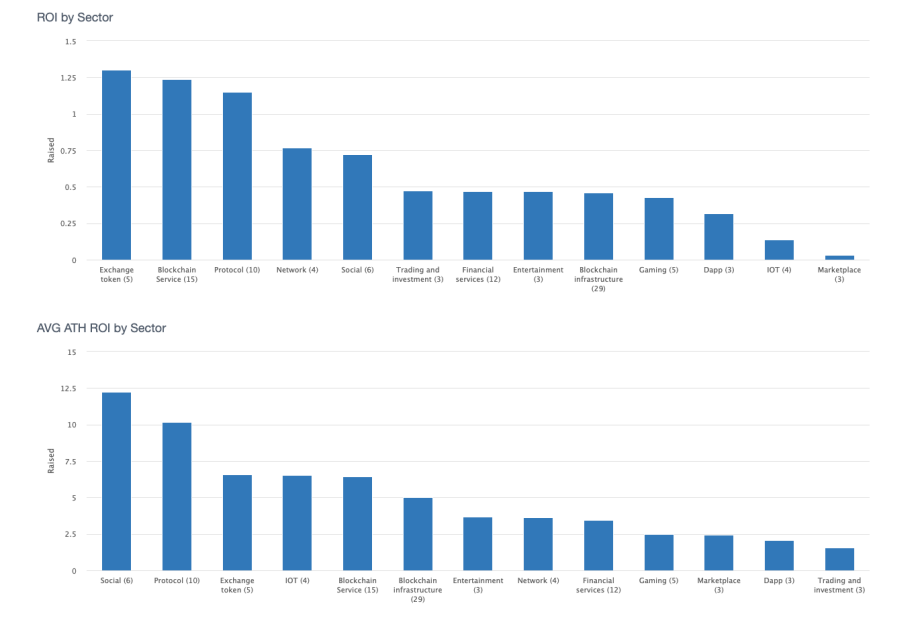
Figure 3 ROI and ATH ROI in various areas of the primary market in 2019
Source: CryptoRank
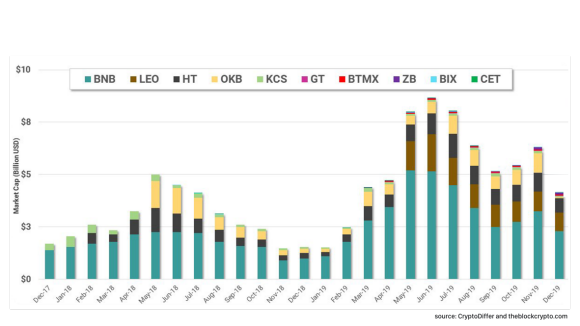
Figure 4 Market value change of mainstream exchange platform coins from 2018 to 2019
Source: CryptoDiffer, theblockcrypto
Judging from the changes in the market value of the exchange's platform currency, the market value of the platform currency reached a high point in April and June in 2018 and 2019, and the total market value of the platform currency increased significantly. Hit a record high. From the time point of view, the change trend of the market value of the platform currency in 2019 is the same as that of the IEO boom, and it lags behind the IEO fundraising scale change by about 1-2 months.
Combining the time lag and the degree of market value retracement, it can be inferred that market funds were pooled through IEO and eventually flowed into the platform currency. Exchanges and platform currencies have become the biggest winners in this round of investment boom.
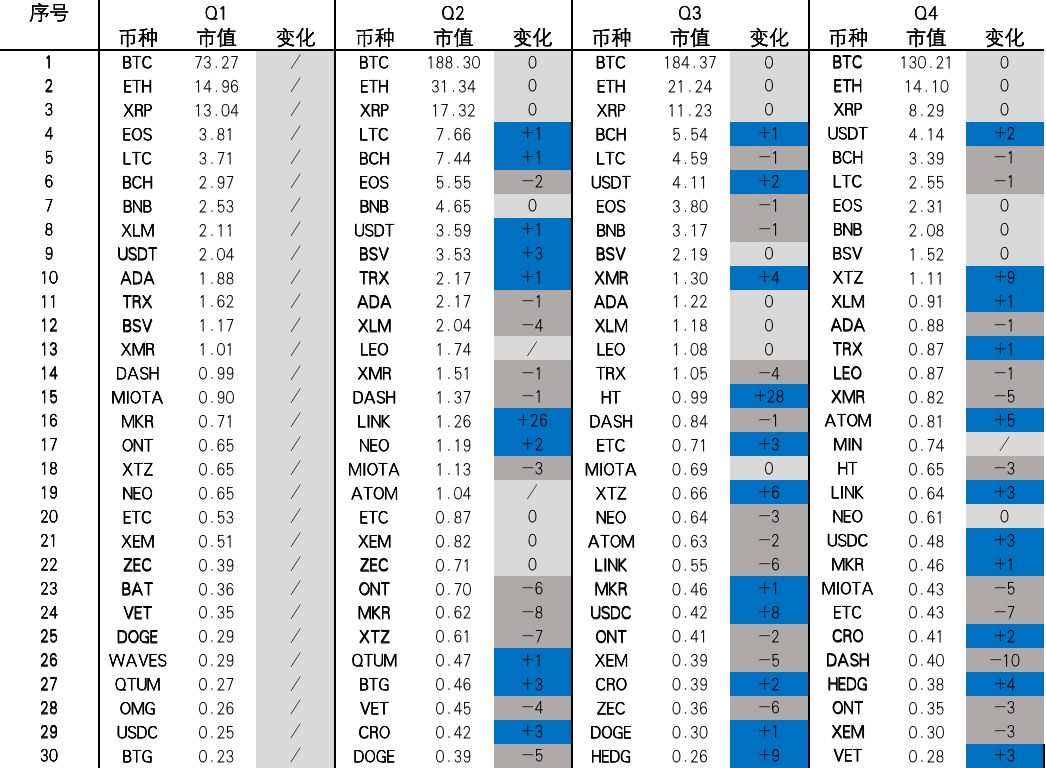
Figure 5 Market value ranking of the top 30 currencies in 2019 (unit: billion)
Source: BlockVC Research
In addition, by combing the market value rankings of the top 30 currencies, it can be found that with the style conversion of market funds in 2019, the original old public chain projects with the highest market value such as NEO, XEM, ONT, QTUM, etc., have a market value of 2019. The market value of anonymous coins DASH, ZEC, XMR also gradually declined due to the disappearance of the hot spot of the anonymous coin market at the beginning of the year; only the platform currency performed well, BNB was firmly in the top ten, and the market value of HT increased significantly in the third quarter.
1.3 DeFi leads the blockchain landing scene, the entire network locks in value to a record high
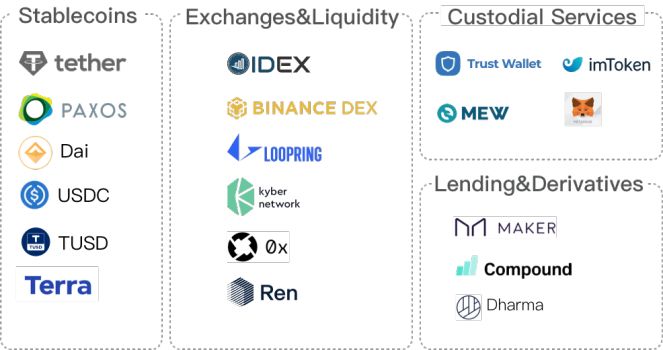
Figure 6 DeFi landing scene
Source: BlockVC Research
DeFi includes Crypto-based Finance and On-chain Finance, which can be subdivided into:
l Payment solutions, such as stablecoins;
l Exchanges and liquid markets, such as DEX;
l Borrowing and derivatives, such as Maker;
l Asset custody service tools, such as wallets.
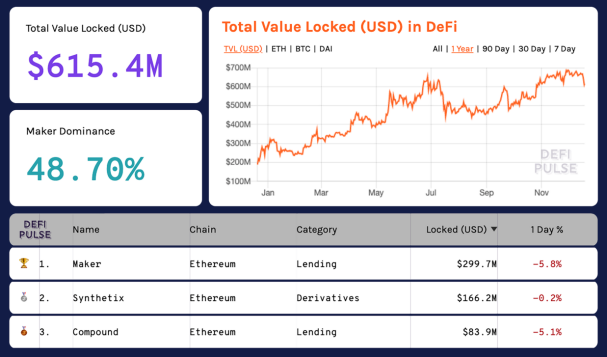
Figure 7 DeFi's network-wide lock-in value
Source: Defipulse
According to statistics, the locked value of DeFi for the whole year of 2019 increased from about 200M USD to a maximum of 700M USD, a growth rate of 350%. As of now, DeFi's entire network lock-in value is about 615.4M USD.
> DeFi applications in the top three market share are Maker, Synthetix and Compound, of which Maker's market share is close to 50%. With the launch of Maker's MCD function, its market share is expected to reach a new high.
1.4 LIBRA and DCEP announced a significant increase in the participation of stablecoins in the crypto market
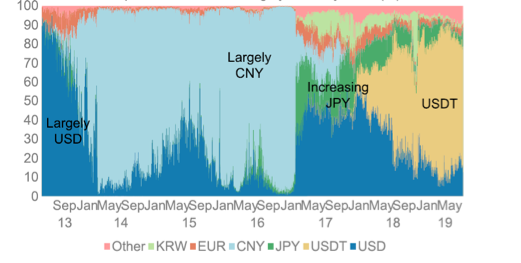
Figure 8 Proportion of transaction volume between Bitcoin and major fiat currency trading pairs
Source: Cryptocompare
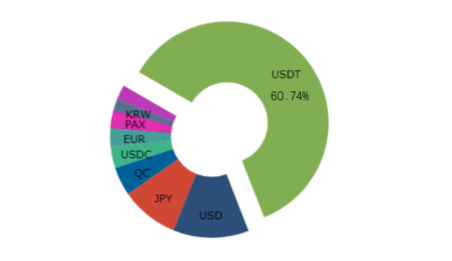
Figure 9 Cross-section data of Bitcoin and major fiat currency trading pairs (2019.12.19)
Source: Cryptocompare
Since the beginning of 2017, the proportion of RMB in bitcoin transactions has decreased significantly. The currency of bitcoin transactions has changed from fiat currency transactions to currency transactions. The proportion of stable currency transactions represented by USDT, QC, USDC, etc. has now reached 72.26. %, USDT accounted for 60.74% of the total.
From the perspective of capital inflows, among the countries and regions that use fiat currencies to trade, the United States, Japan, and Europe rank high, accounting for 12.11%, 9.21%, and 2.96%, respectively.
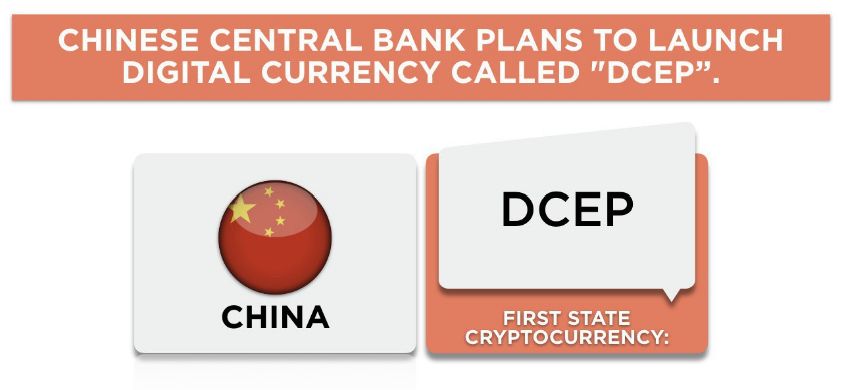
Figure 10 DCEP Source: CryptoDiffer
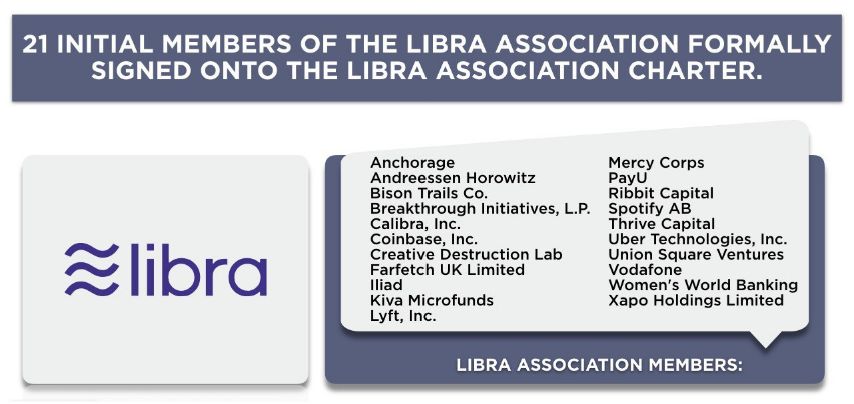
Figure 11 Libra Source: CryptoDiffer
On June 18, 2019, Facebook's global digital cryptocurrency Libra official website was officially launched, triggering global discussions on digital stablecoins. On October 28, 2019, the People's Bank of China announced the launch of a new encrypted electronic currency system DCEP based on blockchain technology, which once again ignited the stable coin boom.
DCEP is an electronic currency based on blockchain technology developed by the People's Bank of China, which helps the circulation and internationalization of the RMB;
DCEP solves the problem:
-The existing physical cash system has several pain points, and the central bank's digital currency has practical needs;
-Third party payment companies have security risks in terms of privacy protection;
-The domestic clearing and settlement system is complex, and the hierarchical management model can optimize the existing structure;
DCEP pays attention to the replacement of M0 (cash), and adopts a two-tier operation system of "central bank-commercial bank / other institutions", borrowing blockchain technology, and controllable anonymity (only disclosing transaction data to the central bank), making it compatible with other digital assets the difference.
Libra's mission is to build a simple, borderless currency and financial infrastructure that serves billions of people;
Libra solves the problem:
1.7 billion people, 31% of the world's population, without access to banking services
-85% of global trade uses cash, and cash is not easy to transport
-Current banking services are too expensive and too slow and require innovative upgrades
By joining hundreds of institutions and leveraging blockchain technology, Libra anchored a basket of fiat currencies and government bonds, and adopted mechanisms such as distributed management, open access, and secure encryption to address the above pain points and needs.
2. Secondary market
2.1 Cryptocurrency market rises first and then stagnates, Matthew effect among currencies is obvious
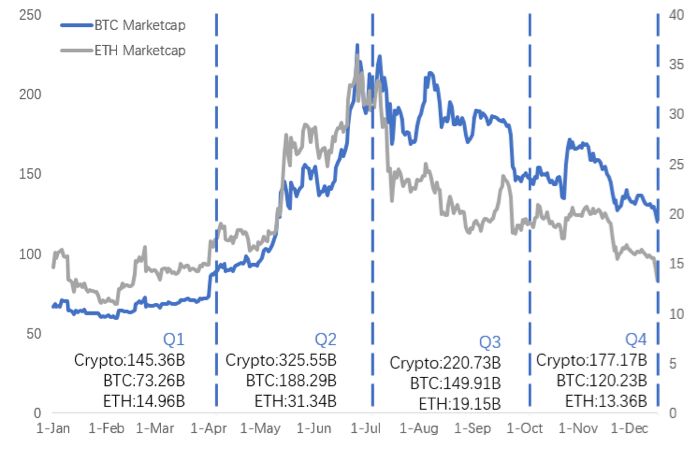
Figure 12 Market value of crypto assets in 2019 (Unit: billion)
Source: BlockVC Research
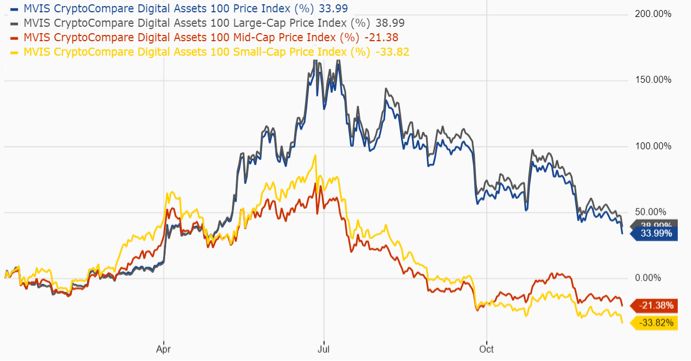
Figure 13 Trends of various crypto assets in 2019 (Unit:%)
Source: MVIS
The cryptocurrency market has experienced a cycle of ups and downs in 2019, compared with the overall market value at the beginning of the year, it has increased by nearly $ 50 billion, an overall increase of 40%;
In the first quarter, various types of crypto assets undertook the trend at the end of 2018 and repeatedly built a bottom under low volatility. Due to the IEO market, platform currencies and small market capitalization currencies performed well in the first quarter, but the cryptocurrency market is still in a general situation. In depression
In the second quarter, bitcoin as the leader rose, and the price of bitcoin rose from US $ 3,859 to US $ 13,807, reaching a high point for the year. Driven by the rise of bitcoin, the prices of small and medium-sized market capitalization currencies increased in the second quarter. The impact of Bitcoin's blood draw effect is significantly lower than that of the big market value currency;
In the third quarter, Bitcoin formed a high-level triangle arrangement of 14,000 to 10,000. At the end of the quarter, Bitcoin dropped to 8000, opening the second half of the decline channel. Driven by the broader market, small and medium-sized market capitalization currencies achieved a sharp decline in market value in the third quarter, with a large decline;
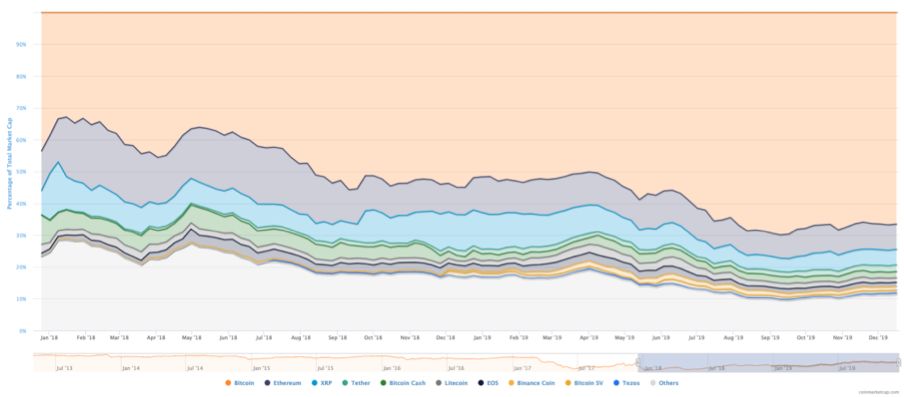
Figure 14 Changes in market share of mainstream crypto assets in the market from 2018 to 2019
Source: Coinmarketcap
From the changes in the market share of crypto assets, it can be seen that the "Matthew Effect" of crypto assets is prominent, the market is severely differentiated, and the Bitcoin market share continues to increase, up to 70%.
The market share of most crypto assets except bitcoin is shrinking. The market share of platform coins represented by BNB alone has increased slightly in the past 2 years, but the total market value is still low.
2.2 Market liquidity level increased, and correlation of major currencies weakened
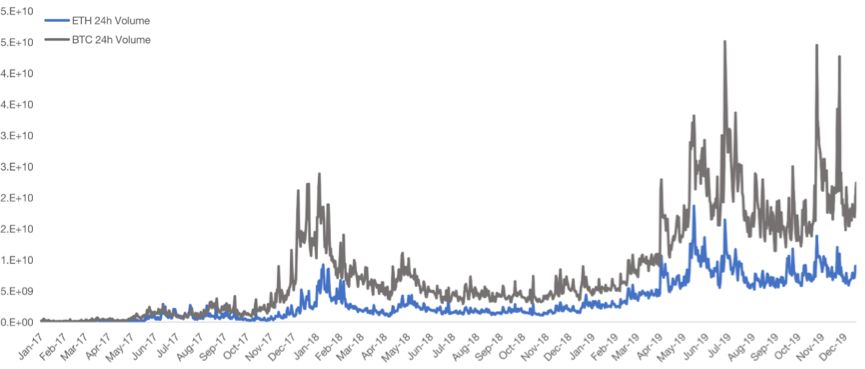
Figure 15 Bitcoin and Ethereum transaction volume in 2019
Source: BlockVC Research
With the sudden rise in the price of bitcoin at the end of the first quarter of 2019, the transaction volume of the cryptocurrency market has increased significantly, market activity has increased with the price of the currency, and the level of liquidity since the bear market has been repaired;
Compared to 2017-2018, the trading volume of the crypto digital currency market in 2019 has increased significantly, and the entry effect of external funds has appeared;
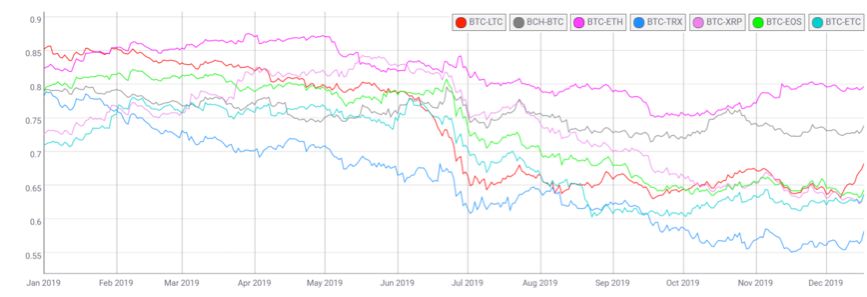
Figure 16 Correlation analysis between Bitcoin and mainstream currencies in 2019
Source: Coinmetrics
From the perspective of asset linkage, Figure 13 lists the changes in the correlation coefficient between Bitcoin and mainstream virtual currencies in 2019.It can be seen that Bitcoin is still highly correlated with other mainstream currencies, but the correlation coefficient between currencies continues to decline. ;
In view of the currency market trend of small and medium market capitalization, the market has a strong preference for bitcoin, and the new funds have weak support for the overall market.
2.3 Crypto markets return to rationality, Bitcoin's risk-averse attributes appear
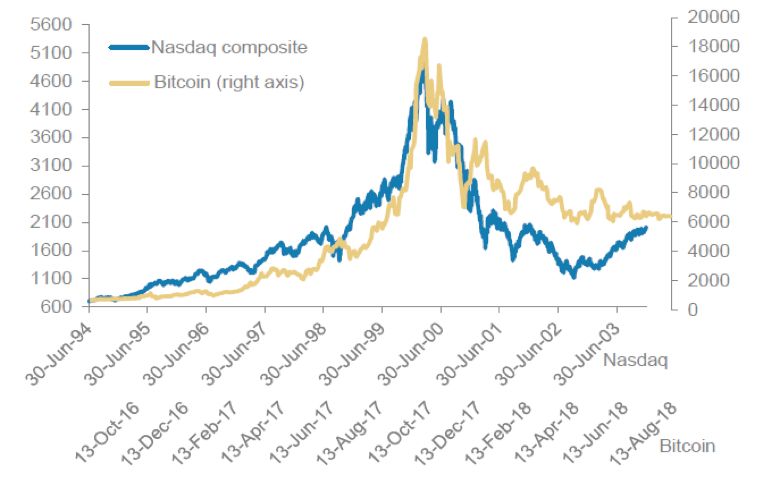
Figure 17 Comparison of 1994-2003 NASDAQ and 2017-2018 Bitcoin Price
Source: MorganStanley 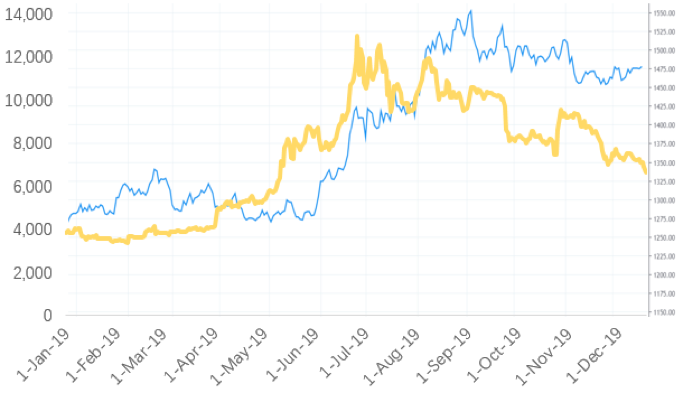
Figure 18 Comparison of gold and Bitcoin prices in 2019
Source: BlockVC Research
The Nasdaq index's bursting of the Internet bubble in 1994-2003 and the burst of ICO bubble in crypto assets in 2017-2018 are almost the same. After the market returned to rationality, the Nasdaq opened a decade-long bull in 2009, and the price of Bitcoin in 2019 After that, it rose slowly, and the trend gradually converged with gold;
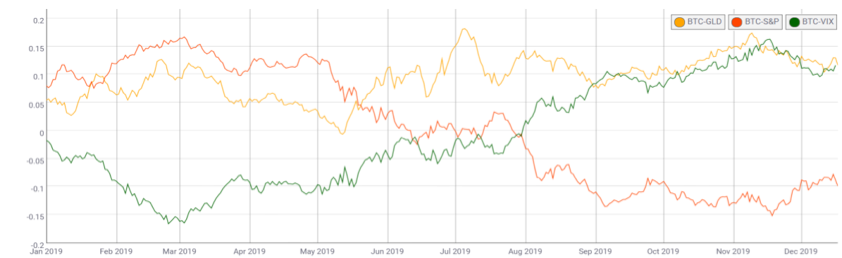
Source: Coinmetrics
Comparing Bitcoin with traditional asset returns, Bitcoin's correlation with the S & P index has continued to decline to a negative number in 2019, its correlation with gold has improved, and its correlation with the volatility index VIX has continued to rise; combined with 2019 Judging from the trend of Bitcoin and gold, the asset properties of Bitcoin are transformed from risky assets to risk-averse assets. Under the circumstances of increasing market volatility, it is possible to realize the hedging effect of traditional risk assets by investing in Bitcoin or gold.
2.4 Increased precipitation of head exchanges makes it difficult for emerging exchanges to break the situation
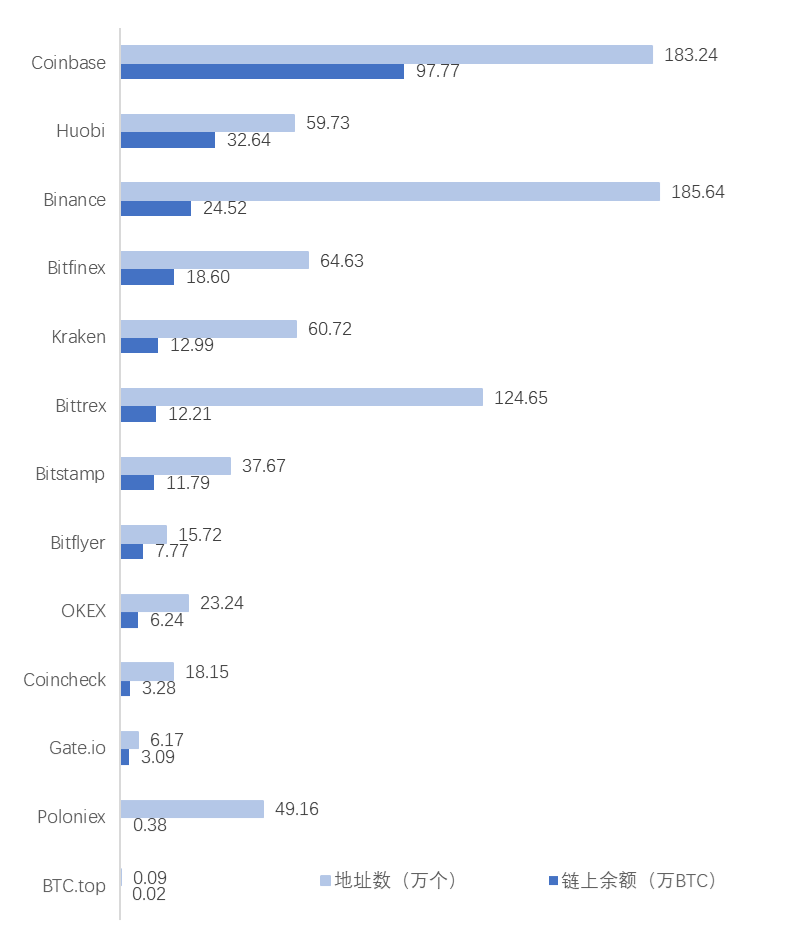
Figure 20 The balance and number of addresses on the BTC chain of major spot exchanges
Source: BlockVC Research
Figure 20 shows the number of on-chain addresses and the balance of BTC on the main spot exchanges. It can be seen that the head exchanges dominated by Coinbase, Huobi, and Binance have deposited a large number of crypto assets, including Coinbase (including The balance of the BTC chain of its hosting platform Xapo) has reached 5% of the total supply of BTC.
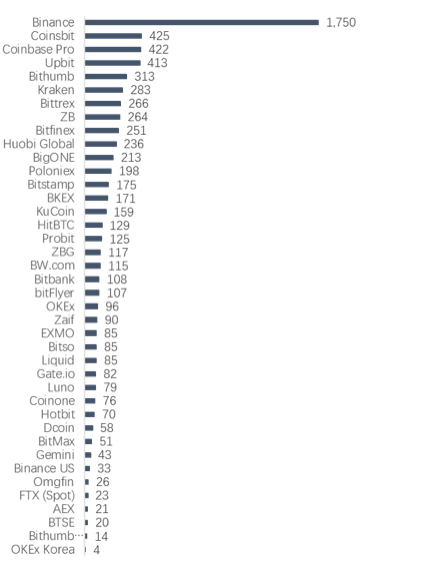
Figure 21 Exchange Visits Source: BlockVC Research
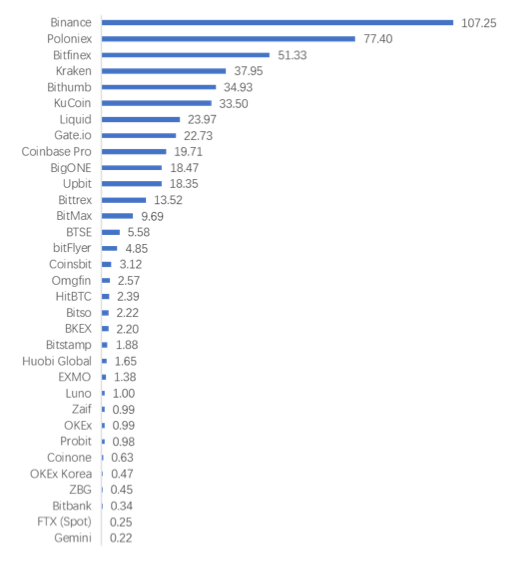
Figure 22 Twitter followers Source: BlockVC Research
In terms of user base, head exchanges have far more website visits and social media followers than other exchanges; in terms of stock user diversion and new user accumulation, it is difficult for emerging exchanges to break through.
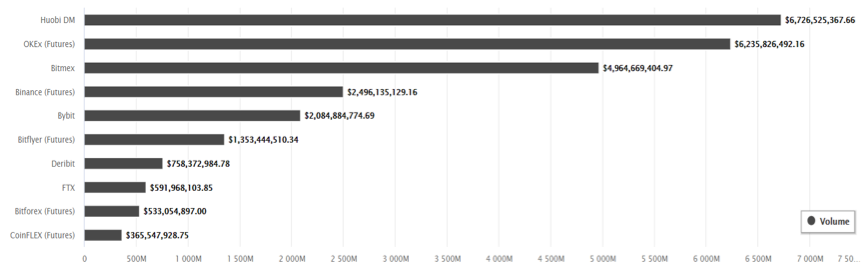
Figure 23 24h trading volume of derivatives exchanges
Source: Coingecko
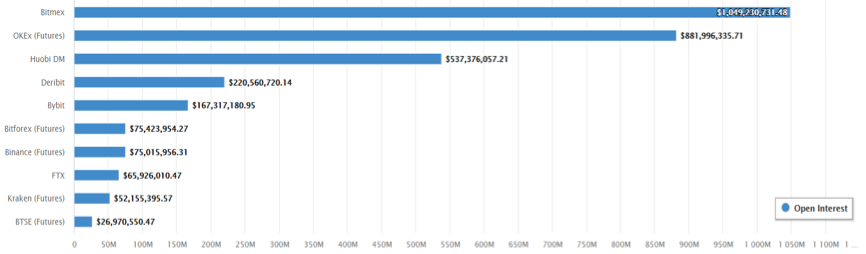
Figure 24 24h open interest statistics on derivatives exchanges
Source: Coingecko
In 2019, major exchanges focus on the layout of derivatives and OTC circuits. From the perspective of holdings and trading data, Bitmex, Huobi DM, and OKEX are leading in the derivatives trading market;
Huobi has accumulated a large number of users in the past few years with a convenient OTC experience. At the end of 18, Huobi DM, a delivery contract trading zone, was opened. Due to the diversion of the original spot users, the transaction volume and transaction depth later came to the top;
Binance opened the USDT forward perpetual contract after acquiring JEX in September 2019, opened OTC business in October, and expanded the profit model;
Deribit focuses on multi-variety derivatives and gives priority to options trading; FTX attracts users with multi-type index products and good market depth. It was invested by Binance on December 20, 2019 to jointly develop derivatives competitions Road.
3. Outlook
3.1 Resonance of the "halving market" and the bull-bear cycle
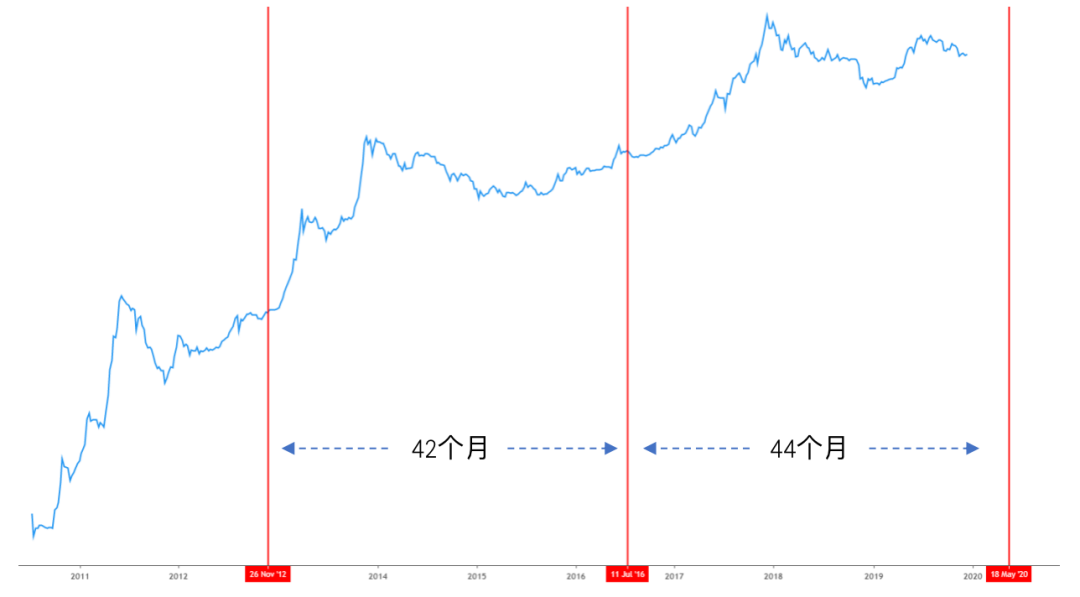
Figure 25 Bitcoin's Historical Price Trend and Halving Review
Source: BlockVC Research
Bitcoin history has experienced two halvings of output, and the halving in the time dimension is in the main rising wave of the bitcoin bull market. Volatility is often accompanied by short-term amplification before and after halving;
From the point of view of the characteristics of constant volume and non-interest bearing, Bitcoin has the characteristics of commodities. According to the theory of supply and demand that determines the price of commodities, halving will cause a huge reduction in the daily supply of Bitcoin, and the leftward shift of the supply curve will cause Bitcoin. Price increased;
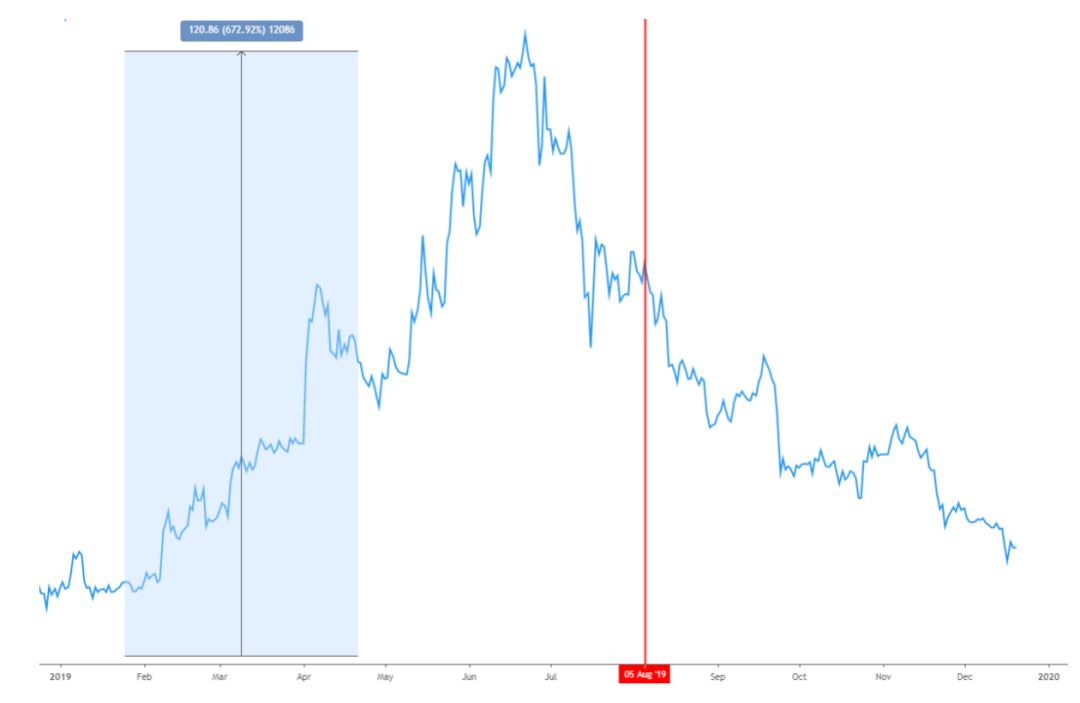
Figure 26 Trend of Litecoin in 2019
Source: BlockVC Research
Observing the trend of Litecoin, it can be found that Litecoin, which reduced production in August 2019, recorded a maximum increase of 537% in 2019, and there were huge price fluctuations and changes in computing power before and after halving, to a certain extent, next year's bitcoin. Coins were halved for a rehearsal. After two years of decline cycles in 2018 and 2019, the halving stack of multiple currencies in 2020 has also formed a stronger bullish expectation in the market.
3.2 Unilateral Rising Computing Power and Fanatic Mining Machine Sales
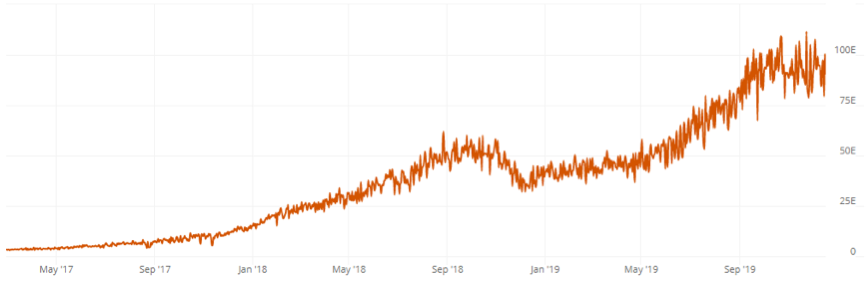
Figure 27 The historical hashrate growth of the Bitcoin network
Source: www.blockchain.com
The overall hashrate of Bitcoin's entire network has maintained a steady growth, and has been less affected by the bull-bear conversion of the Bitcoin price. Mining machine manufacturers have continued to add weight. In the second and third quarters of this year, cumulative sales of more than 15 billion yuan of mining machine futures;
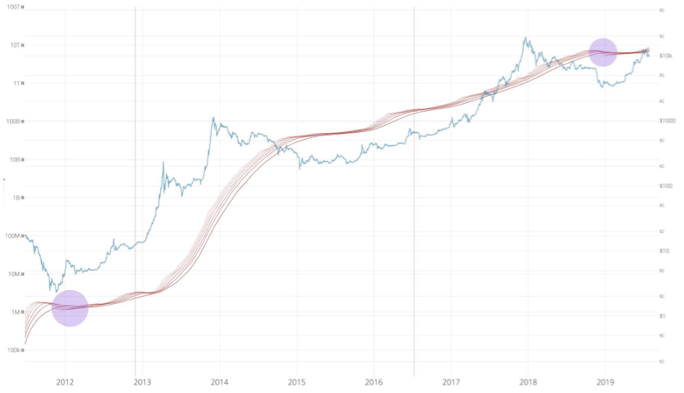
Figure 28: The Bitcoin mining difficulty moving average ribbon
Source: Woobull Chart
The bitcoin mining difficulty moving average overlapped a few months before halving, and the overlapping ranges are relatively low points in the historical price of bitcoin, and the chip swapping is obvious; The continuous investment of miner costs and power resources under the fundamentals has provided a continuous guarantee for the security and value capture of the Bitcoin network . Its increasing robustness and anti-fragility have given Bitcoin a stronger value store. Attributes.
3.3 Grasp the bottom range of long-term prices
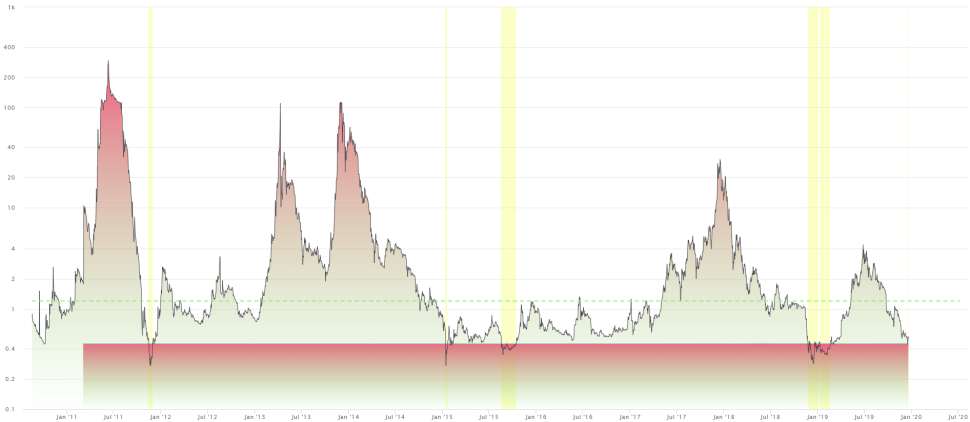
Figure 29 Summary of Bitcoin's long-term price range
Source: AHR Index
By fitting the logarithmic trend of the historical price of bitcoin and the 200-day moving average, we can get the historical low range of Bitcoin (yellow part) as shown in the figure. In these price ranges, the price of bitcoin is significantly lower than its historical trend. Expected value, there is a strong value return to expectations, the real-time price of Bitcoin is very close to the low range;
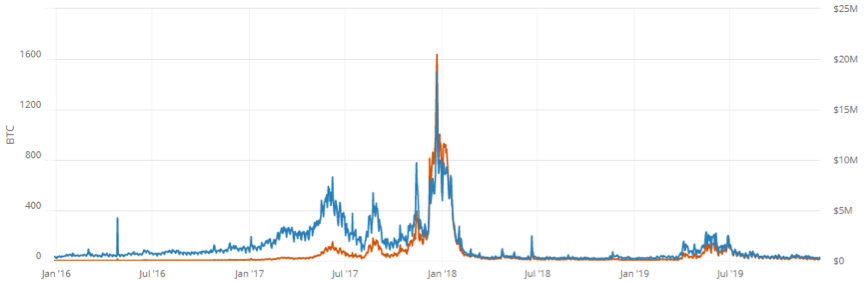
Figure 30 Bitcoin historical daily on-chain transfer fees
Source: www.blockchain.com
Bitcoin has the characteristics of a commodity currency and the possibility of being a potential value store and payment means. Looking at the transfer fees on the BTC historical chain, it can be seen that in addition to the short period of time during the peak of the bull market in 2017, Bitcoin has temporarily carried a large number of functions of value transfer, and the on-chain transfer fees are regarded as the net profit of the Bitcoin system. There is still huge room for profit growth and massive markets are waiting to be occupied;
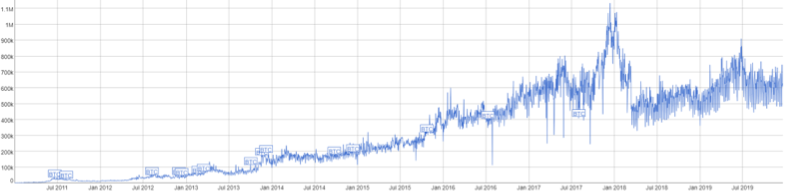 Figure 31 Number of active Bitcoin network addresses
Source: www.blockchain.com
The price of bitcoin is affected by the tightness of global capital market liquidity in the short term. It depends on the number of people covered by the bitcoin network for a long time. The number of active addresses on the bitcoin network has been increasing organically for a long time. Therefore, the expected price of bitcoin should also be in the range of long-term rise. .
3.4 Undercurrent surge in exchange pattern changes
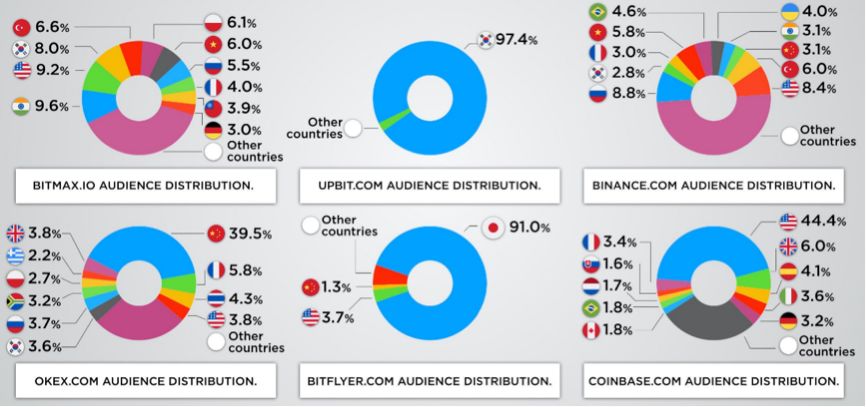 Figure 32 Composition of user countries by exchange
Source: ICO Analytics
Asian background exchanges have difficulty entering the mainstream legal currency compliance markets in Europe and the United States, and exchanges in various regions still have obvious first-mover advantages and geographical characteristics. Huobi North America ’s strategic partner HBUS will cease operations in December 2019; Binance US Station Binance US liquidity is subject to rickets.
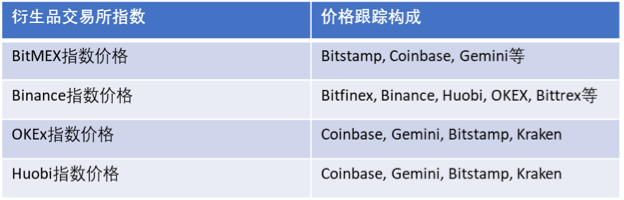 Figure 33 Derivatives Exchange Index Price Composition
Source: BlockVC Research
It can be observed from the composition of the price indices of the major derivatives exchanges that the main source of data comes from European and American fiat exchanges, and the mainstream asset pricing power is firmly controlled by European and American fiat exchanges.
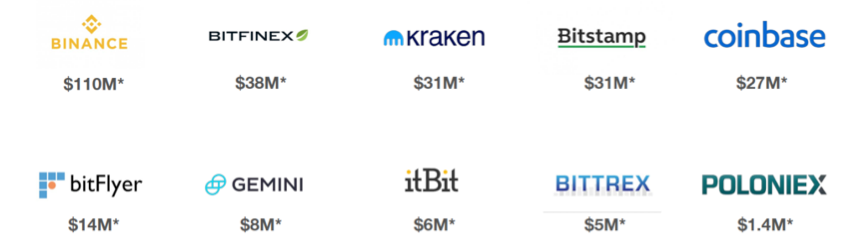
Figure 34 Bitwise rated exchanges with real trading volume
Source: Bitwise Report
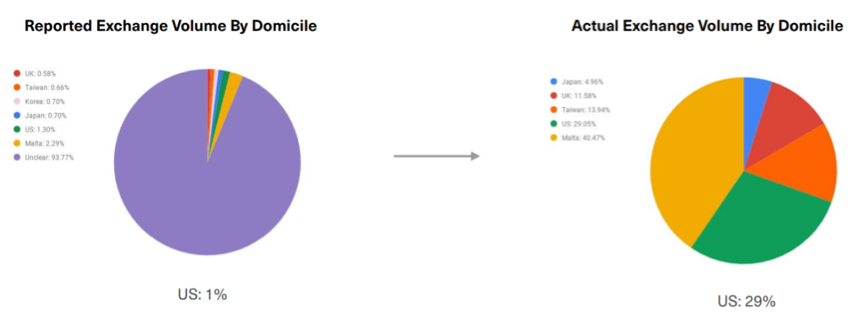 Figure 35 Bitwise's assessment of transaction volume composition with real transaction volume
Source: Bitwise Report
Comparing the reported trading volume of various major exchanges with the real trading volume, the contribution of the trading volume mainly comes from Binance and mainstream European and American fiat currency exchanges, while China's non-first-tier exchanges generally suffer from serious fraud.
Taken together, the crowding-out effect of crypto asset exchanges will become more apparent in 2019. Under the dual pressure of security events and regulatory policies, transaction volume and users are increasingly concentrated on head trading platforms, and the survival space of small and medium-sized exchanges is increasing. Small; emerging exchanges often use derivatives as a means of breaking the game, while providing users with a more complete category of investment targets while improving the maturity of the crypto asset trading market, such new platforms also have relatively bright performance in equity valuation; Among the existing competitions, the established European and American fiat currency exchanges have taken the initiative in pricing crypto assets with their stable fiat currency channels and regulatory adaptability. They still hold a majority of the mature trading market, and the internationalization of Asian background exchanges is relatively lacking.
3.5 Paradigm shift of global macro economy, opportunities and challenges coexist
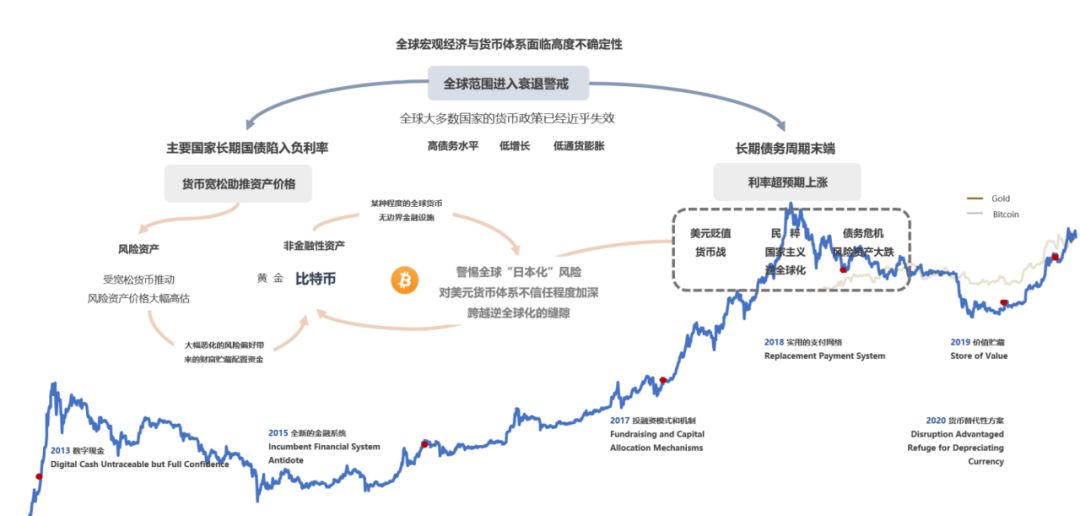 Figure 36 Paradigm shift of macroeconomics and attribute transfer of crypto assets
Source: BlockVC Research
In the context of the "paradigm shift", macro uncertainty is still the long-term main factor driving the market: as the U.S. debt yield curve ends "upside down", the cloud of seemingly recession is temporarily away from the world economy, but it is undeniable that At present, the monetary authorities of most developed economies in the world have been unable to carry out effective monetary policy control. Most of the country ’s economy has fallen into the embarrassing situation of high debt levels, low economic growth rates, lower inflation and even deflation. Extreme pessimism and the failure of monetary policy, the long-term national debt of major countries have fallen into negative interest rates, and this will also lead to a certain degree of currency easing and thus push up the price of risky assets. The degree of liquidity is loose. As a "commodity currency" with obvious risk attributes, its price has a macro-level rising momentum. On the other hand, from the perspective of long-term economic cycles and debt cycles, the world economy and the total debt level Is at the end of the long-term debt cycle, and may trigger a new debt crisis in the next few years With the rise of populism and uncertainty worldwide, Bitcoin will also gain a certain allocation possibility as an alternative asset in terms of hedging properties.
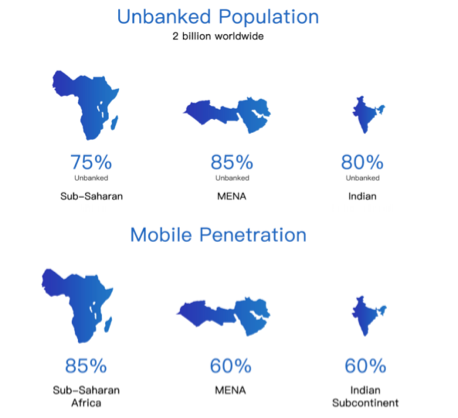
Figure 37 Bank and mobile coverage
Source: BlockVC Research
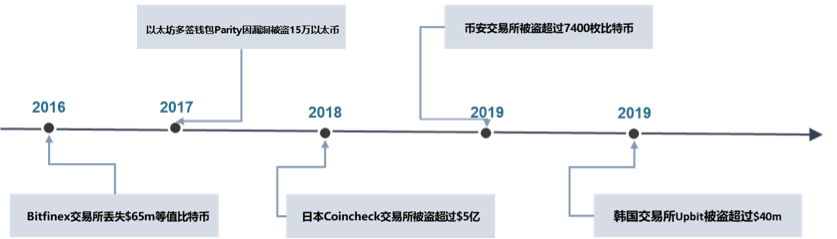
Figure 38 Sorting out the exchange theft
Source: BlockVC Research
There are still many problems in the crypto asset industry, leaving practitioners with a huge blue ocean market and competitive opportunities: there are billions of people worldwide who have not yet access to banking systems and smartphones, which will definitely be represented by blockchain technology. The new generation of fintech has left a huge penetration space and a blank market; the regulatory frameworks at the sovereign level of various countries are still not perfect, and there are huge cross-regional arbitrage opportunities in crypto asset trading and financial services and the survival of emerging and actively regulated exchanges. There is still huge room for improvement in international value circulation and financial freedom and market value is waiting to be tapped. Blockchain technology and encrypted digital currencies will increasingly carry economic and social operations in the next decade, complementing traditional finance. .
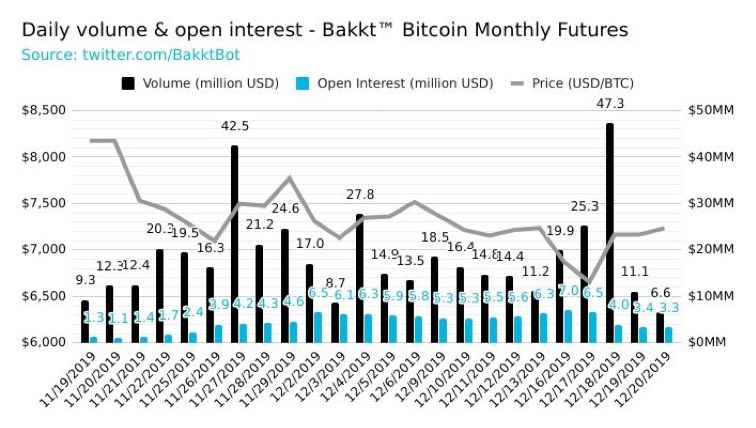 Figure 39 Bakkt daily trading volume and position data
Source: BlockVC Research
The four necessary infrastructures for crypto assets to fully enter the mainstream need to be further developed:
Compliance trading platform: The current crypto asset exchange ecosystem has not yet emerged with sufficient liquidity and sufficient infrastructure for investment trading venues, and institutional investors still lack a compliant entry channel;
Compliance custody: The custody mechanism has not been fully introduced into the crypto asset management industry, and traditional funds are still unfamiliar and exclusive in concept and practice in the face of the unique security and complexity of crypto assets;
Securities digital assets: STO use cases are scarce and the cost is high worldwide, the scale of fundraising is limited, and the scope of circulation and unlocking time are not friendly to ordinary investors; Stablecoin: Sovereign entities and giant Internet business entities are leading fierce competition, and the stablecoin battle will be in the "one super and many strong" division for a long time.
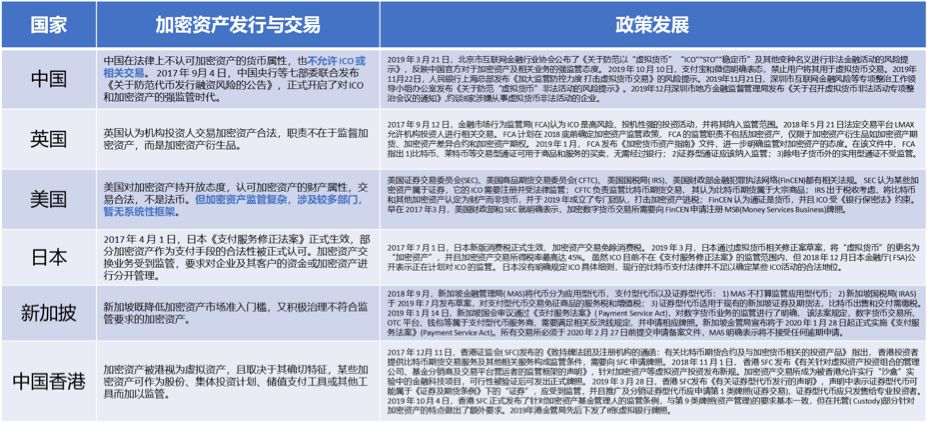 Figure 40 Overview of global crypto asset regulatory policies
Source: BlockVC Research
4.Conclusion
The crypto asset industry is constantly rotating and iterating at several times the speed of the traditional financial cycle. After experiencing a quiet downturn and a restless carnival, the wheel of history is still moving forward, and the industry's pace has never stopped. With the support and popularity of blockchain technology in various countries and regions, the crypto asset industry has gradually entered the mainstream, and compliance, implementation and innovation will definitely become the theme of the future. Looking up at the current on the river bed, facing the new bull-bear cycle of 2020, waiting for us is not only a halving of digital currency production, but also challenges and opportunities again and again.
We will continue to update Blocking; if you have any questions or suggestions, please contact us!
Was this article helpful?
93 out of 132 found this helpful
Related articles
- Liquidators: How to make a huge profit on DeFi
- Will the cash between Alipay and WeChat disappear due to the central bank's digital currency?
- Cryptocurrency money laundering analysis: how criminals will transfer billions of dollars in 2019
- Crypto asset service provider Keystore secures $ 10 million in funding, led by Jianyuan Fund, distributed capital follow-up
- 8 asked videos | Conflux Long Fan: Only by reducing the interaction cost with the public chain will there be more applications
- Blockchain speed in Zhejiang: bid farewell to 100 million paper notes in 6 months
- First | Ant Blockchain Engineer Readme: Using Blockchain to Realize Cross-City Metro Subway Codes