Analysis and Commentary: The Fate of Bitcoin ETFs and Cryptocurrency Performance
Exciting Crypto Market Uptrend Suddenly Stopped by Report, Shaking Traders' Confidence. Should We Buy the Dip?Price analysis of 10 cryptocurrencies BTC, ETH, BNB, SOL, XRP, ADA, AVAX, DOGE, DOT, MATIC
Introduction
Bitcoin (BTC) experienced a downturn on January 3rd, causing concerns among investors regarding the fate of spot Bitcoin exchange-traded funds (ETFs) applications. This downward trend was largely attributed to a report from Matrixport, a crypto financial services platform, which speculated on the denial of Bitcoin ETFs. However, it is important to note that this report lacks concrete evidence for the potential rejection. On the other hand, Bloomberg ETF analyst, James Seyffart, maintains a 90% approval odds for the ETFs by January 10th.
The Market’s Response
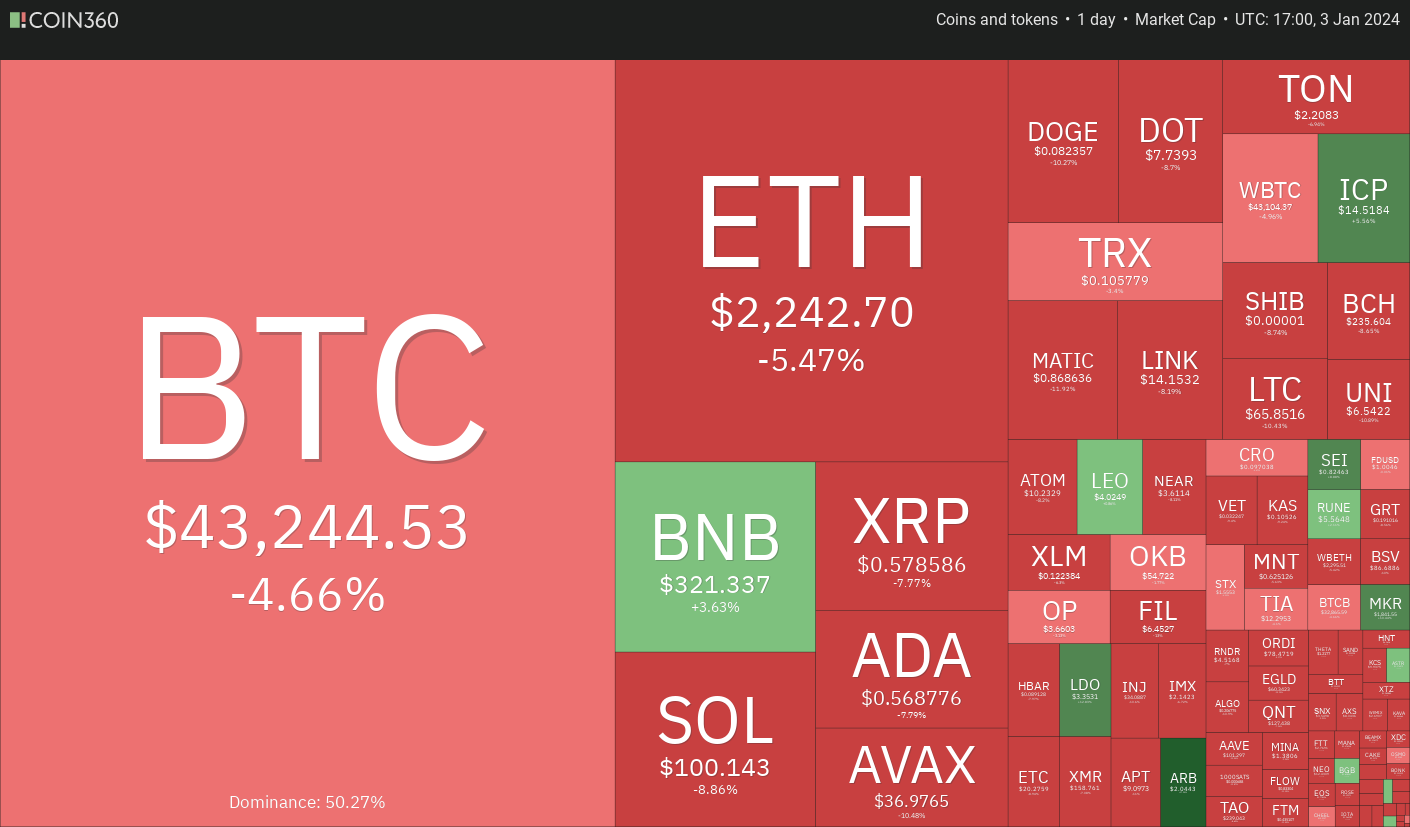 Daily cryptocurrency market performance. Source: Coin360
While this decline may temporarily dampen bullish sentiment, it does not alter the overall upward trend. Market observers continue to closely monitor regulatory developments, and any positive news regarding the approval of Bitcoin ETFs could trigger a significant reversal to the upside.
Bitcoin Price Analysis
Bitcoin initially broke above the resistance level of $44,700 on January 2nd, but the breakout turned out to be a bull trap as the price plunged on January 3rd.
- Bitcoin Creates Millionaires: Wallets Soar by 300%
- Binance Supports Zilliqa and Sei Network Upgrades: Smooth Transitions and New Memes Trading Game!
- 💰 Circle’s USDC Stablecoin Drops to $0.74 Amidst Market Sell-Off 💰
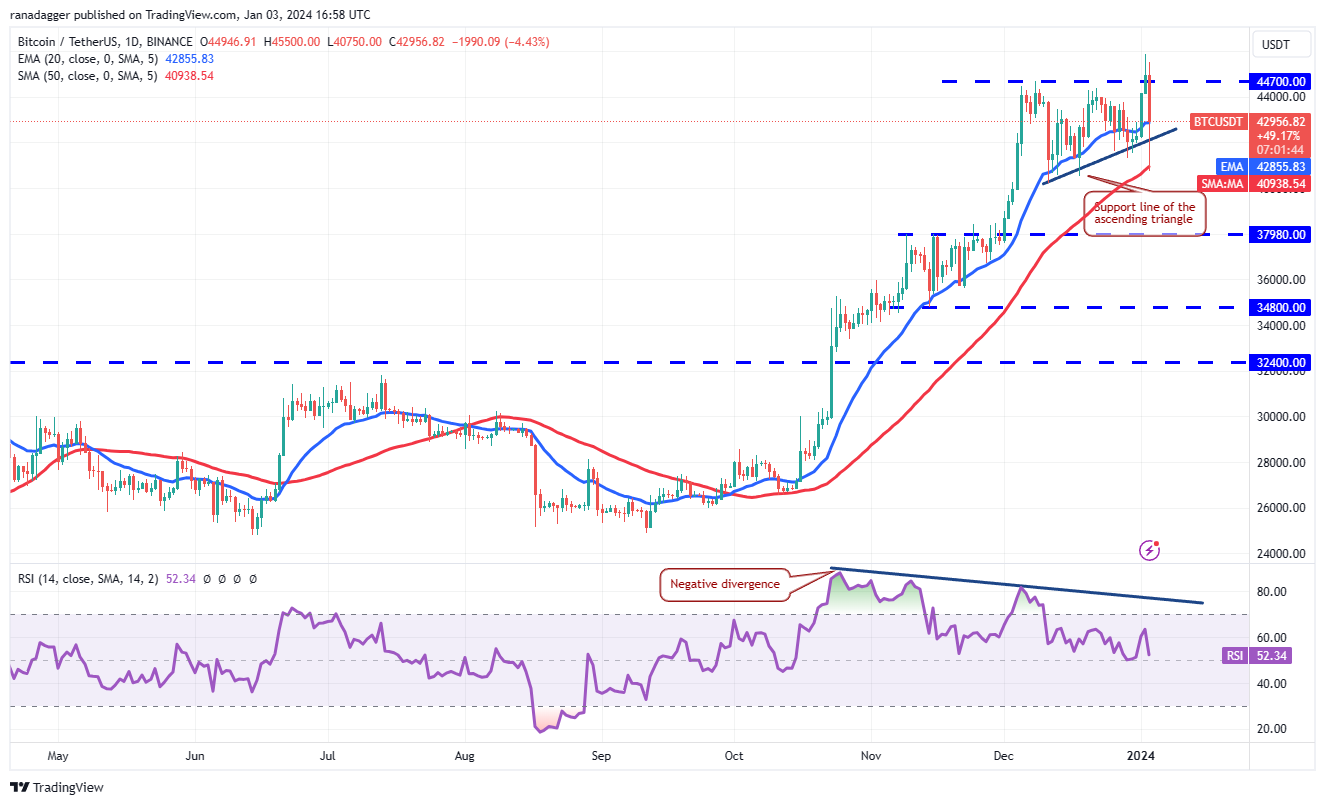 BTC/USDT daily chart. Source: TradingView
Buyers, however, stepped in to purchase the dip near the 50-day simple moving average ($40,938), indicating strong defense of the $40,000 level. The flattening 20-day exponential moving average ($42,855) and the relative strength index (RSI) hovering around the midpoint suggest a range-bound action in the near term, with potential support at $40,000 and resistance at $45,879.
A drop below the $40,000 support level would indicate a short-term bearish outlook, potentially pushing the BTC/USDT pair towards the next major support at $37,980. Conversely, a break above $45,879 would restore buyer dominance and potentially lead to a surge towards $50,000.
Ether Price Analysis
While attempting to break above the $2,445 resistance level on January 2nd, Ether (ETH) faced selling pressure, leading to a significant reversal.
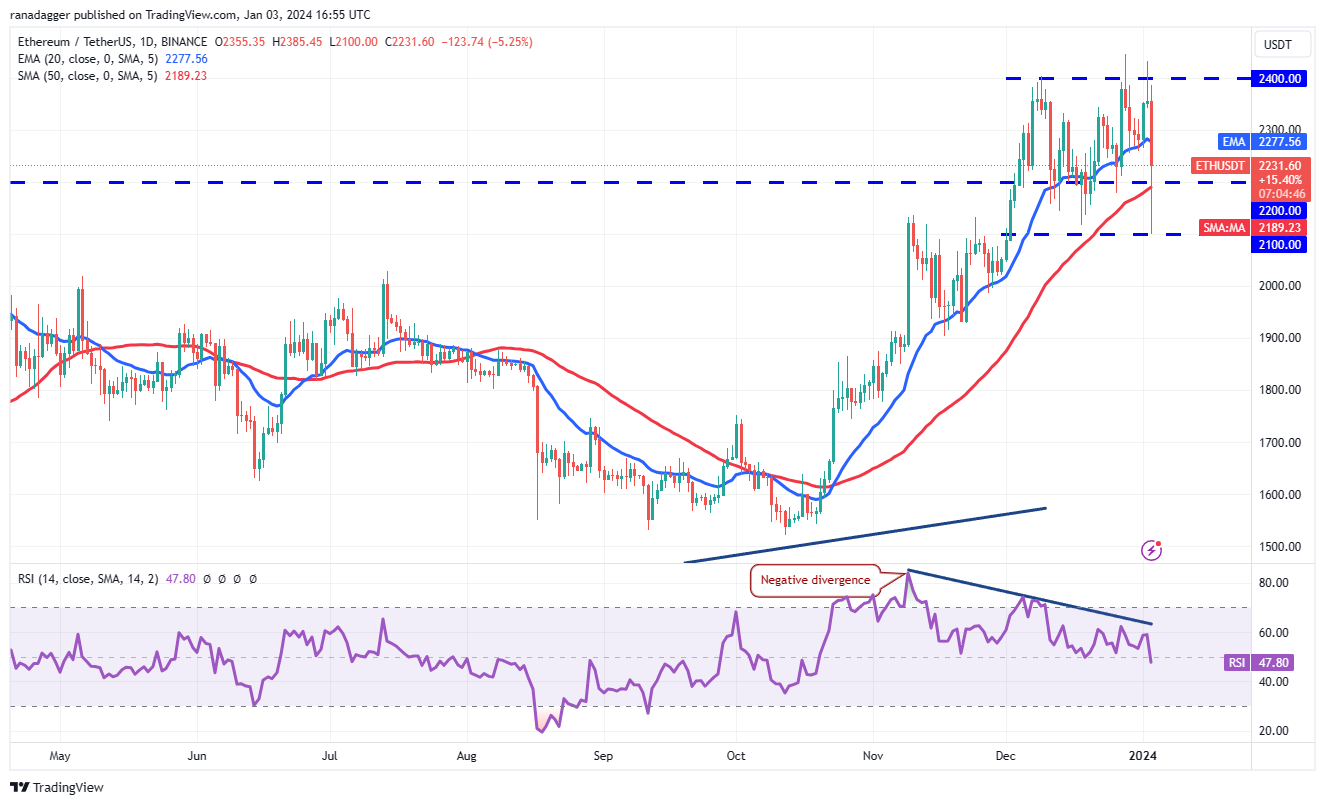 ETH/USDT daily chart. Source: TradingView
The price decline was mitigated as buyers stepped in to defend the dip at $2,100, showing their willingness to support prices above $2,200. The price action suggests a potential consolidation range between $2,100 and $2,400 in the near term. A bearish scenario would require a price slump below $2,100, potentially triggering a deeper correction towards $1,900. Conversely, a breakout above $2,445 would pave the way for a rally towards $3,000.
BNB Price Analysis
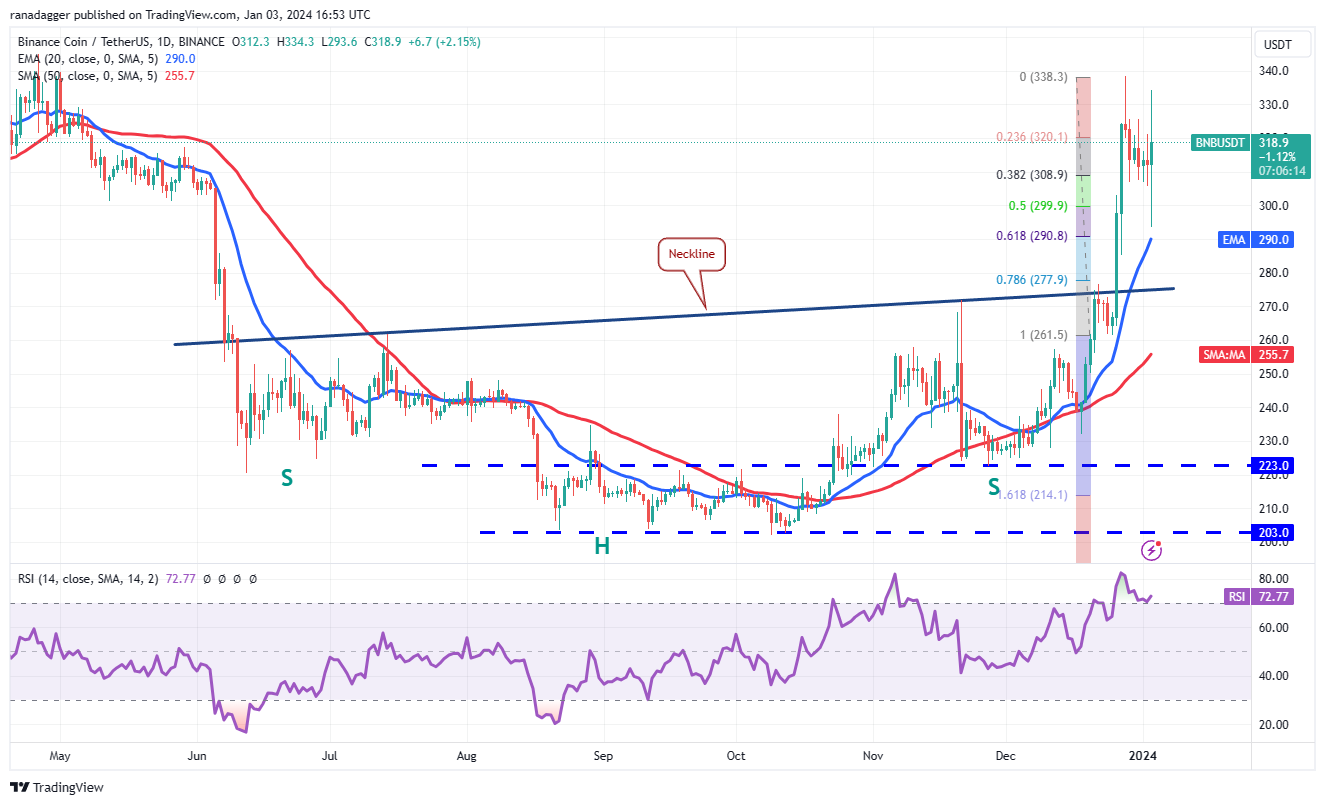
BNB attempted a rally from the 38.2% Fibonacci retracement level of $309, but encountered selling pressure towards the 61.8% retracement level of $290.
 BNB/USDT daily chart. Source: TradingView
The indecisive long wick and tail on the January 3rd candlestick demonstrate a lack of conviction from bulls and bears. The crucial level to monitor is the 20-day EMA ($290), as a break below it could trigger a retest of the neckline. The upward sloping 20-day EMA and the positive territory RSI provide a slight advantage to the bulls. If buyers successfully maintain the price above the 20-day EMA, the BNB/USDT pair might climb towards the overhead resistance at $338.
Solana Price Analysis
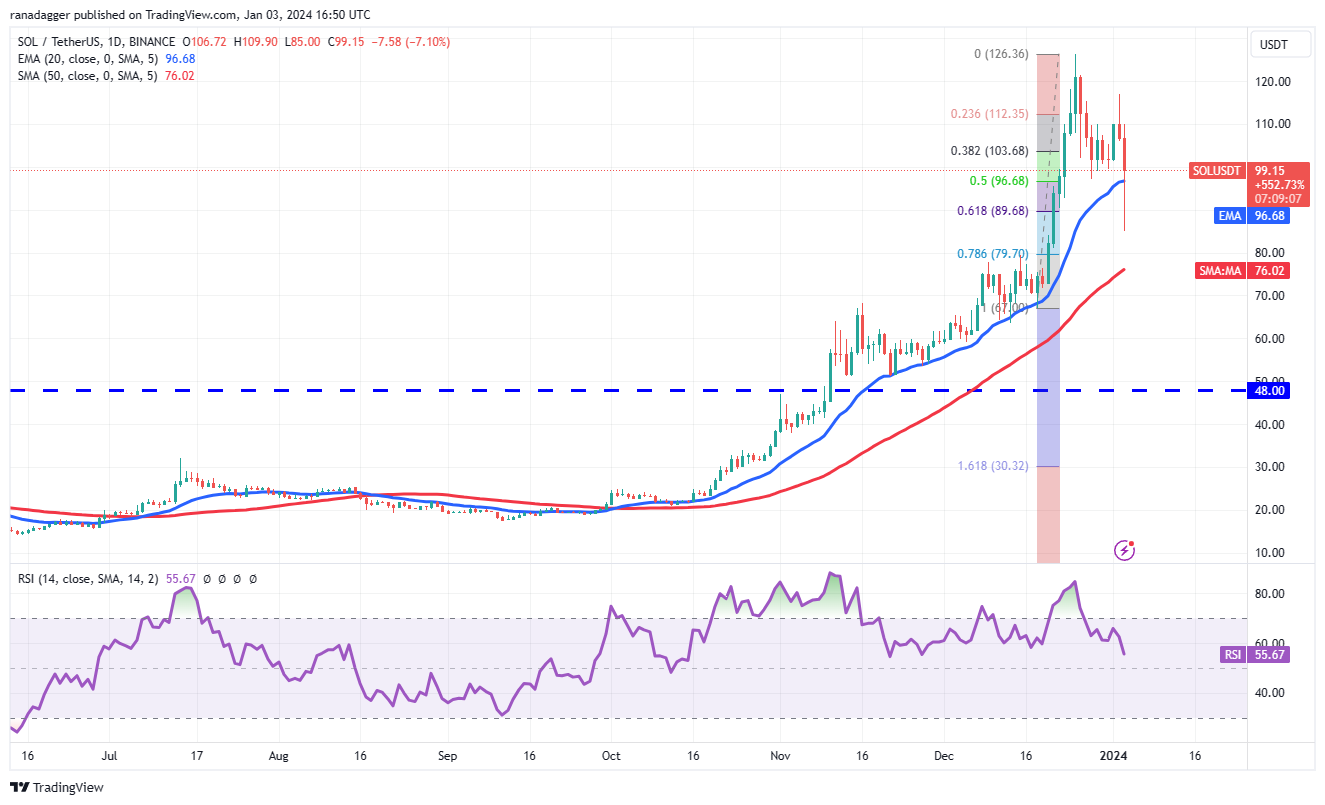
After stalling at $117, Solana’s (SOL) recovery was met with selling pressure, leading to a drop below the 20-day EMA ($96).
 SOL/USDT daily chart. Source: TradingView
If prices stay below the 20-day EMA, the SOL/USDT pair might fall towards the 50-day SMA ($76). However, if buyers successfully defend the 20-day EMA, it would indicate solid demand at lower levels and potentially trigger a rally towards the $117 to $126 resistance zone. At this level, bearish sentiment is expected to provide strong resistance.
XRP Price Analysis
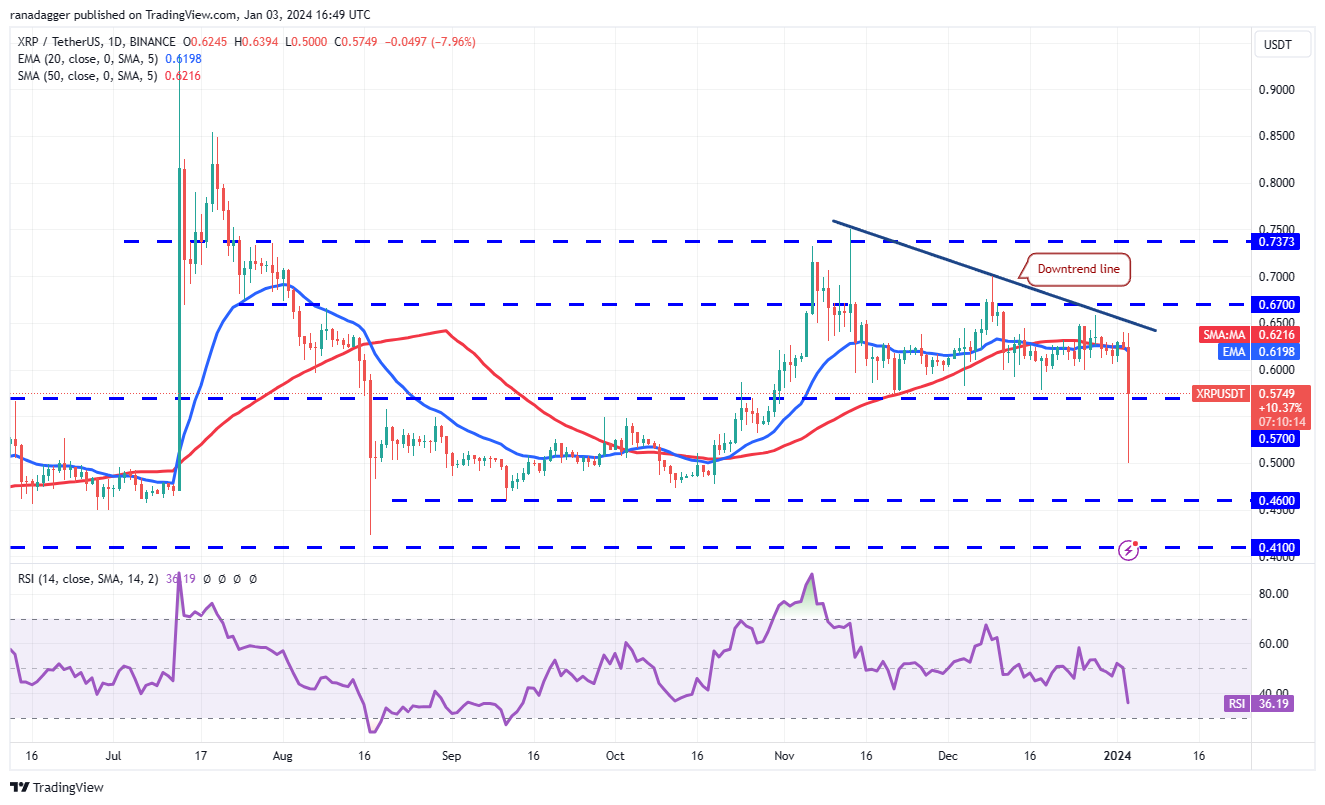
XRP has been forming a descending triangle pattern, which will be confirmed with a close below $0.57.
 XRP/USDT daily chart. Source: TradingView
Although the bears briefly dragged the price below $0.57 on January 3rd, strong buying pressure was observed, resulting in a long tail on the candlestick. A rise back above $0.57 would encourage bulls to initiate a recovery towards the downtrend line. Conversely, a sustained price below $0.57 would confirm the completion of the bearish setup, potentially leading to a decline towards $0.46 and ultimately the pivotal support level at $0.41.
Cardano Price Analysis
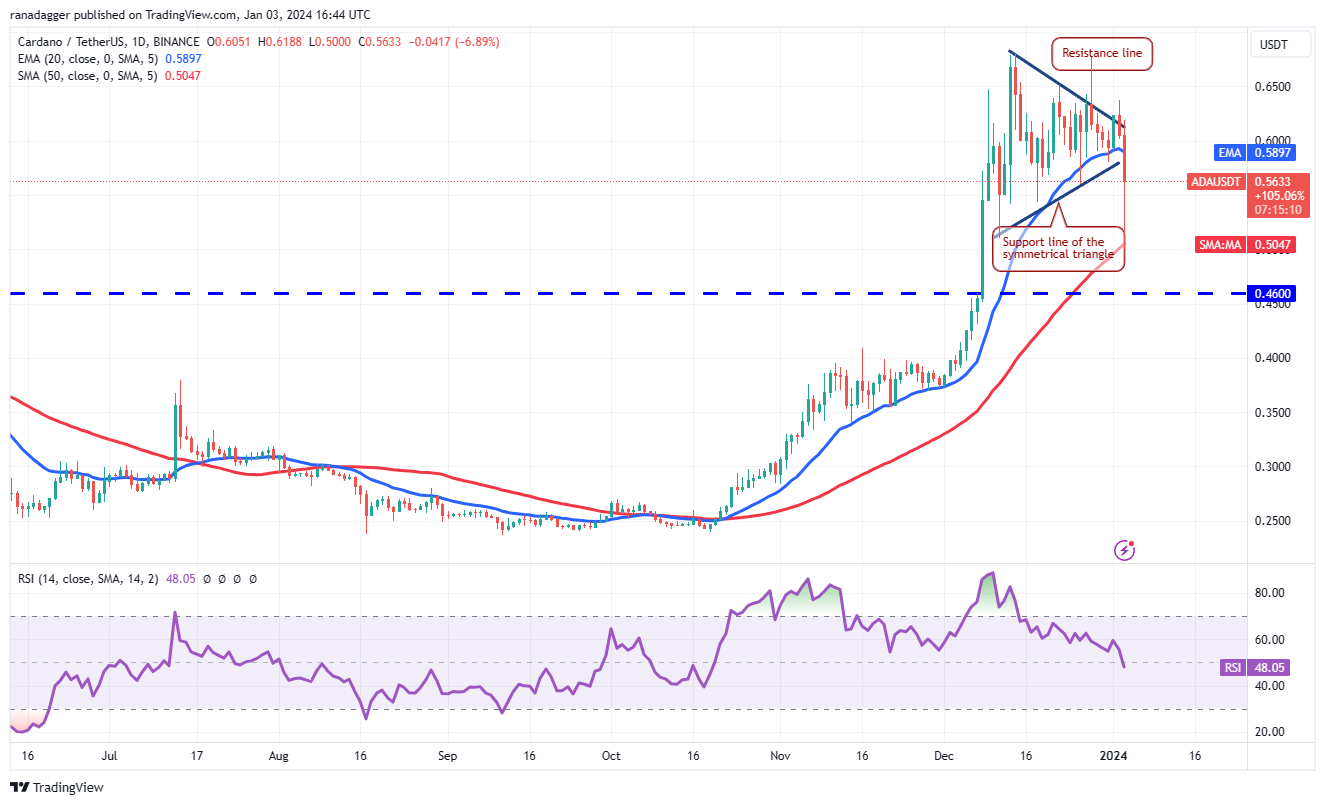
Despite an initial breakout above the symmetrical triangle pattern, Cardano (ADA) failed to sustain the momentum on January 2nd.
 ADA/USDT daily chart. Source: TradingView
Selling pressure intensified on January 3rd as bears pushed the price below the triangle’s support line. However, solid buying activity at lower levels quickly emerged, resulting in a long tail on the candlestick. Any recovery attempt is expected to face selling pressure at the 20-day EMA ($0.59). A reversal from this level would signal a change in sentiment, with buying on dips transitioning to selling on rallies. Consequently, the 50-day SMA ($0.50) could be at risk of a breakdown, potentially pushing the pair towards $0.46. Alternatively, a rally above $0.64 would improve the chances of a break above the overhead resistance at $0.68.
Avalance Price Analysis
Although attempting a recovery from the 38.2% Fibonacci retracement level of $309, Avalanche (AVAX) faced aggressive selling pressure, driving the price towards the 61.8% retracement level of $290.
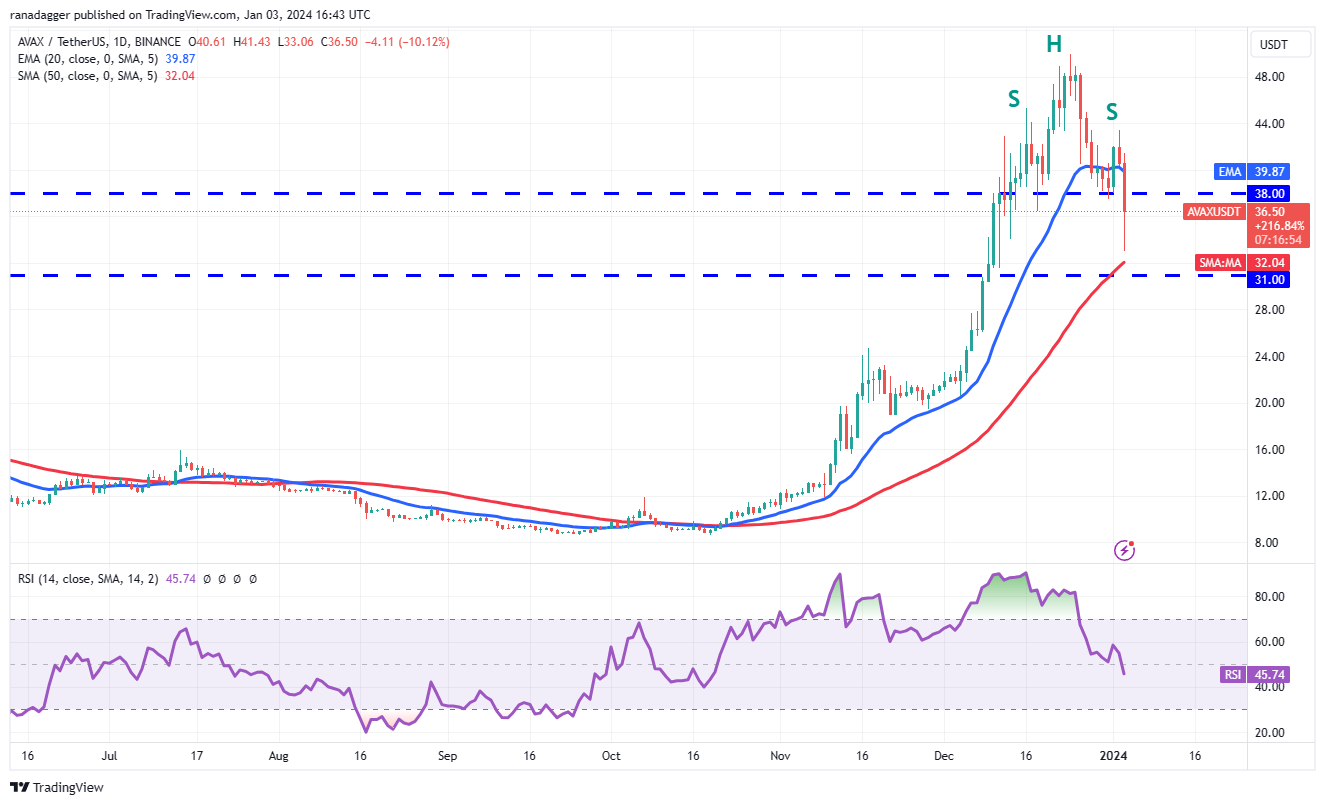 AVAX/USDT daily chart. Source: TradingView
The long wick and tail on the January 3rd candlestick demonstrate indecision among bulls and bears. The 20-day EMA remains a critical level, with a break below it potentially triggering a retest of the neckline. Nonetheless, the upward slope of the 20-day EMA and the positive RSI suggest an advantage for the bulls. If buyers can maintain the price above the 20-day EMA, the AVAX/USDT pair might climb towards the overhead resistance at $338.
Dogecoin Price Analysis
Dogecoin’s support near the 50-day SMA ($0.09) was breached on January 3rd, indicating a shift in favor of the bears.
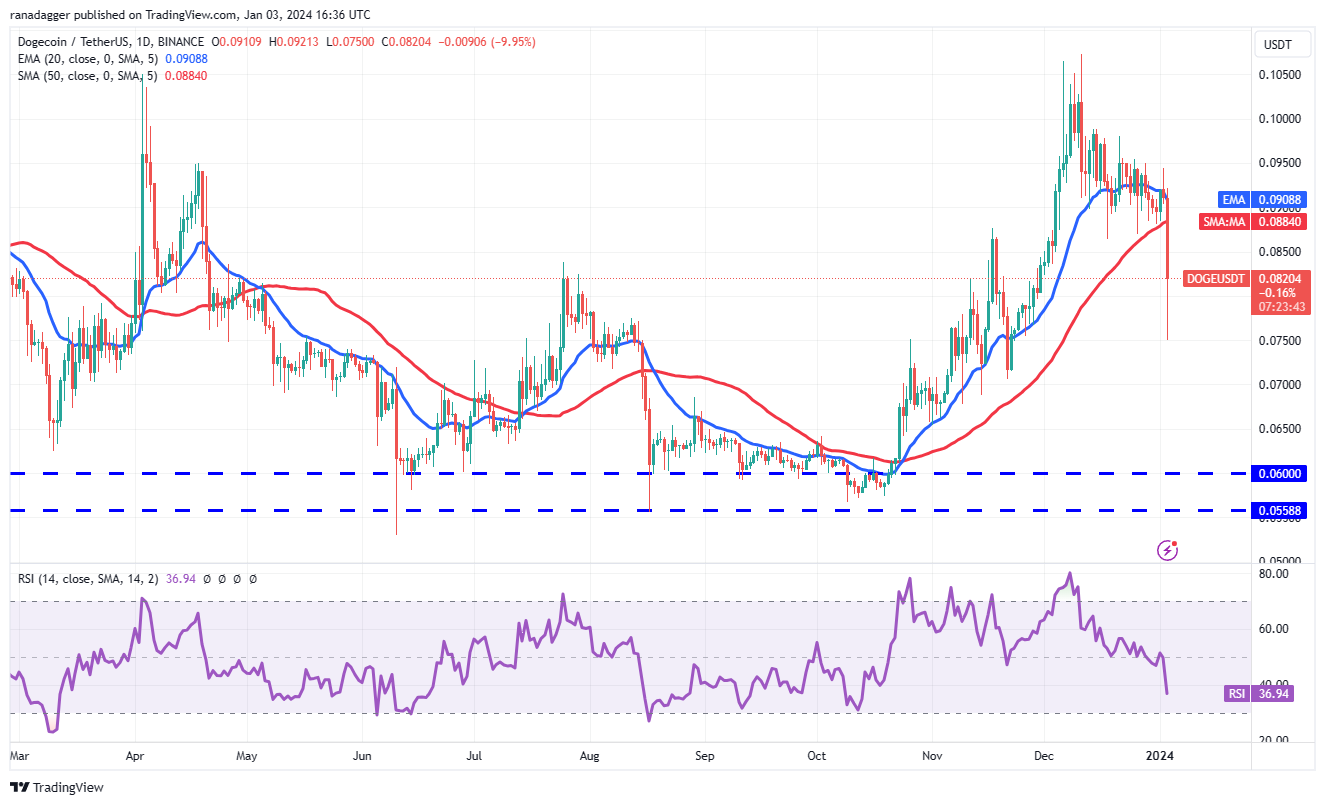 DOGE/USDT daily chart. Source: TradingView
Although the bulls are attempting a relief rally, they are likely to face strong selling pressure at the 20-day EMA ($0.09). A failed recovery from this level could result in a descent towards $0.07, with potential further downside towards $0.06 if the bears maintain dominance. To signal the start of the next leg of the uptrend towards $0.16, bulls need to push and hold the price above the $0.10 to $0.11 resistance zone.
Polkadot Price Analysis
Polkadot (DOT) experienced a rebound from the critical support level of $7.90 on January 1st, but failed to sustain higher levels.
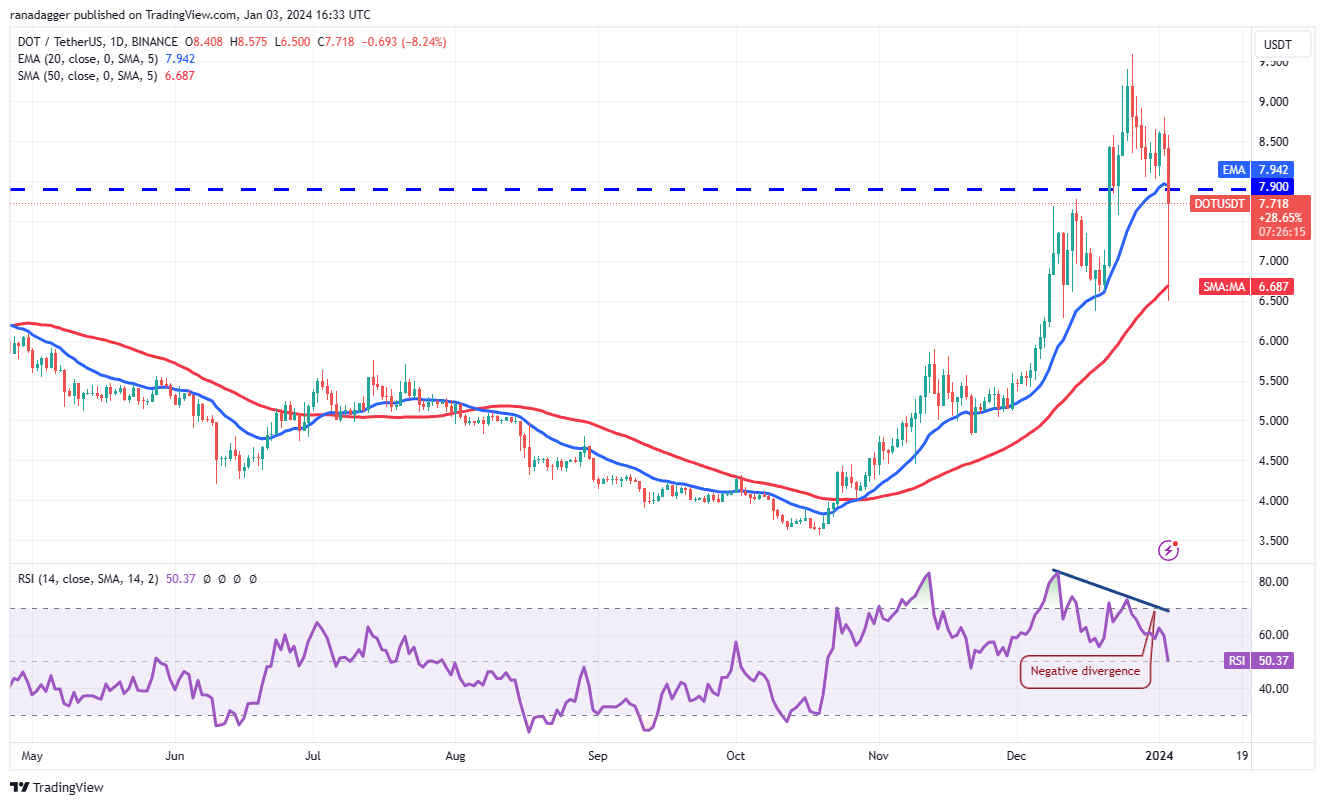 DOT/USDT daily chart. Source: TradingView
The price reversed direction on January 3rd and broke below the formidable support at $7.90. This triggered intensified selling pressure, causing the DOT/USDT pair to collapse to $6.50. However, the bulls aggressively bought the dip, resulting in a long tail on the candlestick. The 20-day EMA ($7.94) is expected to act as strong resistance; a breakout above this level could lead to a jump towards $8.80. Conversely, if the price remains below the 20-day EMA, a retest of $6.50 becomes more likely.
Polygon Price Analysis
Polygon (MATIC) briefly rose above the overhead resistance at $1 on January 1st, but failed to sustain the breakout.
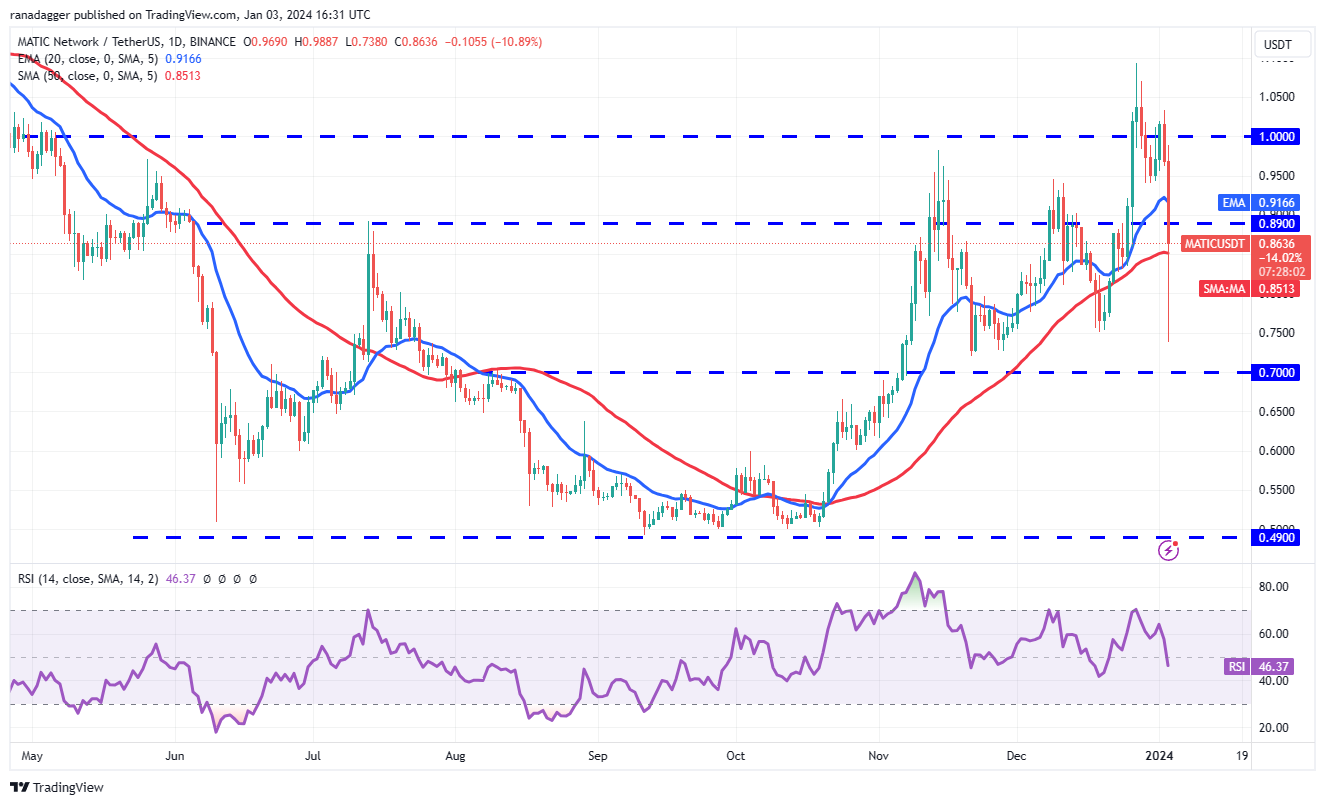 MATIC/USDT daily chart. Source: TradingView
The price subsequently declined and fell below $1 on January 2nd. On January 3rd, the MATIC/USDT pair witnessed a massive fall, plunging to $0.74. This sharp decline suggests that the pair remains range-bound between $0.75 and $1 for the time being. Buyers will need to drive the price above the 20-day EMA ($0.91) to alleviate selling pressures and potentially initiate a rally towards $1. Conversely, if the price remains below the 50-day SMA ($0.85), the pair may slide down to $0.70.
Q&A Content
Q: What are the main reasons behind the recent decline in Bitcoin and altcoins?
A: The declining trend in Bitcoin and altcoins can be attributed to market nervousness surrounding the fate of spot Bitcoin exchange-traded funds (ETFs) applications. Although the decline cools down bullish sentiment in the short term, the prevailing trend remains intact. Investors should closely monitor regulatory developments and any positive news regarding ETF approvals, as they could potentially trigger a sharp reversal to the upside.
Q: What are the support and resistance levels to watch out for in Bitcoin?
A: Currently, the $40,000 level serves as a crucial support level for Bitcoin. If the price plummets below this support, it may suggest a short-term bearish outlook, potentially leading to a further decline towards the next major support at $37,980. On the upside, a decisive breakthrough above $45,879 would indicate a bullish scenario, with the potential for a surge towards $50,000.
Q: Which cryptocurrency displays potential bullish signals?
A: Among the cryptocurrencies analyzed in this article, BNB (Binance Coin) exhibits some bullish signals. The upward sloping 20-day EMA, along with the positive RSI, provide a slight advantage to the bulls. If buyers can sustain the price above the 20-day EMA, the BNB/USDT pair might climb towards the overhead resistance at $338.
Q: What factors contribute to the ongoing consolidation in Ether’s price?
A: Ether is currently experiencing consolidation due to selling pressure encountered near the $2,445 resistance level. The price action suggests a potential range-bound trading pattern between $2,100 and $2,400. Buyers are attempting to hold the price above $2,200, while bears are putting pressure on prices to drop below $2,100. A breakout in either direction will likely determine the next significant move for Ether.
Future Outlook and Investment Recommendations
Considering the uncertain future of spot Bitcoin ETFs, investors should closely monitor regulatory developments and the potential approval of these ETFs. A positive outcome could serve as a catalyst for a bullish uptrend in the cryptocurrency market. However, it is important to conduct thorough research and consider diverse investment strategies before making any investment decisions.
Investors should also pay attention to overall market sentiment, upcoming events, and developments in the blockchain and financial sectors. Diversifying investments across different cryptocurrencies and digital assets can help mitigate risks and take advantage of potential growth opportunities.
In conclusion, while short-term market fluctuations may cause concern, investors need to focus on the long-term potential of blockchain technology and the digital asset market. By staying informed and making smart investment choices, investors can position themselves for success in this evolving landscape.
References
- BTC Price: $43K as Smart Money Bets Big on Bitcoin Ahead of Potential BTC ETF Approval
- Crypto Voters Provide Key Swing in the 2024 U.S. Elections, CCI Poll Shows
- Solana’s SOL Dips Over 100%, Slips Back in BNB’s Crypto-ranking
- Price Analysis – 12/27: BTC, ETH, SOL, BNB, XRP, ADA, AVAX, DOGE, DOT, MATIC
- Solana, AVAX, Helium Led Digital Assets Gains this Year: What’s Next?
📣 What are your thoughts on the current state of Bitcoin and other cryptocurrencies? Share your views and let’s discuss! 🚀🌕
Don’t forget to like, share, and follow for more exciting blockchain and financial insights. Stay informed with our latest articles by subscribing to our newsletter.
📧 Subscribe now: Newsletter Subscription
📲 Follow us on Twitter: [@CryptoInsights](https://twitter.com/CryptoInsights)
📲 Join our Telegram community: CryptoInsiders
Disclaimer: The information provided in this article does not constitute financial advice. Always do your own research and consult with a professional investment advisor before making any investment decisions.
We will continue to update Blocking; if you have any questions or suggestions, please contact us!
Was this article helpful?
93 out of 132 found this helpful
Related articles
- 🚀 The Bitcoin ETF Buzz: Is the Market Ready? 📈
- Ethereum 2024 Roadmap Revealed: The Merge, Surge, Scourge, Verge, Purge, and Splurge!
- BYD Outpaces Tesla in Electric Vehicle Production for Second Consecutive Year
- Bitcoin, the Unstoppable Technological Marvel 🚀
- 🚀 Sei Tokens Soar to New Heights in 2024 📈
- 👉 Tellor (TRB) Token Prices Skyrocket 250%, Then Plummet 70%: A Rollercoaster Ride for Traders! 🎢💥
- Perpetual Futures Funding Rates Reach Record Highs as Bitcoin Soars above $45,000 💰🚀💸