Bitcoin Faces Resistance at $52,000, Possible Pullback Ahead
Failure of Bitcoin to maintain levels above $52,000 leads to profit-taking in specific altcoins.Price analysis for various cryptocurrencies on 2/23 BTC, ETH, BNB, SOL, XRP, ADA, AVAX, DOGE, LINK, DOT
Bitcoin (BTC) has been facing strong resistance near the $52,000 level, which has increased the possibility of a short-term correction. As a result, there have been net outflows of approximately $36 million from spot Bitcoin exchange-traded funds (ETFs) on February 21. However, the bleeding stopped on February 22, with net inflows of about $251 million into the ETFs.
Analysts speculate that the markets could experience a pullback before the halving event in April. Rekt Capital, a popular trader and analyst, compared Bitcoin’s current bull phase to the bull runs of 2016 and 2020. If history repeats itself, we could see a pre-halving retrace followed by a post-halving reaccumulation period.
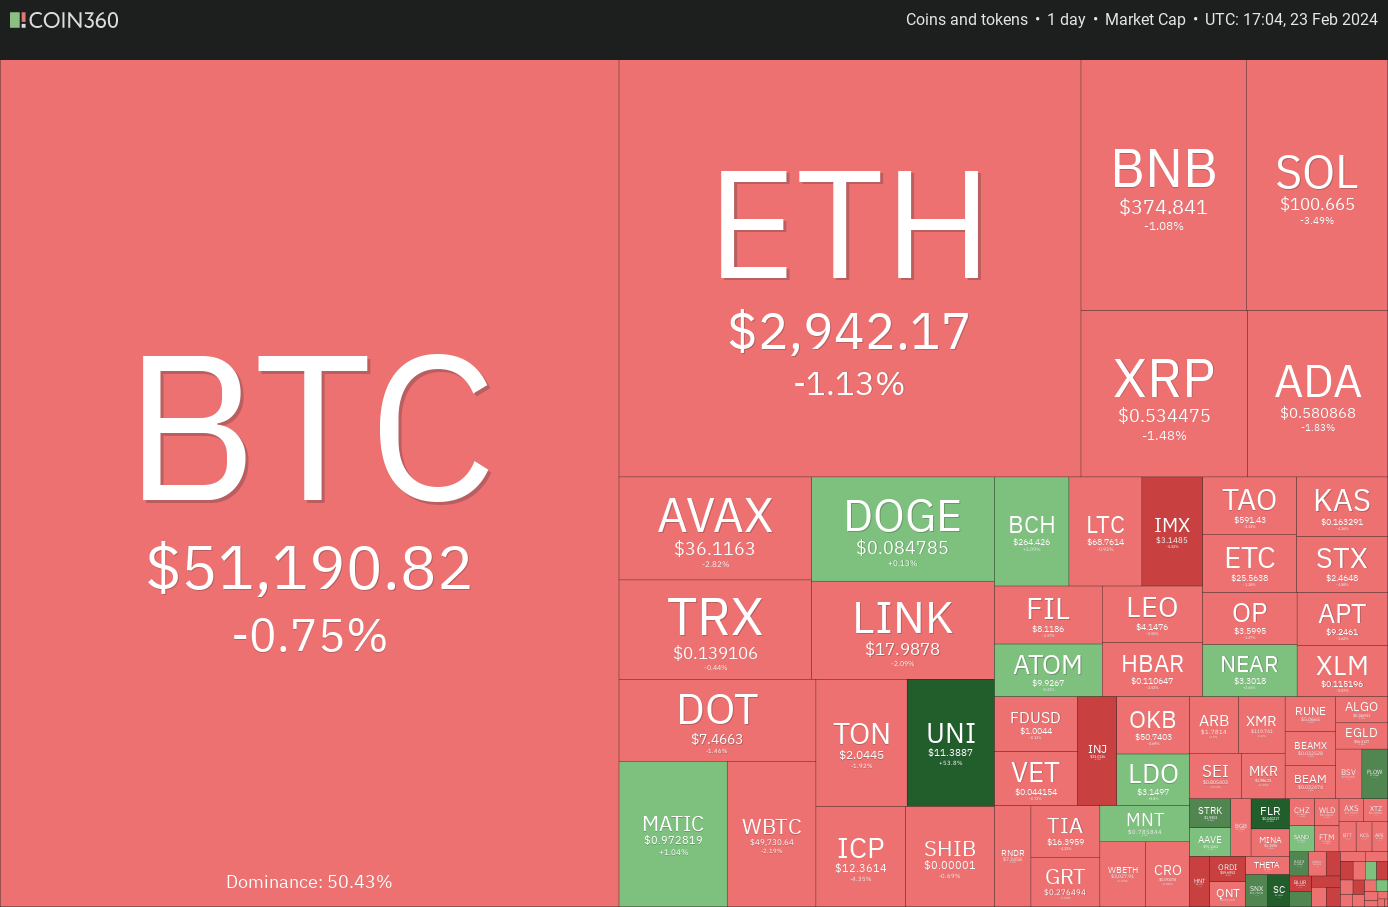 Daily cryptocurrency market performance. Source: Coin360
A corrective phase is actually positive for the long-term health of the markets as it helps shake out the weak hands and allows stronger hands to accumulate at lower levels.
- The Impending Blood Bath of Bitcoin Mining Stocks
- 🚀 Bitcoin Mining Firm Riot Platforms Reports Increase in Bitcoin Production
- Bitcoin Price Predicted to Reach $63,000: Expert Analysis and Insights
Now, let’s analyze the charts of the top 10 cryptocurrencies and identify crucial support levels to watch out for.
Bitcoin Price Analysis
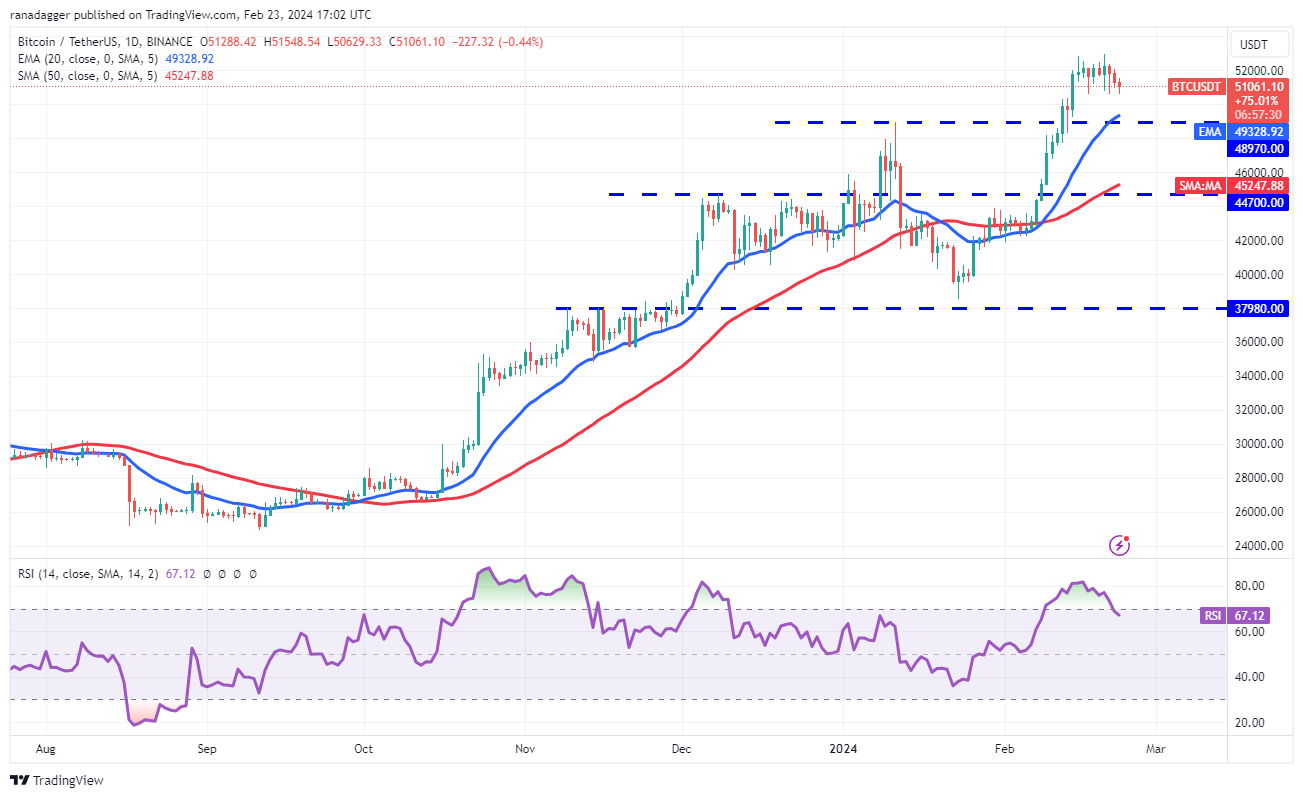
The long tail on Bitcoin’s November 21 candlestick indicates that the bulls were able to buy the dip to the immediate support level of $50,625. However, they were unable to overcome the resistance barrier at $52,000.
 BTC/USDT daily chart. Source: TradingView
If the bears succeed in pulling the price below $50,625, the BTC/USDT pair could plunge to the strong support level at $48,970. However, a bounce off this level would indicate that the sentiment remains bullish and traders are buying on dips. In that case, the upward trend would resume with a break above $52,000, potentially leading to a price rally to $60,000.
On the other hand, if the bears manage to push the price below $48,970, selling pressure could intensify, and the pair may drop to the 50-day SMA ($45,247).
Ether Price Analysis
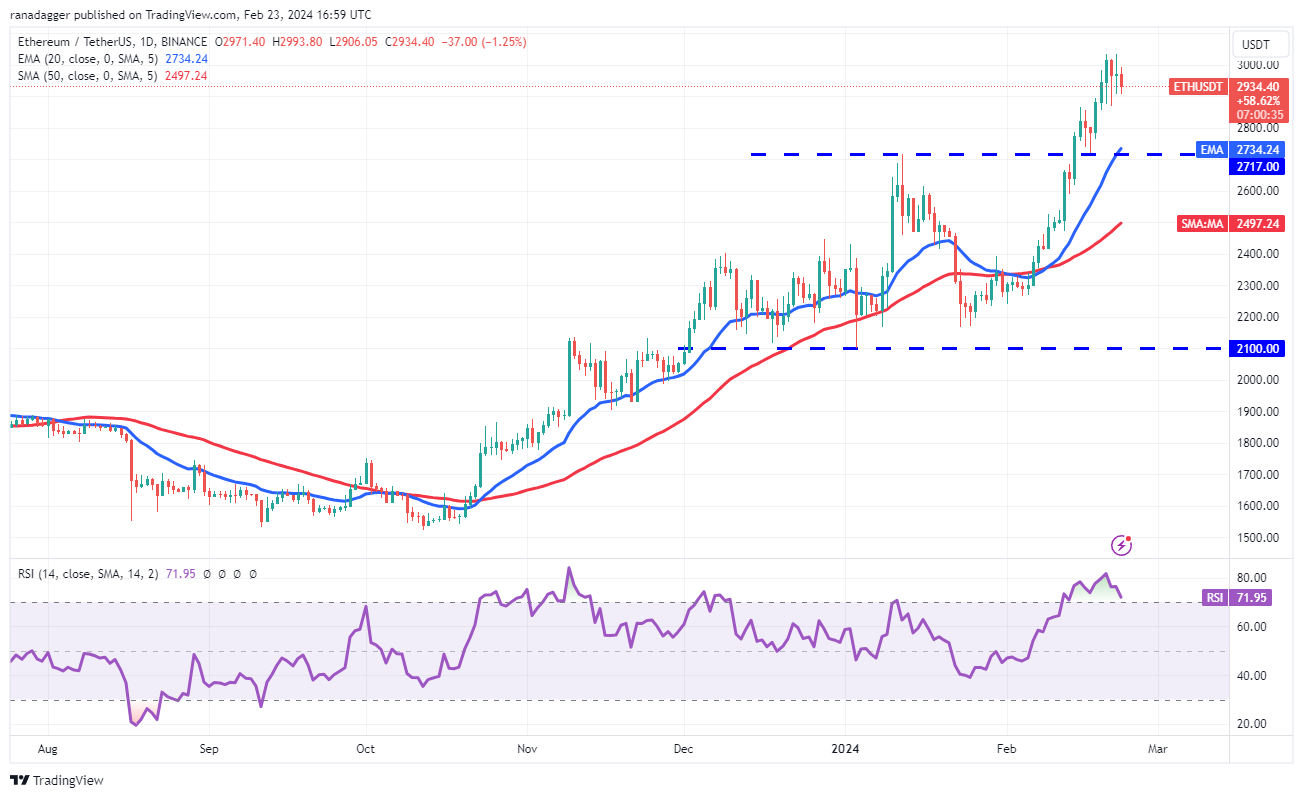
Ether (ETH) attempted to break above the psychological resistance level of $3,000 on February 22, but the bears held their ground.
 ETH/USDT daily chart. Source: TradingView
Sellers are now attempting to initiate a correction towards the breakout level of $2,717, which is an important level to watch out for as the 20-day EMA ($2,734) is nearby. A strong rebound from $2,717 would indicate that the bulls have turned the level into support, and they would then attempt to clear the hurdle at $3,000. If successful, the ETH/USDT pair may reach $3,300.
However, if the bears manage to keep the price below $2,717, the pair could drop to the 50-day SMA ($2,497), potentially delaying the start of the next leg of the uptrend.
BNB Price Analysis
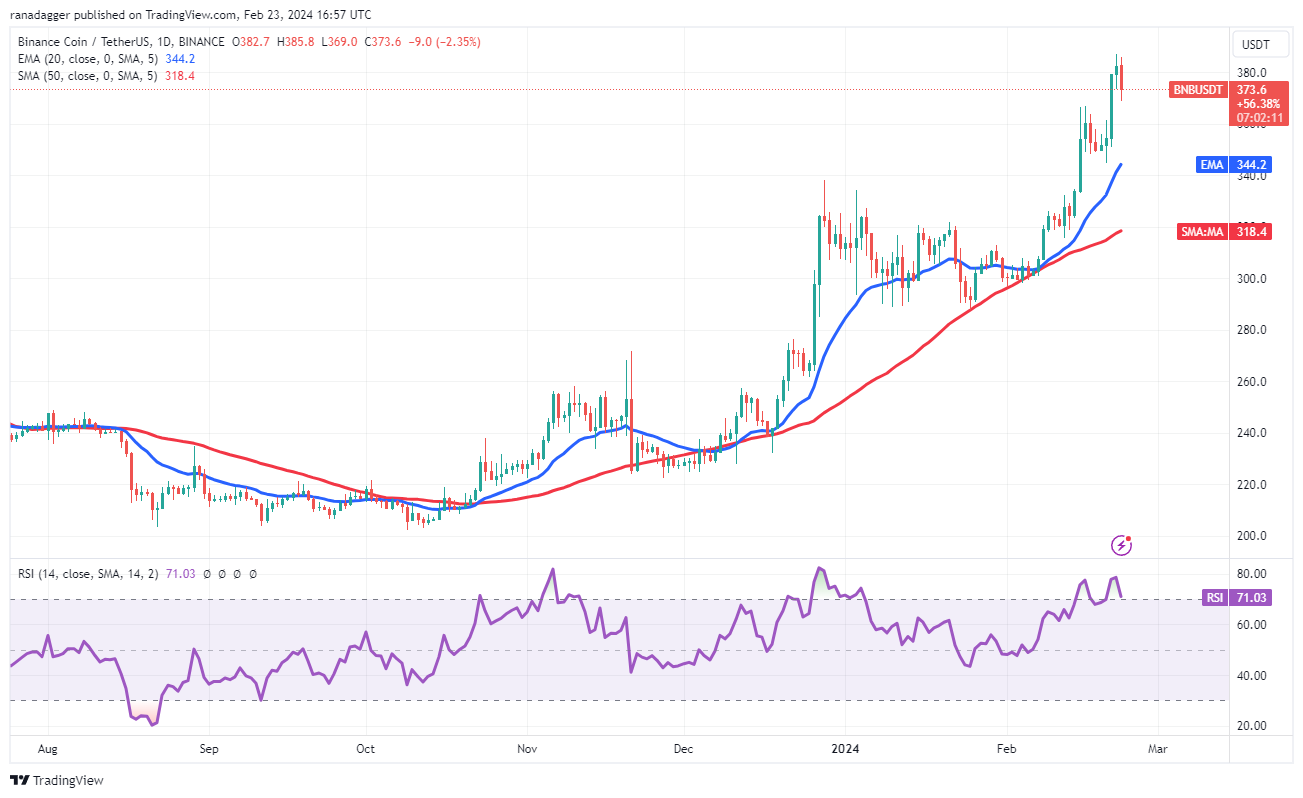
BNB resumed its uptrend after breaking above the $367 resistance on February 21, with the next target objective on the upside being $400.
 BNB/USDT daily chart. Source: TradingView
If the bulls do not give up much ground from the $400 level, it would indicate that every minor dip is being bought, which improves the prospects of a rally to $460.
On the downside, the first support level is $368, followed by the 20-day EMA ($344). If these levels fail to hold, the correction could reach the 50-day SMA ($318), which is an essential level for the bulls to defend, as a break below it would signal a trend change.
Solana Price Analysis
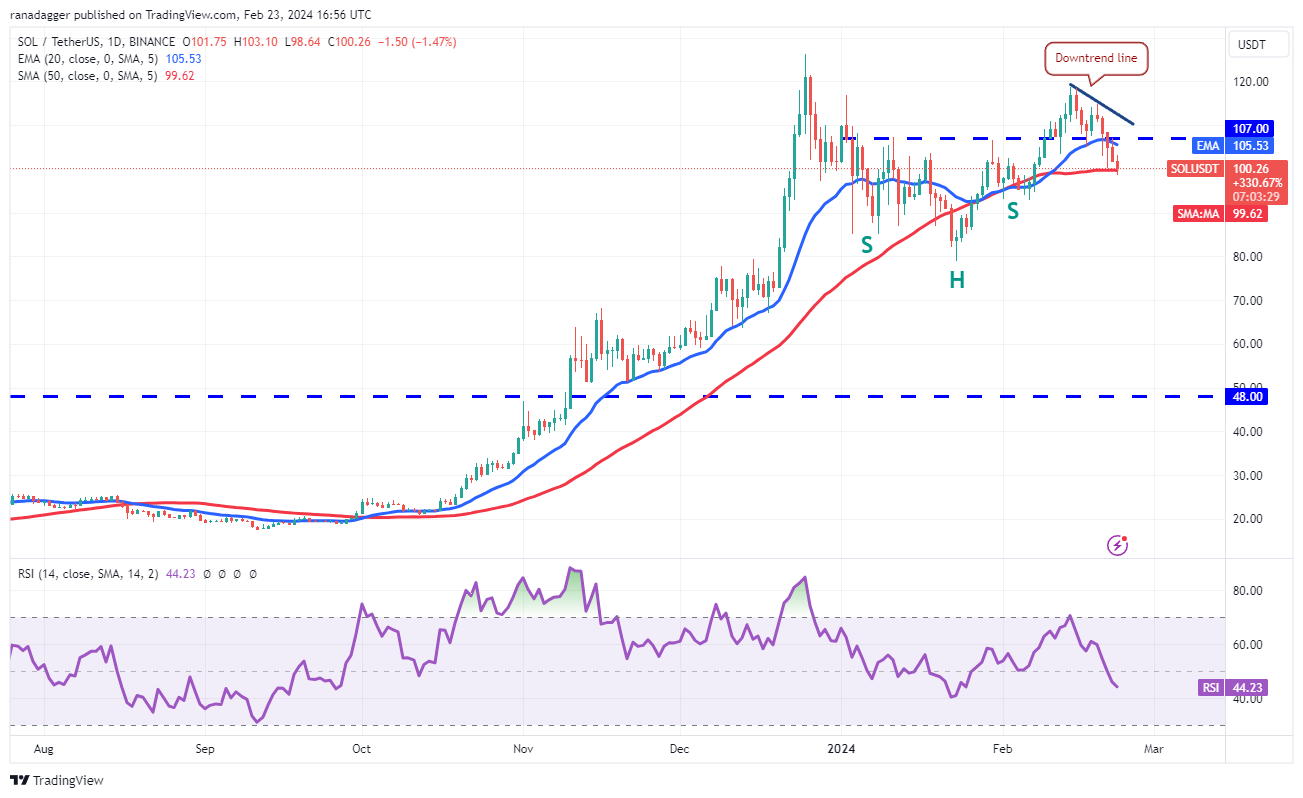
Solana (SOL) bounced off the 50-day SMA ($99) on February 21, but the bulls were unable to push the price above the 20-day EMA ($105).
 SOL/USDT daily chart. Source: TradingView
If the bears strengthen their position and pull the price below the 50-day SMA, the SOL/USDT pair could descend to $93 and potentially down to $80. However, the $80 level is likely to attract aggressive buying by the bulls.
To the upside, the bulls would need to overcome the barrier at the downtrend line to indicate that the correction may be over. In that case, the pair could attempt a rally to $126, where strong resistance is expected.
XRP Price Analysis
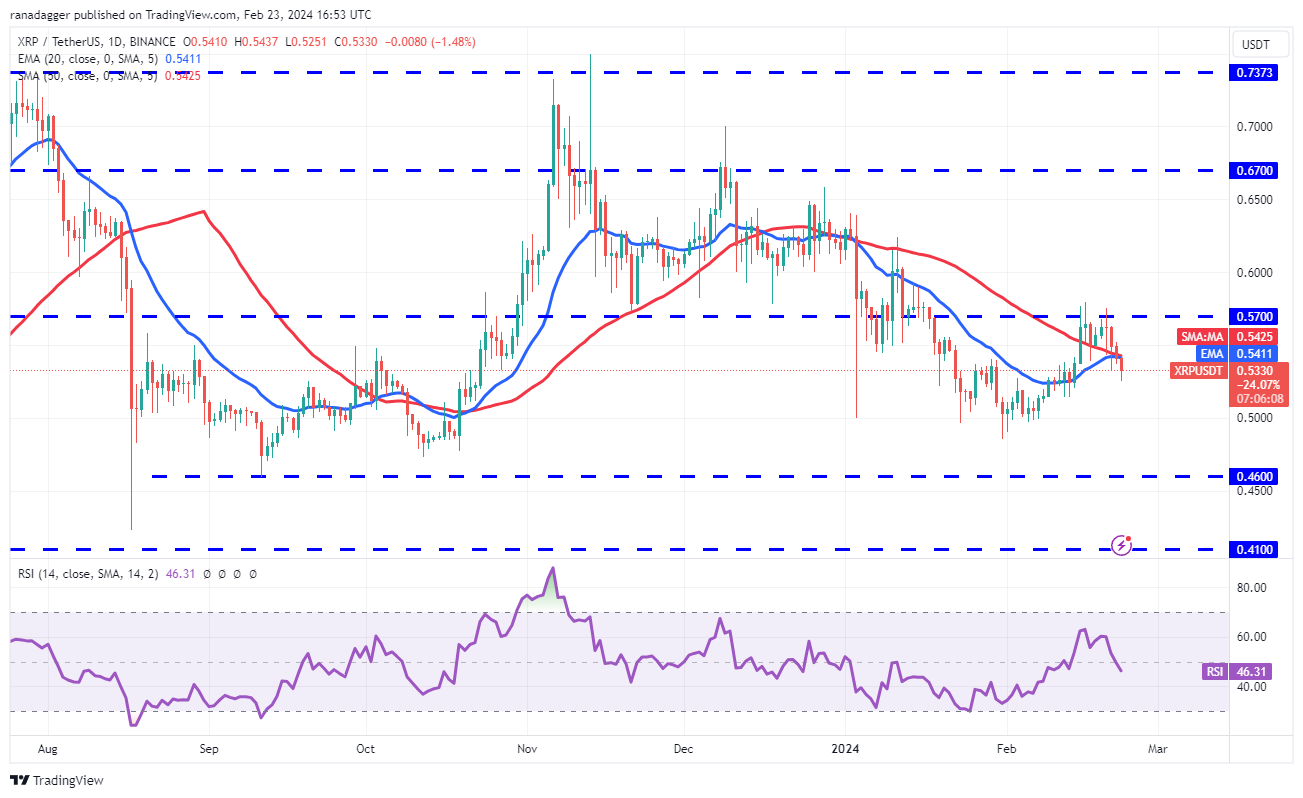
XRP formed an inside-day candlestick pattern on February 22, indicating indecision between buyers and sellers. However, on February 23, the bears managed to overpower the bulls, resulting in a downward move.
 XRP/USDT daily chart. Source: TradingView
The bears will now attempt to push the XRP/USDT pair to the strong support zone between $0.48 and $0.46. If there is a strong rebound from this zone, it would suggest that the pair remains range-bound between $0.46 and $0.57 for a few days.
To confirm the start of a new uptrend, the bulls will need to push the price above $0.57. This would open up the possibility of a rally to $0.67 and subsequently to the formidable resistance level at $0.74.
Cardano Price Analysis
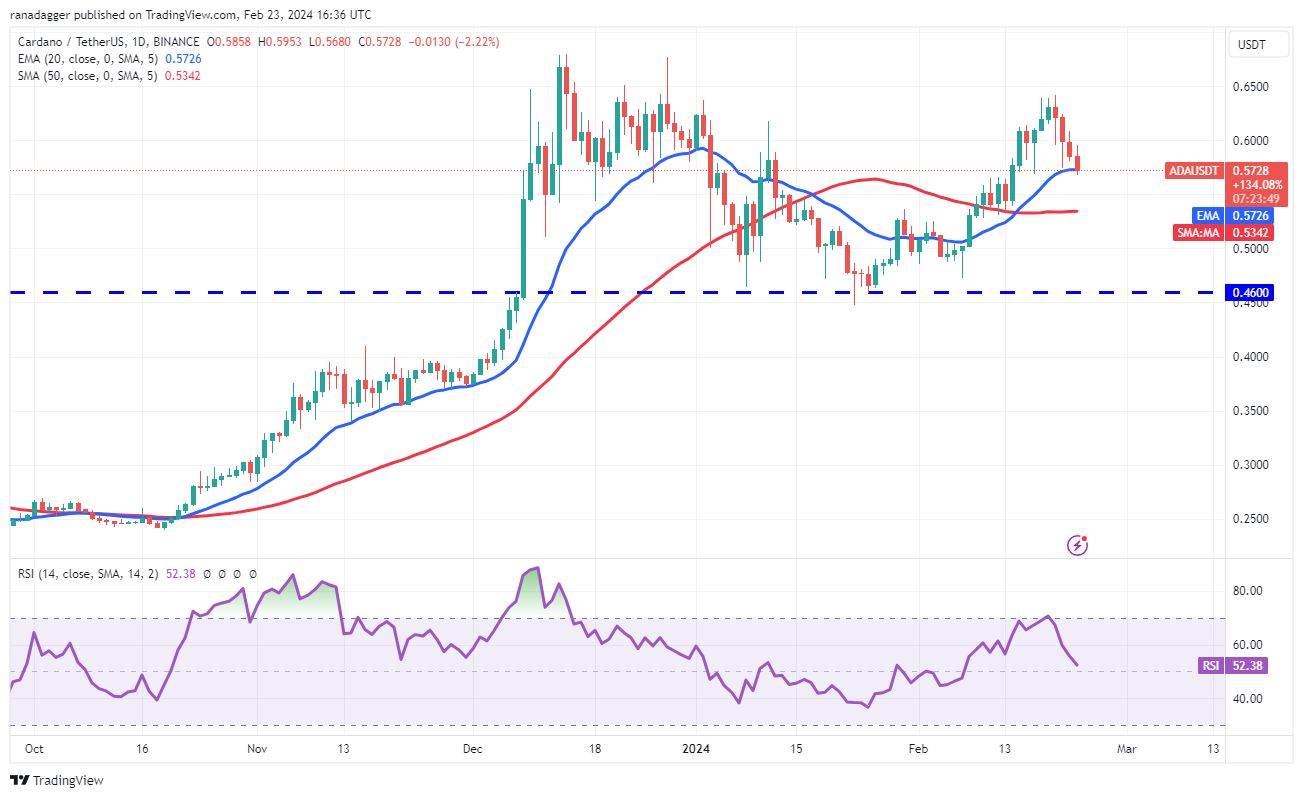
Cardano (ADA) is currently trying to find support at the 20-day EMA ($0.57), but bears are putting pressure on the price.
 ADA/USDT daily chart. Source: TradingView
If the bears prevail, the ADA/USDT pair could slide to the 50-day SMA ($0.53). This is an important level for the bulls to defend as a break below it could lead to a drop to the vital support level at $0.46.
On the other hand, if the price rebounds strongly from the 20-day EMA, it would indicate positive sentiment and that traders are buying on dips. The bulls would then attempt to overcome the resistance zone between $0.64 and $0.68.
Avalanche Price Analysis
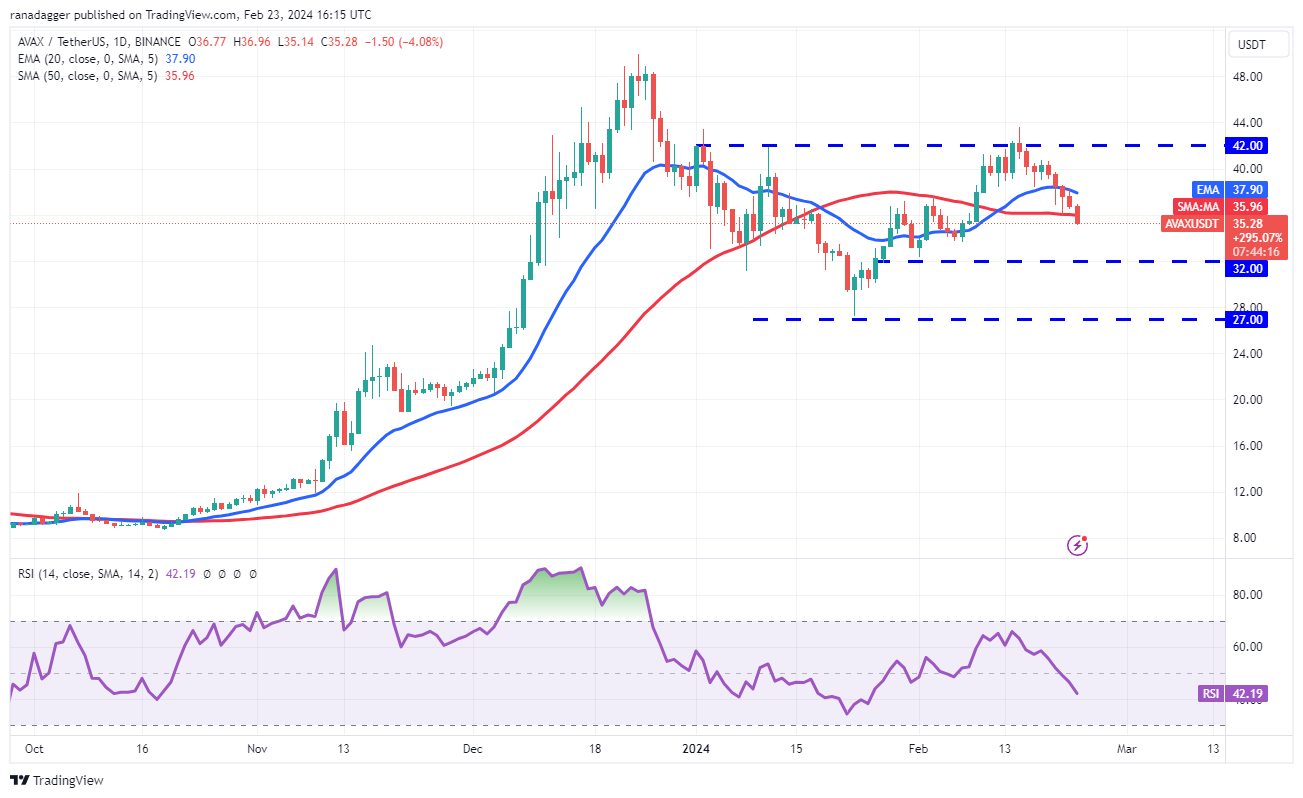
Avalanche (AVAX) made an attempt to recover on February 22, but the bears fiercely defended the 20-day EMA ($37.90), indicating that recoveries are being sold into.
 AVAX/USDT daily chart. Source: TradingView
On February 23, the bears continued selling and pulled the price below the 50-day SMA ($35.96). The AVAX/USDT pair could now drop to the solid support level at $32. If there is a strong bounce from this level, it would suggest that the pair may oscillate between $32 and $42 for a while.
However, if the price turns up from the current level and rises above the 20-day EMA, it would indicate strong buying at lower levels. The bulls would then attempt to drive the price above $42 and complete the inverse head-and-shoulders pattern.
Dogecoin Price Analysis
The bulls are trying to maintain Dogecoin (DOGE) above the symmetrical triangle, while the bears are attempting to pull the price back below it.
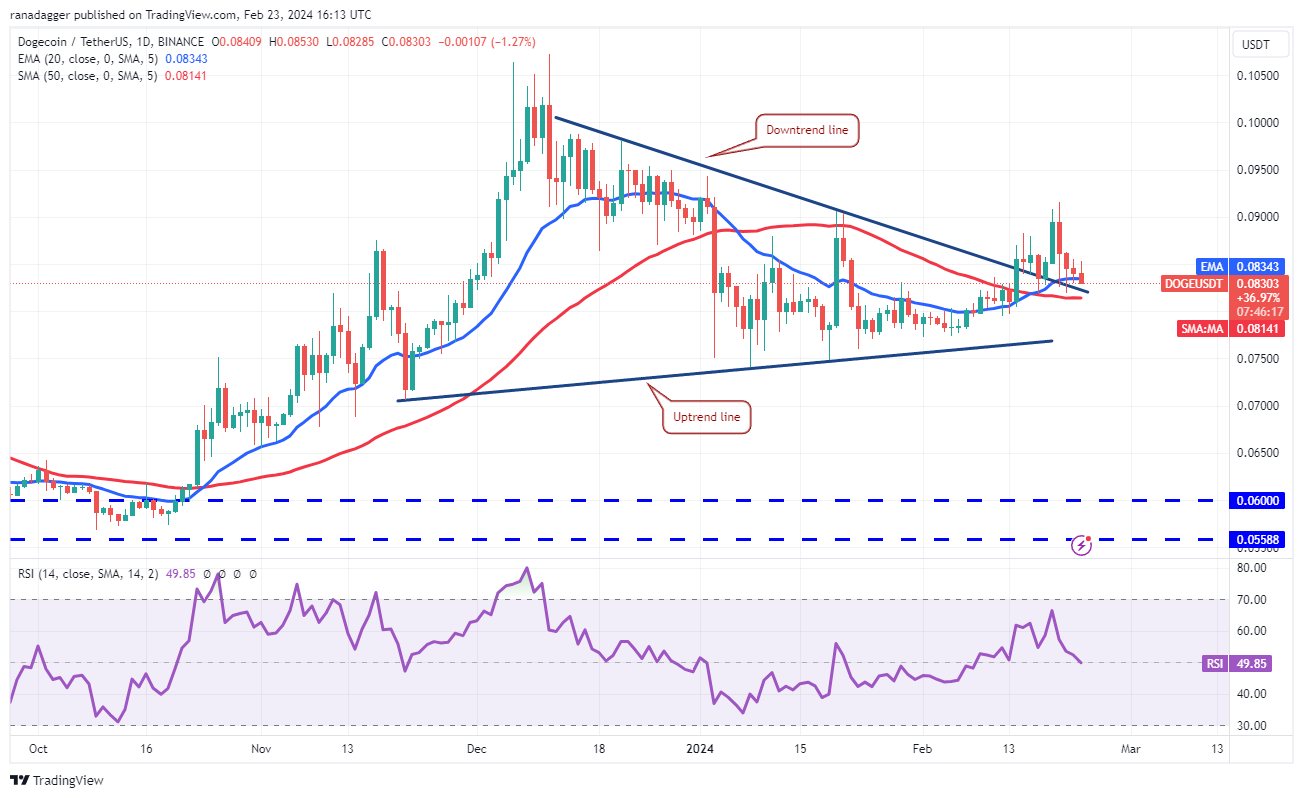 DOGE/USDT daily chart. Source: TradingView
If the price rebounds from the current level, the bulls will try to push the DOGE/USDT pair above the $0.09 resistance. If successful, the pair could start an uptrend towards the $0.10 to $0.11 resistance zone.
However, if the price turns down and falls below the 50-day SMA ($0.08), the positive view would be invalidated in the near term. The pair could then slump to the uptrend line, and a break below this level would favor the bears.
Chainlink Price Analysis
Chainlink (LINK) has experienced a pullback within its uptrend, with bears attempting to push the price to the breakout level of $17.32.
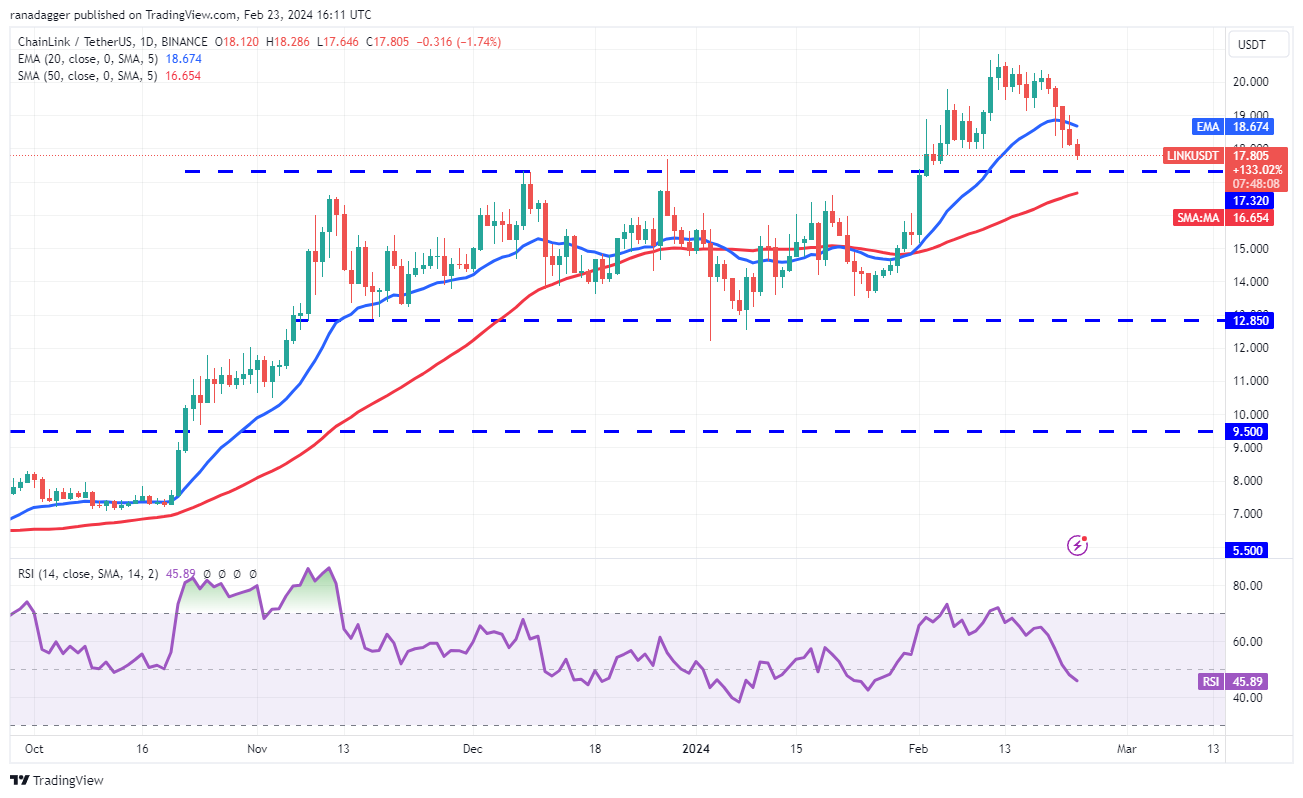 LINK/USDT daily chart. Source: TradingView
If the price bounces with strength from $17.32 and rises above the 20-day EMA ($18.67), it would indicate that the bulls have turned the level into support. This increases the likelihood of a retest of $20.85.
The critical support level on the downside is the 50-day SMA ($16.65). If this level is breached, it may indicate that the bulls have given up, potentially leading to a deeper correction to $15 and later to $12.85.
Polkadot Price Analysis
Polkadot (DOT) is currently trading inside an ascending channel pattern, with both bulls and bears struggling for control.
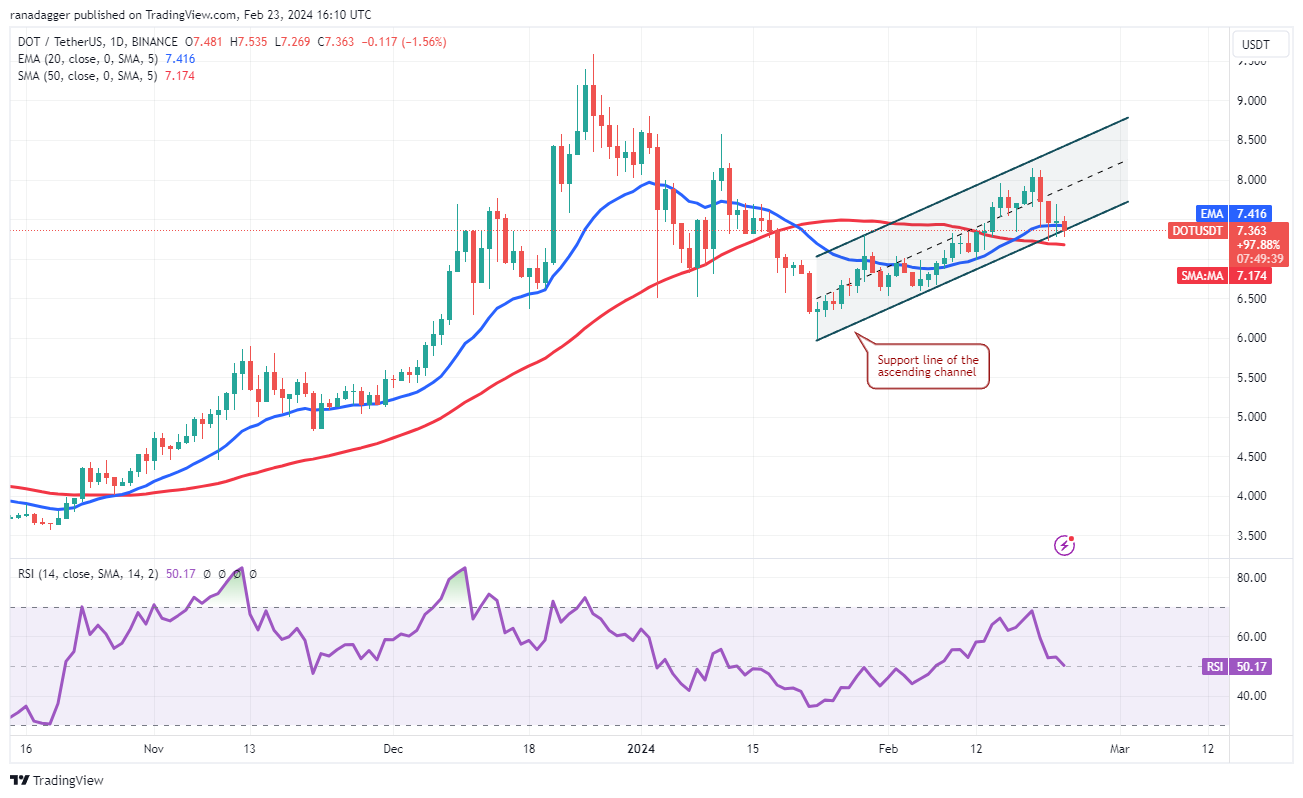 DOT/USDT daily chart. Source: TradingView
The 20-day EMA ($7.41) and the RSI near the midpoint do not provide a clear advantage to either side. If the price breaks below the 50-day SMA ($7.17), the DOT/USDT pair could slide to $6.50.
However, a strong bounce from the current level would indicate that the bulls are defending the support line fiercely. This may keep the price inside the channel for some time. The bulls will then try to push the pair towards the resistance line of the channel.
Conclusion and Future Outlook
Bitcoin currently faces resistance at $52,000, potentially leading to a short-term correction. Analysts compare Bitcoin’s current bull phase to previous ones and anticipate the possibility of a pre-halving retrace followed by a post-halving reaccumulation period.
Looking at the charts of various top cryptocurrencies, it is crucial to monitor the support and resistance levels. The market health could benefit from a corrective phase, allowing weaker hands to exit while stronger hands accumulate at lower levels.
Nevertheless, it is important to keep in mind that cryptocurrency markets are highly volatile and driven by various factors. As always, investors should conduct thorough research, use appropriate risk management strategies, and consult with professionals when making investment decisions.
References:
Bitcoin’s Hesitation, Altcoin Profit-Booking
Why Bitcoin Pullbacks Are Actually a Good Sign
Analyzing Cryptocurrency Charts
The Trader’s Guide to Cryptocurrency Investing
We will continue to update Blocking; if you have any questions or suggestions, please contact us!
Was this article helpful?
93 out of 132 found this helpful
Related articles
- Bitcoin Price Prediction: Matrixport Forecasts Bitcoin to Reach $63,000 Next Month
- 🚀 Pangolin (PNG) Surges 234% in 24 Hours: A Thrilling Rally in DeFi
- Four Key Factors Driving Bitcoin Price Rally, According to Matrixport 🚀💰
- Donald Trump’s Surprising Shift on Bitcoin: From Scam to Acceptance
- Slipstream: Empowering Innovation on the Bitcoin Blockchain 🚀
- US Lawmaker Criticizes Bitcoin Mining Data Collection: What You Need to Know
- Block, Jack Dorsey’s Payment Platform, Records Massive Bitcoin Profits 📈💰