Research | What is the relationship between the difficulty of bitcoin mining and its price?
Most quantitative analysts will review the past bitcoin bubble and predict the approximate timing and consequences of the recent bubble burst. Twitter's quantitative analyst named Plan B is a bit different. He is more interested in "the relationship between BTC mining difficulty and BTC price" rather than studying MACD, RSI or other price-related statistics.
This kind of thinking is always reflected in his daily tweets. He believes that daily transactions actually have little effect on BTC prices. Miners are the biggest sellers, and they are the groups that can really affect the price of Bitcoin. “When the most recent miners’ “surrender” withdrawals were compared to the bottom of the previous bear market, the downside of this key indicator may be a signal that everyone is looking for, indicating that the current bear market has bottomed out.”
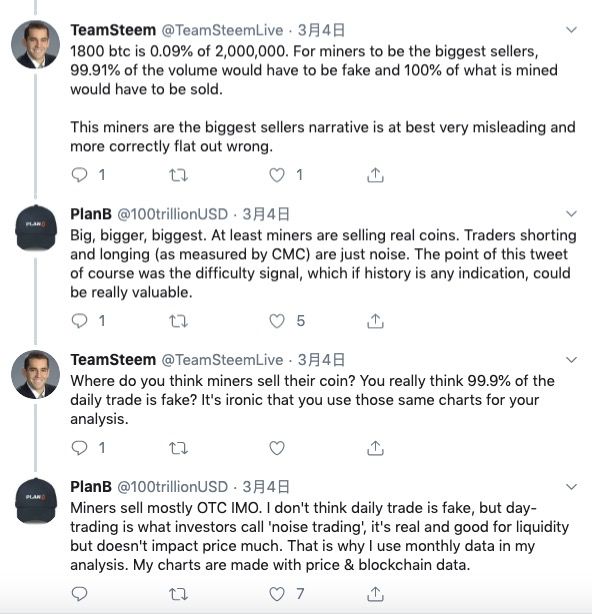
Regarding the relationship between "drilling difficulty and bitcoin price", the current focus on research in this field is represented by bitcoin quantitative analyst Plan B and On-chain metrics analyst Willy Woo, both of whom are very good at modeling analysis, and Willy woo shows this relationship more vividly in the recently released more systematic visual indicator "Drilling Difficulty Belt". Although not as a predictor, many indicators may only be a posteriori, but as another way to visualize the historical data of bitcoin prices, there are always some interesting things to discover.
- Cryptographic currency and Stockholm syndrome
- US Secretary of State Pompeo said that the cryptocurrency "anonymous transaction" constitutes a major national security risk, and the encryption community directly slammed back
- Destroy the bitcoin of Nakamoto! In order not to let the "fake books" be awkward, some people suggested
Willy Woo's bitcoin mining difficulty zone
First of all, the concept of “drilling difficulty” is popularized. The difficulty of mining is to ensure that the dynamic speed of the new block of bitcoin is generated every 10 minutes. When the rate of network discovery is faster than 10min, it will increase. Difficulty, slower than 10min will reduce the difficulty. Simply put, it is to reduce the difficulty when you can't solve the math problem.
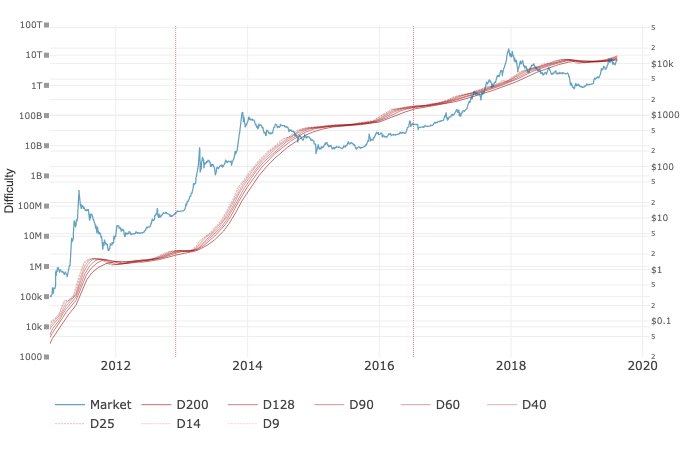
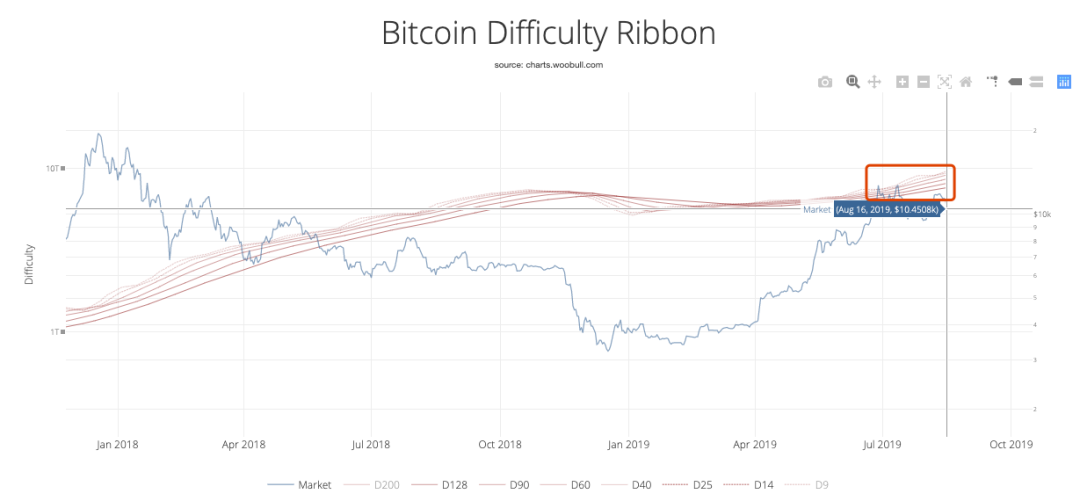
The Bitcoin Difficulty Ribbon proposed by Willy Woo consists of a simple moving average of the difficulty of mining at different times. In the following figure, D9 is taken as an example, which is a curve obtained by taking the average of the mining difficulty of the first nine days of each time point. The difficulty zone is a collection of D9, D14…D200 curves. ** It is easy to see through this curve the rate of change in the difficulty of mining and the impact of mining on bitcoin prices. Shrinkage means that the average value at different times approaches, that is, the average of the 9 days before a certain time is similar to the average of 200, indicating that the rate of change in the difficulty of mining is decreasing.
When the difficulty band shrinks or intersects, it is the best time to buy bitcoin.
This indicator illustrates the impact of mining on bitcoin prices. The basic logic is this. As the new bitcoin is mined, the miners will sell the excavated coins to pay for the mining costs. This creates the pressure of falling prices.
In a bear market, small miners with weaker strengths will sell most of the coins to maintain their operations. But when he sells the BTC and still covers the cost, he will surrender (the mining machine stops mining), and the difficulty of mining the Hash power and network will be reduced (difficulty with shrinkage). Only those big miners who sell less are left behind, thus creating conditions for the opening of the bull market.
Usually we will see this at the end of the bear market cycle. After most small miners “surrender” shut down, the selling pressure from these miners is reduced, bitcoin prices are stabilized and then climbed.
 Bitcoin halving performance
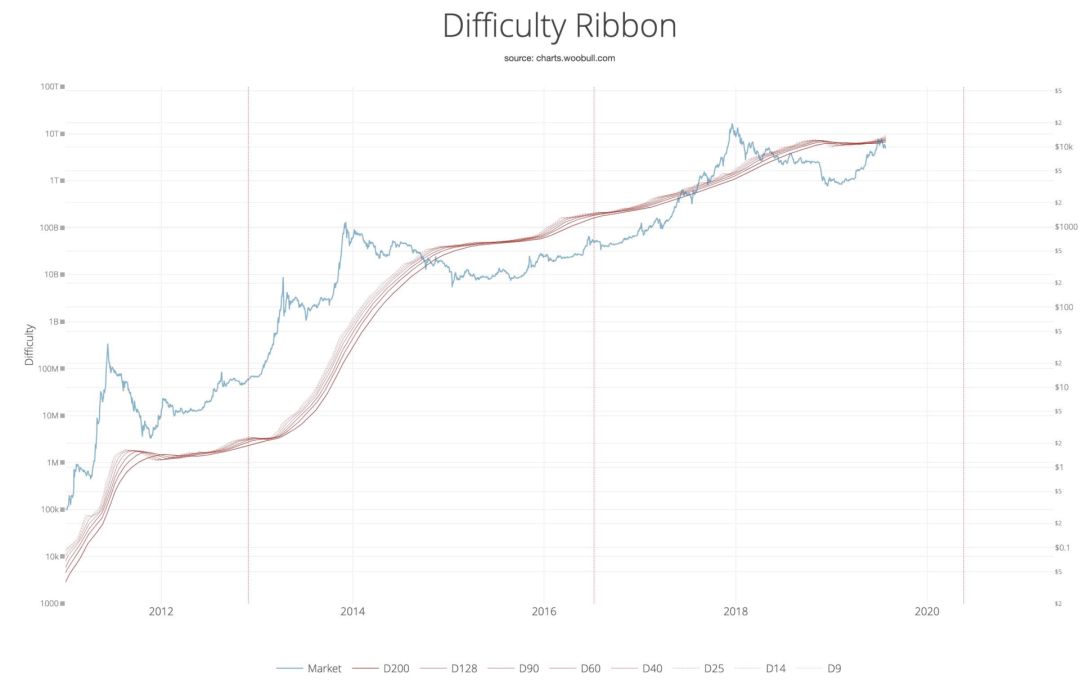
In addition to this in the bear market, miners are halving the bitcoin block rewards, that is, the same mining cost can only dig out the first half of the bitcoin, but at this time bitcoin When the market price increase rate cannot keep up, the miners will also withdraw a lot. We can see that every time the vertical line in the above picture is halved, the mining difficulty band begins to shrink.
What's more interesting is that if you look at the 2019 and 2012 bull market structures, you will find that the changes in mining difficulty in these two years are very similar. A large number of mines were closed (intersection difficulty lines intersected at different times), and the resulting selling pressure vacuum shortened the accumulation interval before the price breakthrough. So in 19 years, this bull market is more structurally like 2012, not 2016. And it can be seen that in December 2018, the bitcoin price showed a significant reversal at the lowest point of $3,200.
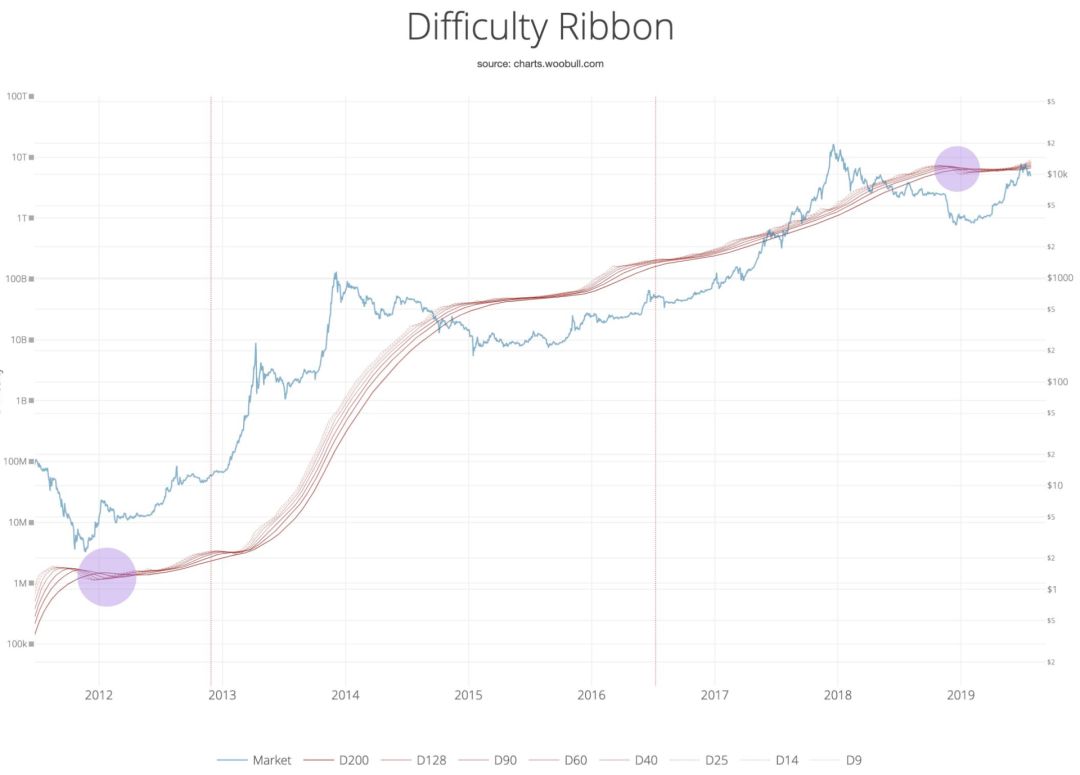
Digging difficulty changes in 2012 and 2019
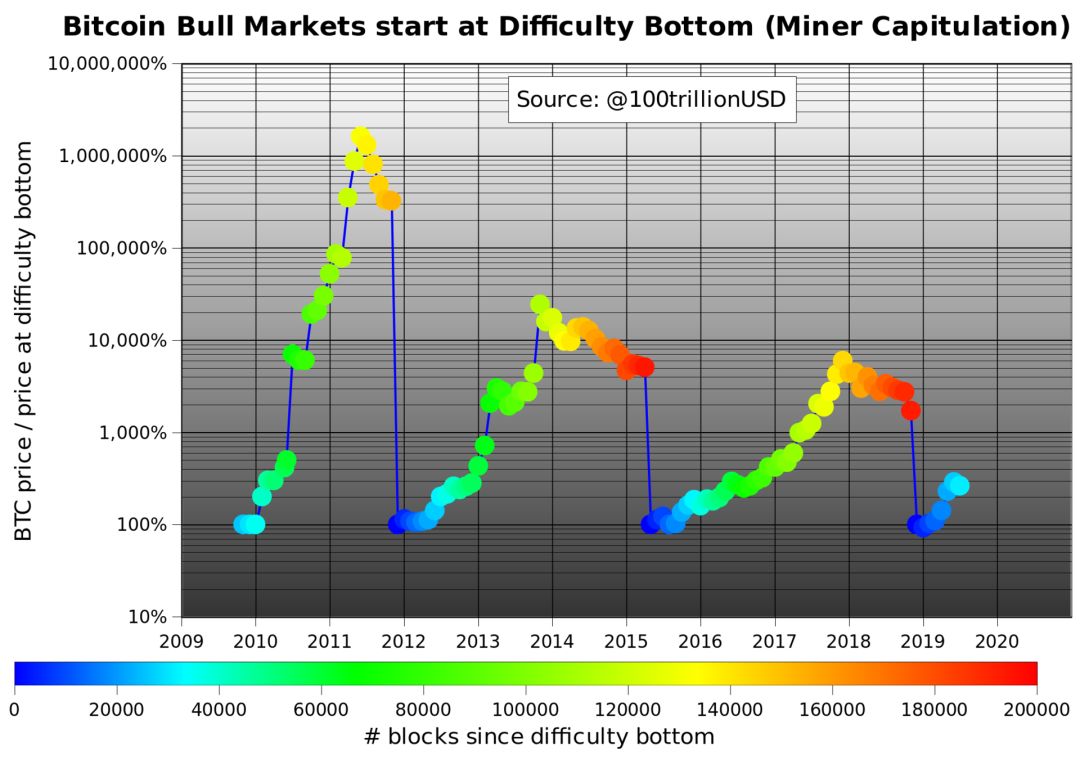 Plan B also reached a similar conclusion in the earlier chart. When the mining difficulty was adjusted downward to the lowest point (Difficulty Bottom), after a large number of miners evacuated, the bitcoin price was turned from bear market. The turning point of the bull market.
We use this model to look at recent data. Recently, with the difficulty of mining Bitcoin's mining to a new record of 9.99T, over 100,000 top ASIC miners have been launched in the past two weeks, we can see that the difficulty zone is obviously divergent. trend.
But as mentioned earlier, this mining difficulty belt is more of a historical data visualization performance, there is no predictive significance, can not be used as a signal to enter the bitcoin, but also need more data to test, but digging from the miners The angle of the difficulty of the mine may be more observed. How will the bitcoin price in 2020 go? We will wait and see.
Reference materials:
Https://twitter.com/woonomic/status/1156968561404866560http://charts.woobull.com/bitcoin-difficulty-ribbon/https://cointelegraph.com/news/3-reasons-analysts-are-bullish-on- Bitcoin-despite-33-price-correction
Author: Willy Woo & Plan B (both Twitter name)
Compilation: Jessie@Orange Book
We will continue to update Blocking; if you have any questions or suggestions, please contact us!
Was this article helpful?
93 out of 132 found this helpful
Related articles
- The future of the central bank's digital currency
- Live capture, delete tweets, this mysterious Twitter account is onlookers
- Bitcoin computing power hit a new high, with an average daily trading volume of $2 billion. Analysts believe that price increases will follow.
- Facebook's WhatsApp plans to launch digital payment service in Indonesia
- Sharing algorithms is dangerous? Unless you have enough computing power
- Rethinking Zhu Jiaming's Speech: Two Levels of "Monetary Financial Hegemony"
- The market oscillated again, paying attention to ETH long-line layout opportunities


