Are You Using the Bitcoin Rainbow Chart? Here’s What You Need to Know!
The Bitcoin Rainbow Chart has become a widely adopted analytical tool that assists traders in predicting the constantly evolving market trends of Bitcoin.The Rainbow Chart’ is your ultimate tool for accurately predicting Bitcoin’s highs and lows.
Bitcoin investors and traders, listen up! There’s a captivating tool in town that can help you predict BTC’s market trends and cycles. 🌈 This tool is none other than the Bitcoin Rainbow Chart! 🌈
BTC Analysis: Riding the Waves of Bitcoin Price Movements
Throughout this year, Bitcoin has taken us on a rollercoaster ride of ups and downs. From a surge above $35,000 in October to soaring past $44,000 in December, its price has left many in awe. 🚀
With the market constantly changing, crypto investors and market watchers are always on the hunt for powerful analytics tools that can give them an edge. And that’s where the Bitcoin Rainbow Chart comes into play. 🌈
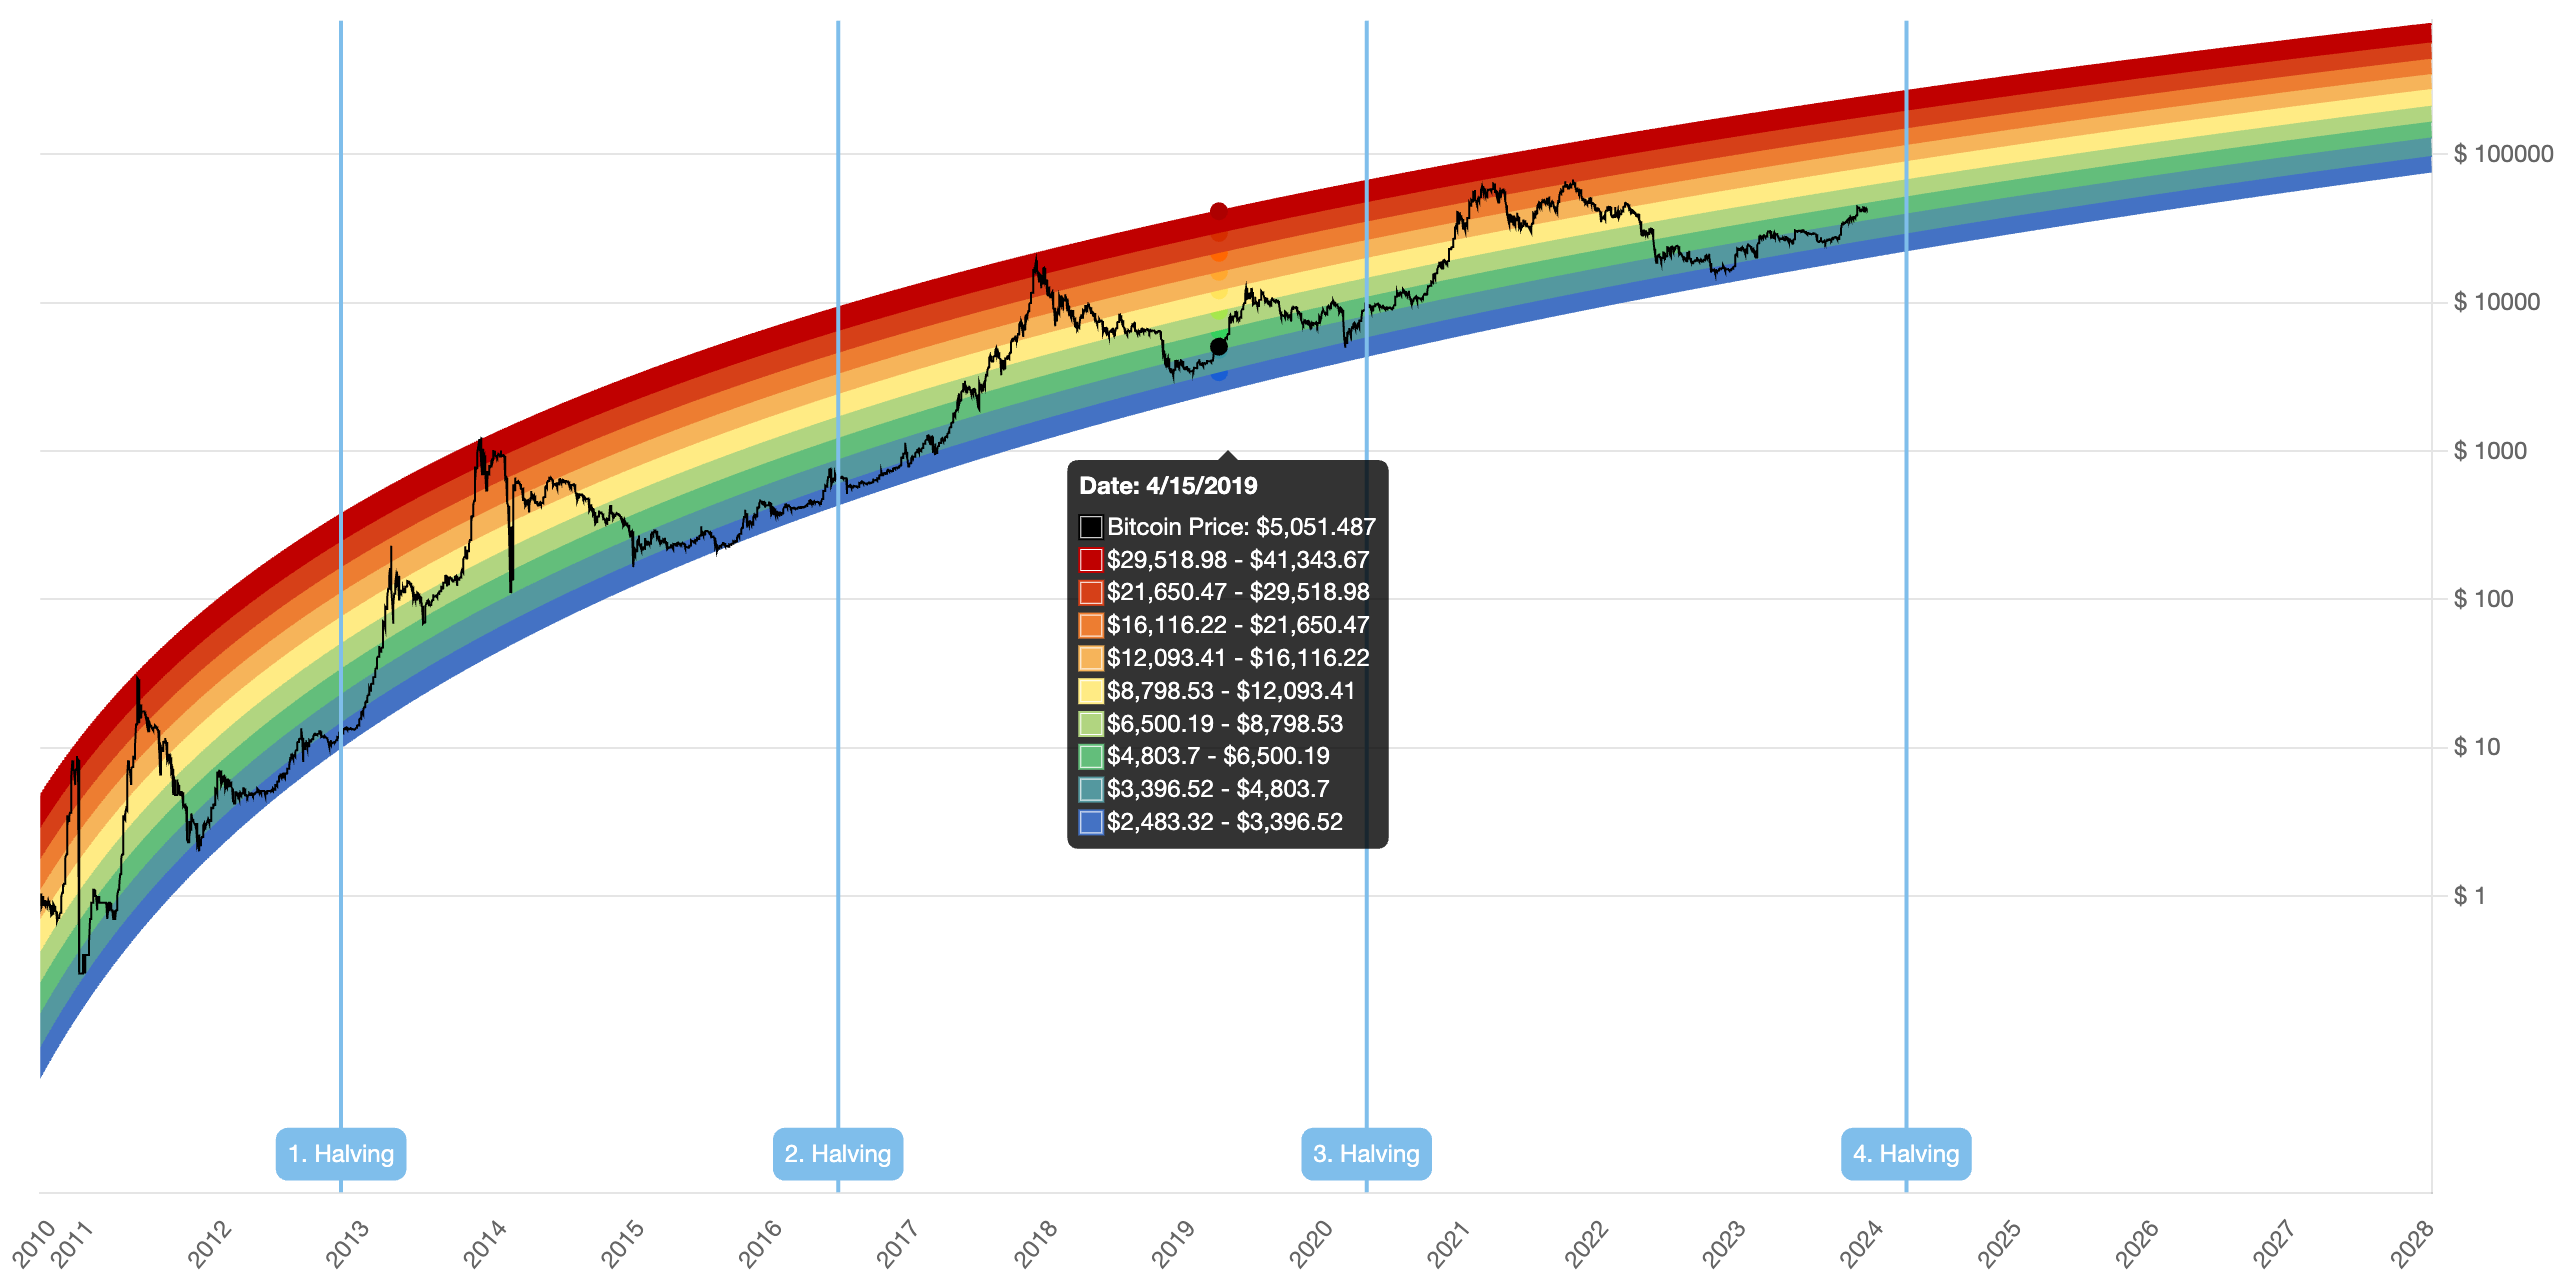 Source: Blockchain Center
- The Race for Bitcoin ETFs: BlackRock, Valkyrie, and Van Eck File Revised Applications
- Solana Emerges as a Fierce Competitor to Ethereum in DEX Volume
- Bitcoin Price Predictions Soar as BTC Surpasses $43,000
Understanding the Bitcoin Rainbow Chart
The Bitcoin Rainbow Chart is a long-term valuation tool that uses a logarithmic growth curve to forecast BTC’s potential price. 📉👀
Currently, according to the rainbow chart, Bitcoin is positioned around the “Accumulate” and “Still cheap” zones. This suggests that it may be the best time to jump in and buy BTC before the selling phase begins. 💰💰
It’s important to note that the Bitcoin Rainbow Chart is not investment advice and cannot predict the exact price of Bitcoin. However, it simplifies BTC price predictions and helps investors identify potential buying and selling opportunities. 📈📊
 BTC price readies to retest $43,000 | Source: BTCUSD On Tradingview.com
The Story Behind the BTC Rainbow Chart
This colorful chart is not just another technical analysis tool. It started as a fun project by a Reddit user to visually represent Bitcoin’s price history. However, it gained popularity when a trader named Trololo developed a more sophisticated version. 💡
Using a clever color-coding scheme, the rainbow chart represents different Bitcoin halving cycles and price ranges. Each band has its own meaning: dark red for maximum bubble territory, red for a robust selling phase, orange and yellow for FOMO intensification and HODL periods, green for favorable buying opportunities, and blue for a fire sale opportunity. 🎨🌈
The Bitcoin Rainbow Chart is widely recognized and used by crypto traders and investors to gain a simpler understanding of BTC’s market movements. Although it doesn’t provide financial advice, its predictions can be quite accurate when applied in the right context. 💡💸
Q&A: Addressing Readers’ Burning Questions
Q: Does the Bitcoin Rainbow Chart guarantee accurate predictions?
A: While the Bitcoin Rainbow Chart is a valuable tool, it’s important to remember that market dynamics can be unpredictable. Use the chart as a guide, but always supplement your analysis with additional research and insights.
Q: How often should I refer to the Bitcoin Rainbow Chart?
A: The frequency of reference depends on your trading strategy and market conditions. Some traders check it daily, while others consult it periodically to make informed decisions.
Q: Can the Bitcoin Rainbow Chart be used for short-term trading?
A: Although the chart primarily focuses on long-term valuations, it can still provide insights for short-term traders by indicating potential buying and selling zones within the larger market cycles.
Looking Ahead: The Future of BTC
As BTC continues its journey, it’s essential to keep an eye on upcoming market trends. While we can’t predict the future with complete certainty, analyzing historical data and trends can provide valuable insights. 🕵️♂️📈
Based on current market dynamics, many experts believe that Bitcoin still has significant growth potential. However, it’s important to consider risk factors and diversify your investment portfolio accordingly. 💼💰
To stay up to date with the latest news and developments in the world of Bitcoin, check out the following links:
- Late Buy: Bitcoin SV (BSV) Price Rallies 80% as MK Token Approaches $5 Million
- Bitcoin Price Could Hit $1,000,000 by 2029, Says Perianne Boring
- Bitcoin Design Foundation Launches, Supporting the Design of the Bitcoin Ecosystem
- XRP Price Surge: ‘Dumb Money’ Will Miss Out, Analyst Cautions
- MicroStrategy Buys $615M Worth of Bitcoin (MSTR Stock Outperforms BTC)
Now that you’re armed with the knowledge of the Bitcoin Rainbow Chart, it’s time to take action and make informed decisions. Share this article with your fellow crypto enthusiasts and let’s ride the Bitcoin waves together! 🌊🚀
Please note that this article is for informational purposes only and should not be taken as financial advice.
We will continue to update Blocking; if you have any questions or suggestions, please contact us!
Was this article helpful?
93 out of 132 found this helpful
Related articles
- Bitcoin and Ethereum Price Outlook BTC Rises 2% and ETH Surpasses $2,300
- Volksbank Raiffeisenbank Bayern Mitte eG Announces Long-term Partnership with terahash.energy GmbH: A Pioneering Collaboration in the Bitcoin Space 🚀
- BlackRock’s Bitcoin ETF beats Grayscale in daily trading volume.
- Andrew Tate’s “Crypto Scamcoin”: A Joke Gone Wrong?
- Marathon Digital Expands Bitcoin Mining Operations with Acquisition of Hut 8 Sites
- Top Institutional Bitcoin Buyers This Week
- Bitcoin’s Accumulation Streak: A Sign of Growing Confidence in the Crypto Market 💰💪