XRP Bulls on the Rise: Price Breakout Imminent?
Why Today's Trading Session is Crucial in Determining XRP's Short-Term Price DirectionXRP Price Alert Possible confirmation of breakout today
📈🐂💥
The XRP price has been in a downtrend since mid-November 2023, but could there be a turnaround on the horizon? Let’s dive into the analysis of the 1-day chart of XRP/USD and explore the potential for a price breakout. 🧐
Challenging Resistance Levels
As of February 15, 2024, XRP is showing signs of bullish momentum, with a 4.1% increase in the last 24 hours and currently trading at $0.55335. But what’s really catching our attention are two critical resistance levels that XRP is testing. 🚀
Fibonacci Retracement Levels
First, let’s talk Fibonacci! The Fibonacci retracement levels, drawn from the swing high at approximately $0.74854 to the swing low at $0.43085, highlight the 0.618 level at $0.55221. This level is a notorious pivot for traders and often indicates a shift in market sentiment. If XRP can break through this level, we might see a shift towards a bullish outlook. 📊
- Dogecoin: A Green Turn in the Cryptocurrency Market 🚀
- Asia vs. USA: A Battle for Crypto Dominance
- Ethereum’s bullish momentum persists as it approaches the $3K mark.
Descending Channel Pattern
Second, the 1-day chart showcases a descending channel pattern that began forming in early-December 2023. This pattern has seen multiple tests of the upper boundary, and once again, the price action is approaching this critical line. A definitive breakout above this descending channel could signal a trend reversal. 📉➡️📈
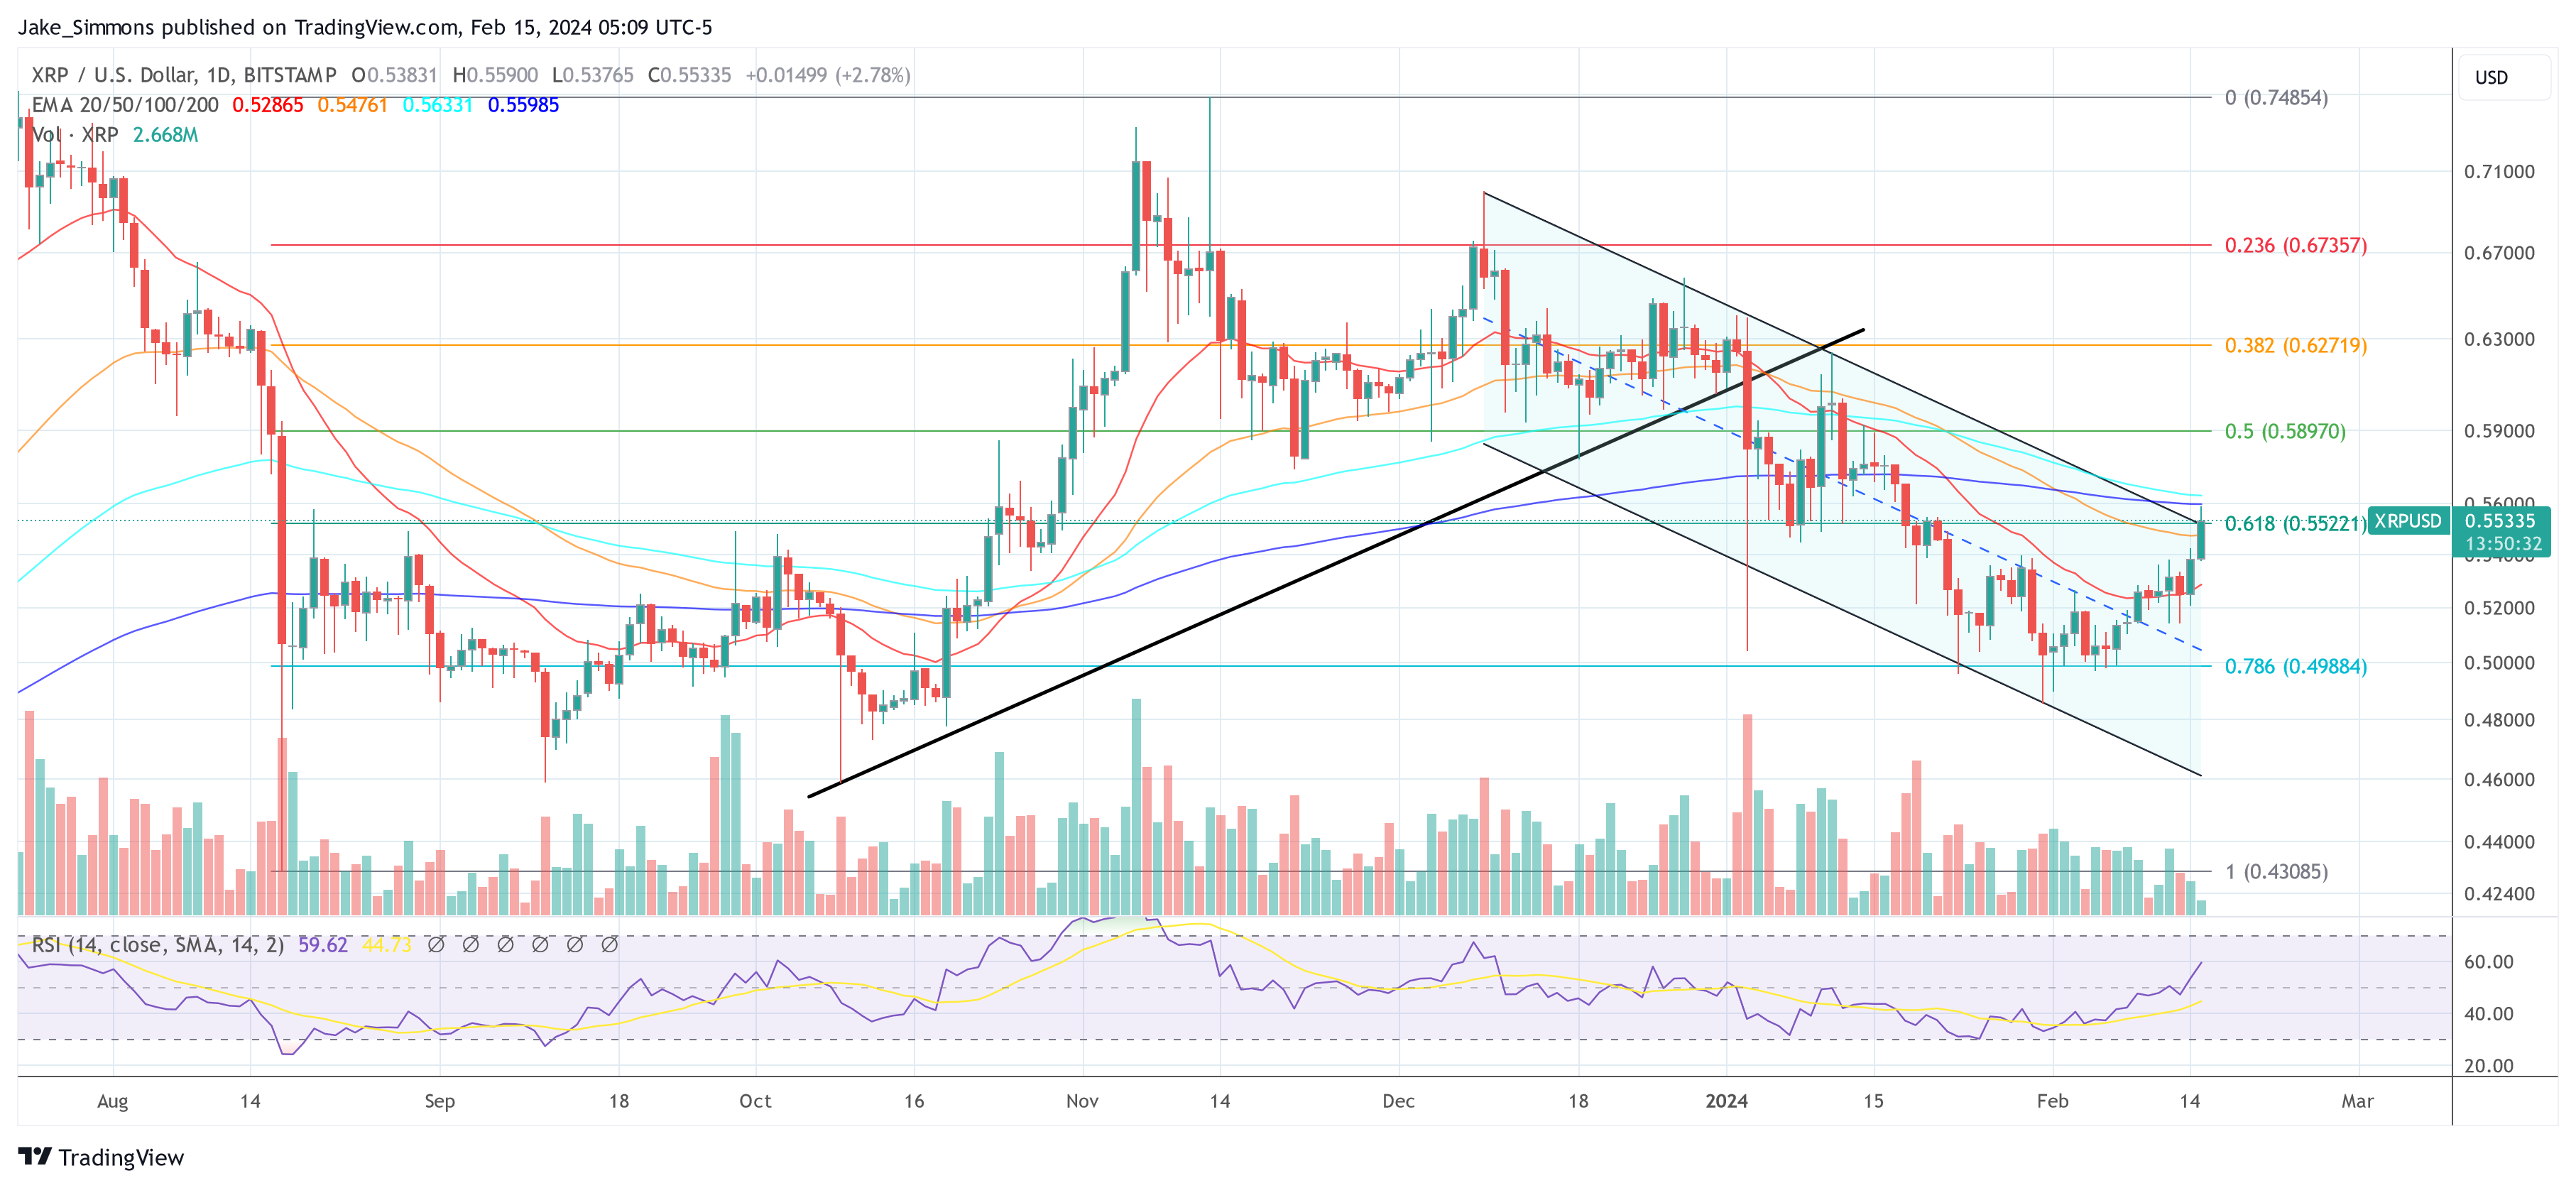 XRP price on the cusp of a breakout, 1-day chart | Source: XRPUSD on TradingView.com
Breaking the $0.55 Mark
For these breakout scenarios to materialize, the XRP price needs to break above the $0.55 mark, which aligns with the 0.618 Fibonacci level. 🚀 Adding to the bullish narrative, the Exponential Moving Averages (EMAs) indicate a potential bullish crossover in progress. The short-term momentum is gaining as the EMA 20 (red line) at $0.52865 trends upwards. The EMA 50 (orange line) and EMA 100 (green line) are positioned at $0.54761 and $0.56331, respectively. The EMA 200 (blue line) at $0.55985 acts as a long-term momentum indicator. A break above this cluster of EMAs, especially the 200-day EMA aka the “bull line,” could strengthen the bullish case. 📈
Volume and Overbought Levels
Volume levels have been moderate, and the absence of abnormal spikes in the Volume Oscillator suggests that the current price increase may need confirmation with higher trading volume to sustain the breakthrough. Additionally, the Relative Strength Index (RSI) is currently at 59.62, below the overbought threshold of 70. This indicates that there is still room for upward movement before XRP becomes overbought. 📉⬆️
Breakout Confirmation Today?
To sum it up, traders should keep a keen eye on whether the XRP price can maintain its movement above the $0.55 to $0.56 range. If accompanied by an increase in volume, this could confirm the breakout from the descending channel and potentially lead to a new uptrend. 🕵️🚀
Today’s trading session holds the key to determining the short-term direction of XRP. If XRP manages to close above the 0.618 Fib, the descending channel, and the 200-day EMA, the bulls could finally be back in town. 🐂🎉
Featured image created with DALL·E, chart from TradingView.com
Tags: #xrp #xrpnews #xrpprice #xrppriceprediction #xrpusd
📚 References: 1. Institutional Traders Show Interest in Crypto – JP Morgan 2. Binance Stirs The Waters With A 200 Million XRP Transfer – What’s The Plan? 3. XRP Price Could Surge from New Acquisition, Amid Community Skepticism 4. Spot Bitcoin ETFs Poised for $36 Billion Influx
🤔 Q&A:
Q: What is the significance of the Fibonacci retracement levels? A: The Fibonacci retracement levels act as potential support or resistance points in a price trend. They help traders identify key levels where price reversals or breakouts might occur. The 0.618 level is particularly important as it often acts as a pivot in market sentiment.
Q: How does the descending channel pattern affect price movements? A: A descending channel pattern typically indicates a downtrend, as the price trades within a defined range. However, a breakout above the upper boundary of the channel can signal a trend reversal and the start of an uptrend.
Q: What is the purpose of Exponential Moving Averages (EMAs) in technical analysis? A: EMAs are used to identify trends, support, and resistance levels, and potential price crossovers. Short-term EMAs provide insights into short-term momentum, while long-term EMAs indicate overall market sentiment.
Q: Why is volume important in confirming price breakouts? A: Volume measures the amount of trading activity and represents the strength behind price movements. Higher volume confirms the validity of a breakout, as it suggests increased market participation and conviction in the new price direction.
🌐 Share this article on social media and let us know your thoughts! Have you been following the XRP price movement? Are you excited about a potential breakout? 🚀✨#xrpallday
We will continue to update Blocking; if you have any questions or suggestions, please contact us!
Was this article helpful?
93 out of 132 found this helpful
Related articles
- XRP Advocate John Deaton Considers Senate Bid Against Elizabeth Warren
- Welcome to ENON: Redefining the Crypto Trading Experience 🚀
- China Plans to Revise AML Law to Tackle Virtual Asset Risks
- 🚀 Blockchain Mining Firm Phoenix Group Sees Impressive Growth Following IPO
- Microsoft and Google Make Big Investments in AI Development in Europe
- Crypto Law Founder John Deaton May Run Against Senator Elizabeth Warren in 2024 Senate Elections
- OpenAI and Microsoft Collaborate to Combat Cyberattacks