Analysis | Analysis of "Black Thursday" from the perspective of the order book, revealing the mechanism of the Bitcoin price collapse
Translation: Ziming
On March 12, selling pressure finally overwhelmed the order book, causing heavy losses for buyers and sellers.
- Viewpoint | VR is a once-in-a-year event, Blockchain is a once-in-a-year event
- Research PoW mining to find out: why crypto miners may become the new killer virus killer
- Bitcoin Liquid sidechain exceeds public Lightning Network channels in the number of BTC held
In this report, we show how the "black Thursday" price plunge has led to a reduction in the depth of the digital currency order book.
"Black Thursday" includes 2 price slumps:
- First plunge: From 10:00 UTC on March 12 to 11:00 UTC on March 12, the price of BTC dropped from $ 7,300 to a low of $ 5,690.
- The second plunge: from 23:00 UTC on March 12 to 2:15 UTC on the 13th, the price of BTC dropped from $ 5,800 to a low of $ 3,900.
When the price slump begins, as traders scramble to sell their assets, market orders can quickly destroy limit orders placed on the order book. Traders usually do not have time to readjust their positions, which may cause the market sell order to quickly swallow the market, leading to a decline in BTC prices.
When looking at the order book data for Black Thursday, we noticed the following:
- During the price slump on all exchanges, the depth of the order book for both buyers and sellers was completely reduced.
- In the first few minutes of the first plunge, there were hardly any bids on the order book between 0% and 2% of the middle price (almost unheard of for mobile trading pairs).
- Due to the prolonged decline in prices, the second plunge caused the order book depth to last longer.
- The bid-ask spread has widened significantly across all the exchanges we analyzed and has remained volatile for several days.
- Bid-ask spreads and damaged market depth have caused prices to fall sharply. Traders who place orders for $ 50,000 will experience very irregular price declines as market orders are filled at chain prices.
The digital currency order book reveals the underlying mechanism of price slump and helps explain how real and automatic selling pressures lead to spiral declines.
Mechanism of price collapse
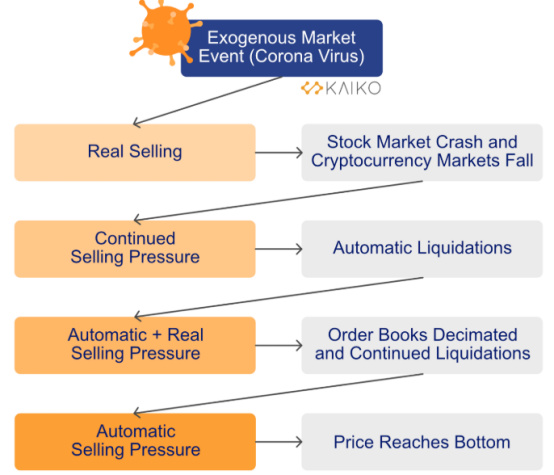
The chart above shows how a truly exogenous market event leads to an endless feedback loop of falling prices, and what we call "Automatic Selling Pressure" exacerbates the situation because of automatic clearing and orders The reduction in book depth has led to further price declines.
As a reminder, an order book is a list of all outstanding bids and enquiries for an asset. The order book is full of market makers' bids and inquiries. The market maker sets the price of the limit order near the middle price. Limit orders will not be executed unless the price of the asset is equal to the price specified in the order.
A market maker's counterparty is a price taker, that is, an order placed at the current price of the asset. The price taker "takes" the order from the order book at the market price of the asset. The sell order of the price acceptor is the buy order of the market maker, while the buy order of the price acceptor is the sell order of the market maker.
During a period of sharp price declines, market orders are much more risky, because price recipients may receive a "bad order," meaning that the order is filled at different prices depending on the number of transactions in the order book. When the selling pressure increases, the market sell order will flood the entire order book, thereby destroying the depth of the order book and driving down asset prices.
Ultimately, the "depth" of the order book can have a significant impact on asset prices. In fact, the higher the liquidity on the order book, the more difficult it is for market orders to push down (or push up) prices.
However, no matter how deep an order for an asset is, a price collapse like March 12 will be exacerbated by the crypto industry's consolidation and overlapping supply and demand flows.
The price of the asset less reflects the "true value at the point in time allocated through the market-based price discovery process", but more like the product of an endless feedback loop triggered by automatic clearing and reduced LOB depth.
March 12-13 Order Book Depth Overview
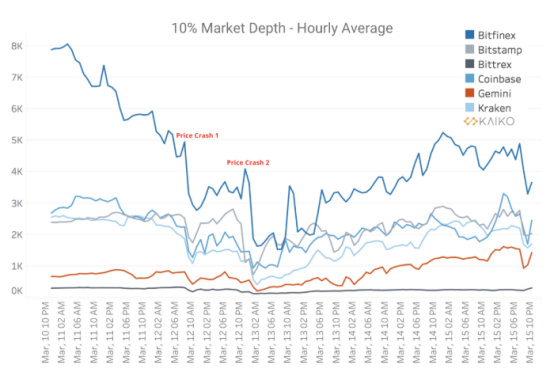
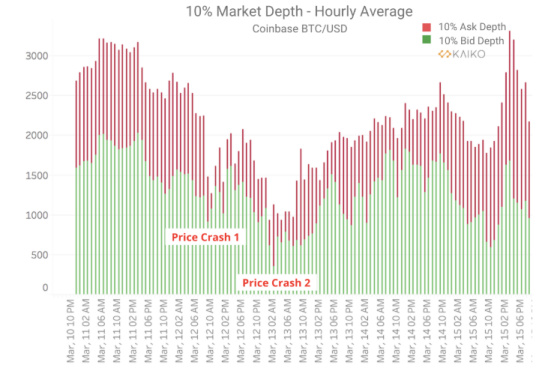
As selling pressure increased and the order book depth was damaged, the first price collapse caused the order book depth of all exchanges to drop significantly. In the next few hours, the order book depth partially recovered, but fell again during the second price crash.
We plotted the average 10% buy / sell depth per hour for 6 exchanges from Coinbase, Bitfinex, Bitstamp, Bittrex, Gemini and Kraken. The first and second crashes are marked in the graph to show how the average depth dropped sharply between March 12 and March 13.
To better understand how the price plunge affects the order book, we took a closer look at the BTC / USD order book on Coinbase. We first plot the average hourly transaction depth (bidder and inquirer) from March 10th to 15th.
We can determine the impact of two price crashes on the average hourly market depth. Compared with the first plunge, the second plunge caused the average number of transactions on the order book to drop significantly over a long period of time, which may be longer.
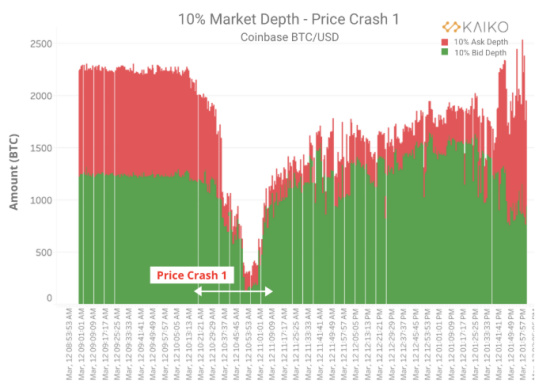
Now let's take a snapshot of the market depth of each order book. Unlike the chart above, the market depth below is calculated from the original snapshot, not the average over the hour.
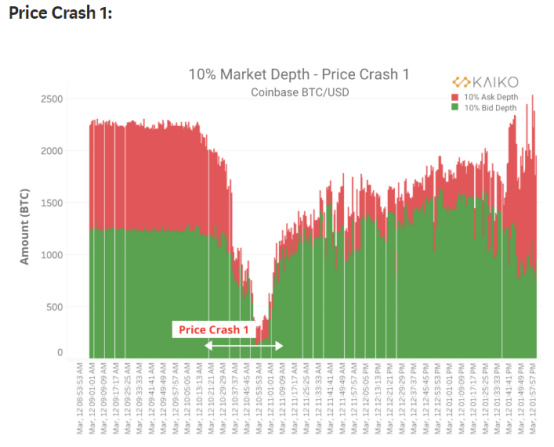
As prices began to fall around 10:30 AM, we observed a sudden decrease in the market depth of the Coinbase order book. After the first price crash, the 10% market depth was less than 1/4 of the trading volume before 10:30 AM. As market makers readjusted their positions, the market's depth quickly rebounded.
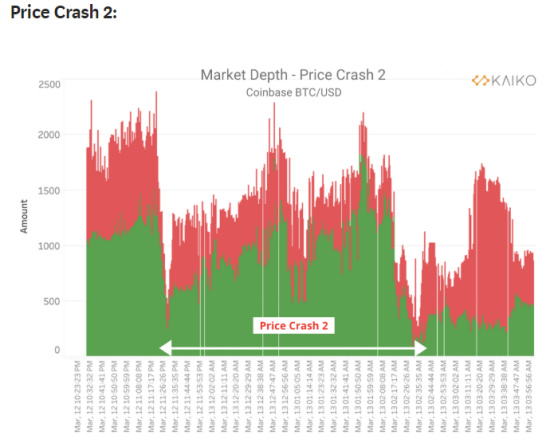
The second plunge lasted much longer than the first plunge. At the beginning of the second plunge, the depth of the market fell sharply initially and continued to fluctuate over the next few hours. In the first plunge, the market depth stabilized in the next few hours, but in the second plunge, the market depth continued to fluctuate until March 13.
In the early morning of March 13, the price of BTC rose rapidly, which is why the purchaser's purchase volume increased sharply at 3:00 in the morning.
2% market depth during the first price crash
In order to further study how the price plunge affects the order book, we need to carefully study the bids and enquiries near the middle price. We calculated bid and inquiry orders at a 2% distance from the median price, as they are the prices most likely to be executed when the market moves.
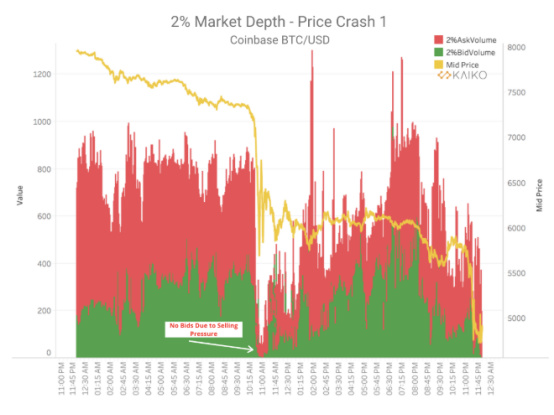 The result is very obvious. The above figure shows that as the price plunge starts (yellow line), the bid order in the order book is completely cleaned, that is, there are almost no bid orders. The results showed that the bid order was executed immediately and there were not enough limit orders to match the selling pressure from the price recipient.
When there are no bids near the middle price, the price will be further lowered because market orders will be filled at a lower price level.
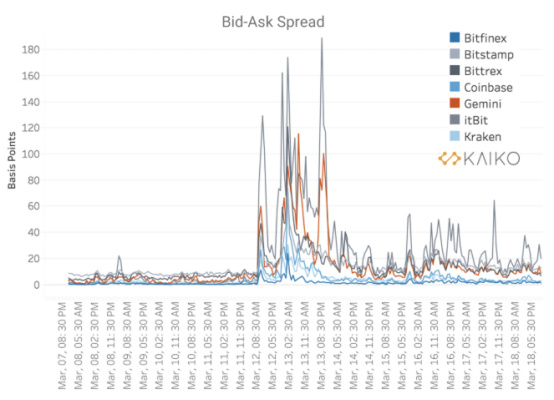
Significantly widening bid spread
The 2% market depth chart above can be further explained by the bid spread, which is a common indicator of market liquidity, that is, the difference between the best ask price and the best bid price. The narrowing of the spread indicates that the market is more liquid and the order book has sufficient depth. If fewer market makers place limit orders, the spread may widen significantly.
In volatile markets, spreads often widen, which indicates that prices are changing rapidly. From March 12th to 13th, the spreads of all BTC / USD markets widened significantly, causing orders to be filled at a price level far from the middle price.
The spread did not return to the level before the plunge but continued to fluctuate in the next few days, which indicates that market makers are still worried about another large-scale sell-off.
Sharp decline in prices
Price decline is the difference between the expected price of a transaction and the price at which the transaction was executed. During the price crash, as the price decline expanded and the market depth decreased, the price decline of orders of various sizes increased sharply. High price declines are detrimental to users who place orders, as this results in reduced profits.
We plotted a simulated average hourly price drop for a $ 50k sell order, calculated using a snapshot of the original order book.
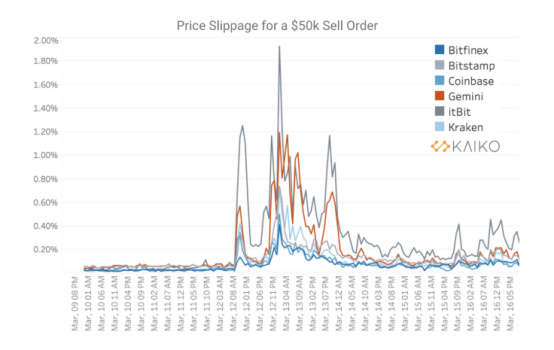
In the exchanges shown in the figure above, the initial decline in the price of mobile markets such as BTC / USD was lower, hovering between .01-.1%. On March 12, we saw the slippage climb more than 10 times. A few days after the price slump, the slippage was still much higher than the average, indicating that the depth and spread of the order book were still volatile.
in conclusion
The order book reveals the inner workings of the market crash, which can help explain how prices enter negative feedback loops triggered by real and automatic selling pressure. By charting market depth, spreads, and price declines, we show the devastating impact of price crashes on traders and the market as a whole.
We will continue to update Blocking; if you have any questions or suggestions, please contact us!
Was this article helpful?
93 out of 132 found this helpful
Related articles
- The data shows that the probability of BTC breaking through 10,000 in June is only 16%. Do you believe it?
- Research report | When the blockchain meets the sharing economy, what kind of spark will it collide with?
- Shanghai court first explores the use of blockchain certificate technology, and 10 court trial trial record reforms started in April
- The blockchain industry's air outlet is reappearing: dozens of institutions quietly lay out the Shanghai Lingang Free Trade Zone, and the four provinces are intensively issuing policies to grab the "track"
- Perspectives | Ethereum 2020: Roadmap and Outlook
- Opinion | Wang Qian of Jilin University: The Central Bank will definitely face fierce competition between private and fiat currencies in the future
- Prediction | Data show that the probability of BTC breaking 10,000 by June is only 16%