Automated market maker AMM is on fire, but you need to understand the risks of providing liquidity
Written by: AlfaBlok, blogger of Crypto Español channel, former Microsoft employee
Compilation: Perry Wang
Source: Lianwen
AMM is the most popular field in DeFi, and its full name is automatic market maker (automatic market maker).
- Market analysis: BTC rebound is still weak, pay attention to the downside risks in the short term
- On-chain data scan in March: Where did all these USDTs go in a single month with more than 1.3 billion additional issuances?
- Zhu Jiaming: 2020 will be an important year for the integration of blockchain and industry
Uniswap is sweeping the DeFi field with thunder, and exciting projects like Balancer have just started, which will definitely bring many new opportunities to this field.
AMM allows users to exchange encrypted assets, such as DAI for ETH, without the need to pass a centralized counterparty. This is different from traditional cryptocurrency exchanges such as Coinbase, Kraken or Binance, which act as an intermediary between token buyers and sellers in the transaction. These companies are all centralized institutions, subject to regulation, censorship and identity control, while AMM is just some smart contract system that runs non-stop on distributed ledgers such as Ethereum.
The interesting thing about AMMs is that they require some users as liquidity providers for their services. Liquidity providers promise to submit their asset pairs to the so-called "liquidity pool".
For example, when you convert ETH to DAI on the Uniswap platform, you are actually using your own assets to trade with one of the "fund pools".
Fund pool rate structure
AMM charges users who use the service a certain transaction fee. Uniswap's rate is 0.3% of the transaction value. This 0.3% charge will enter the fund pool and be distributed to users who contribute funds to liquidity, according to their contribution proportion. Examples:
Fund Pool A:
There is 100 ETH + 10,000 DAI
75% of the funds are contributed by user A, and 25% by user B
Users can exchange assets with this fund pool. For example, user Z exchanges 30 ETH for 3000 DAI. This transaction will incur a 0.3% fee, which is 9 DAI. This fee is deducted from the transaction (user Z only gets 2991 DAI), and 9 DAI remains in the fund pool. Since A / B has 75/25 ownership of the fund pool, the additional 9 DAI will be distributed proportionally.
If the fund pool continues to expand and the third user invests funds, the cost allocation will be further diluted. Therefore, the larger the size of the capital pool, the less fees a single investor will receive.
In short, the final share of liquidity providers depends on two factors:
Transaction amount. For liquidity providers, if the transaction amount doubles, the transaction fees will double; the size of the capital pool. The size of the capital pool has doubled, and the transaction fees received by liquidity providers have been reduced by half. Conversely, if the pool size is reduced to half, the transaction fees generated will double.
Liquidity Provider's Return VS Tuncoin Revenue
Anyone can provide funds to the pool of funds to participate in the distribution of expenses. However, compared with the simple currency buying-holding strategy, providing funds to the fund pool is not guaranteed to be a stable earning strategy.
Let's compare the returns of the two, which is to buy and hold VS to provide funds to the capital pool:
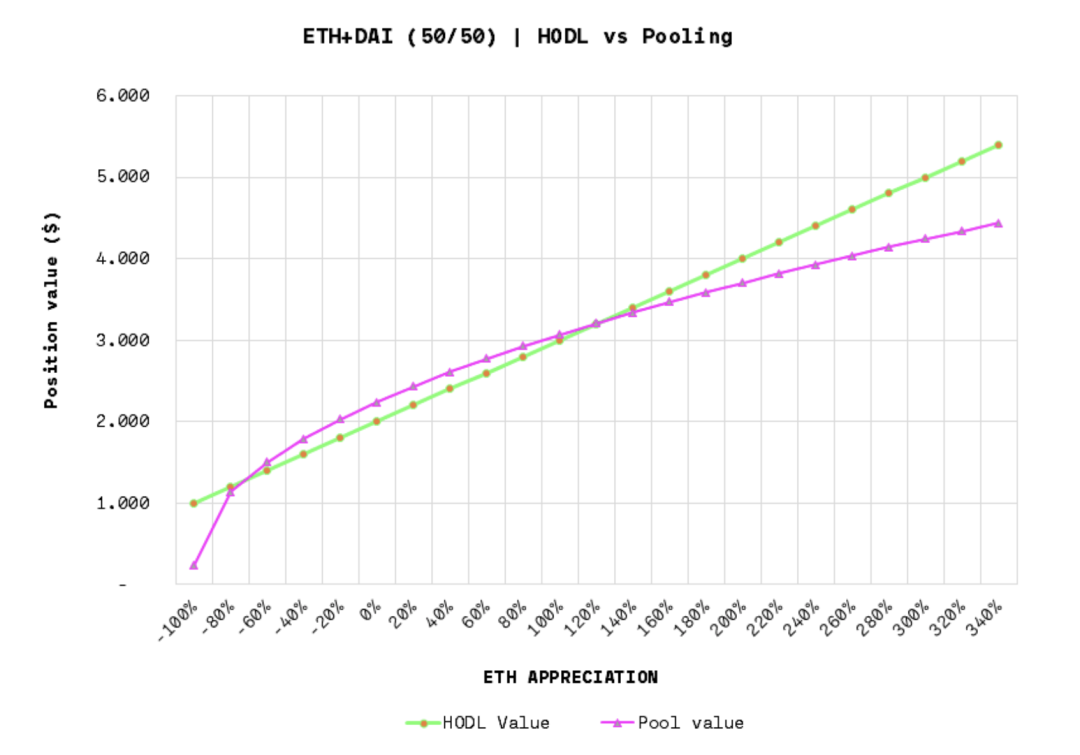
The assumptions in the above figure: ETH = 100 DAI, transaction fee = 0.3%, fund pool size = 30,000 ETH, monthly transaction amount = 200,000 ETH, holding time = 1 year.
If the ETH price falls by more than 80% during this period, or rises by more than 120%, the performance of the liquidity pool strategy will be worse than the buy-hold strategy. In other cases, the strategy performed better than the price following strategy (buy-hold).
The following is another diagram showing the comparison between pooling / pooling and HODL:
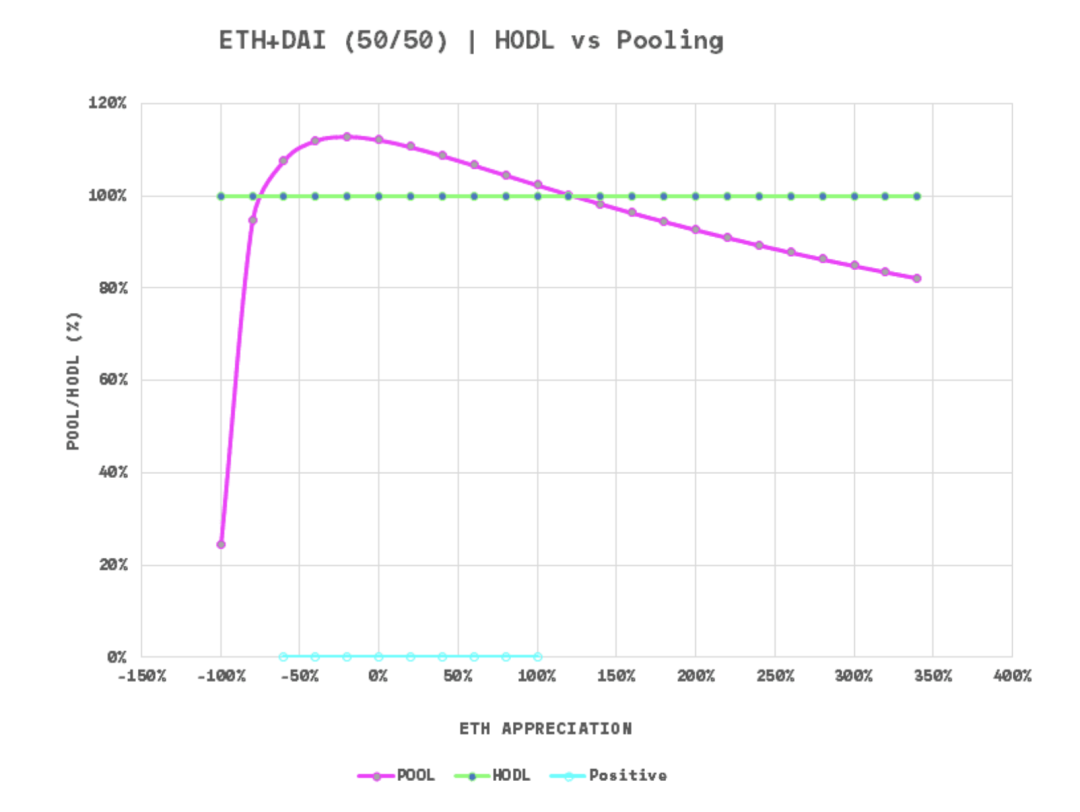
In the above chart, the Y-axis is no longer denominated in US dollars, but the pooling position is divided by the Tun currency position, and the percentage difference between the two is obtained. More than 100% means that the pooling strategy wins.
The impact of changes in the size of the capital pool
Now we assume that the same amount of funds is contributed to the pool of funds, and the transaction amount is also unchanged, but the overall liquidity in the pool is doubled:
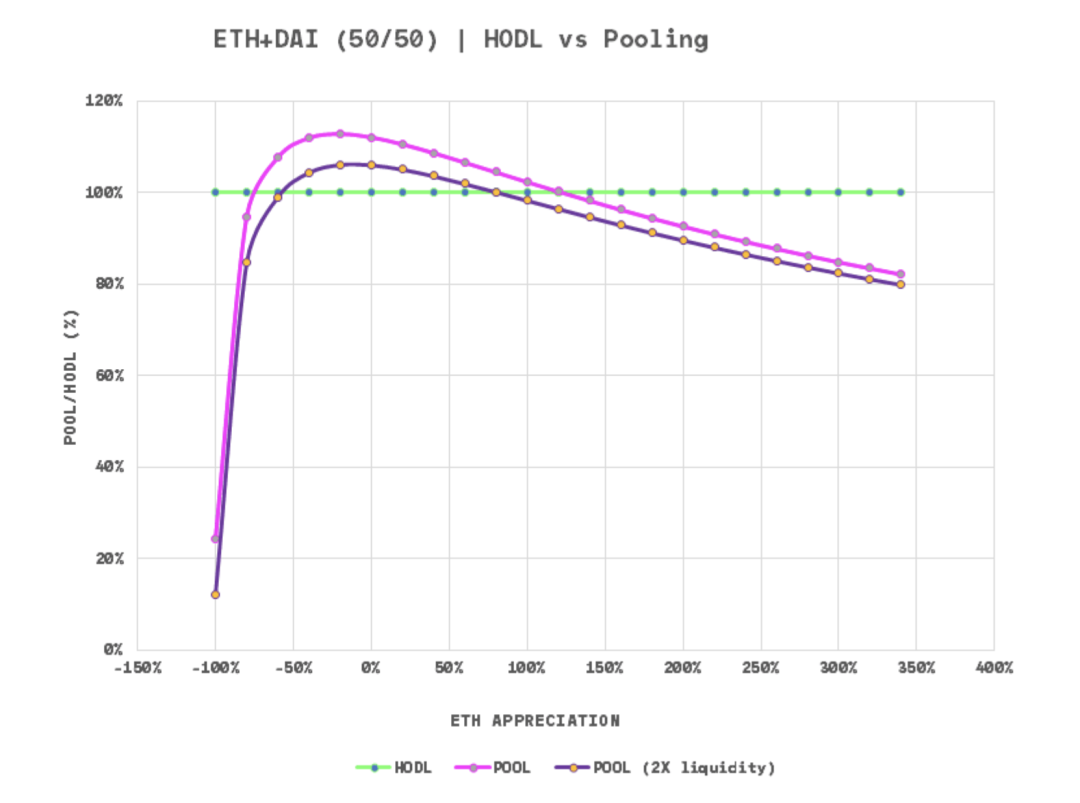
Unsurprisingly, as the liquidity in the pool increases, the transaction fees received by individual contributors become less, causing the entire curve to move down. This means that the pool of winning the pool strategy narrows.
Original range: -80% to + 120%
After doubling the size of the capital pool: -60% to + 80%
It should be noted that if the liquidity doubles and the transaction volume doubles, then the two factors will cancel each other out (2 x 1/2 = 1). Therefore, the influencing factors for liquidity providers are actually: the change in trading volume relative to the liquidity scale.
Considering this factor, let's bring all the factors together to see a more complete spectrum of Chiju vs Tuncoin, including price variables vs trading volume / liquidity variables:
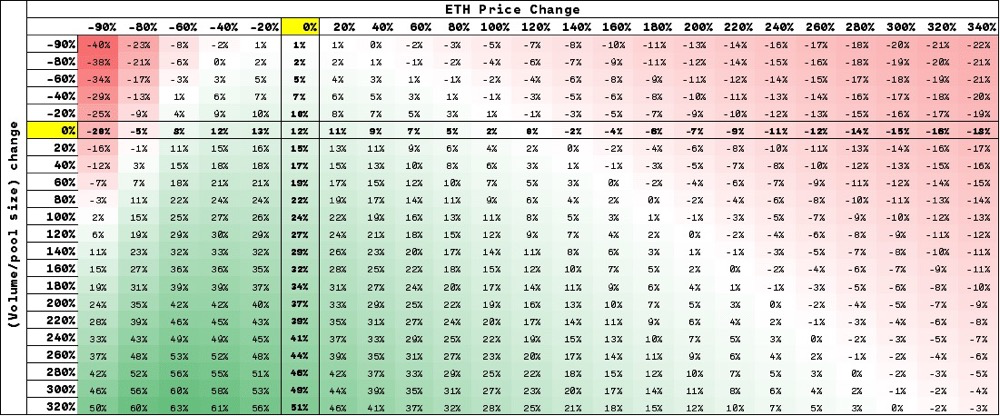
The assumptions in the above diagram: ETH = 100 DAI, transaction fee = 0.3%, fund pool size = 30,000 ETH, monthly transaction amount = 200,000 ETH, holding time = 1 year.
Historical evolution of the size of the capital pool and transaction volume
From the previous analysis, we can clearly see that we not only need to observe the changes in asset prices, but also need to pay attention to the trend of changes in the size of the capital pool and the transaction amount.
Fortunately, Uniswap provides information about the fund pool and transaction amount: https://uniswap.info/
Historical change of DAI-ETH pool liquidity
First look at the evolution of liquidity (capital pool size) in the past few months:
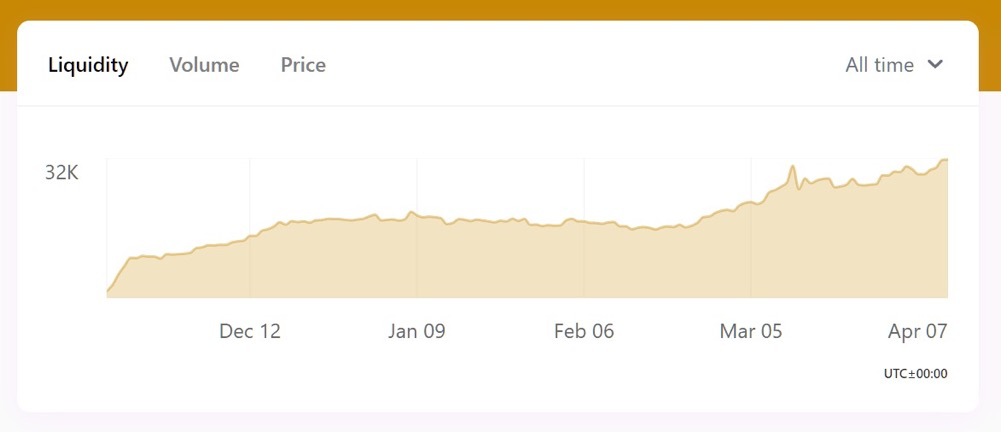 Information from uniswap.info as of April 7, 2020
From December last year to mid-February this year, liquidity remained at around 16,000 ETH. Since then it has grown and currently reaches the level of 32,000 ETH. In about 3 months, the size doubled.
Historical changes in DAI-ETH trading volume
Let's look at the changes in the transaction volume of this fund pool during the same period. In other words, how much ETH has been replaced by DAI:
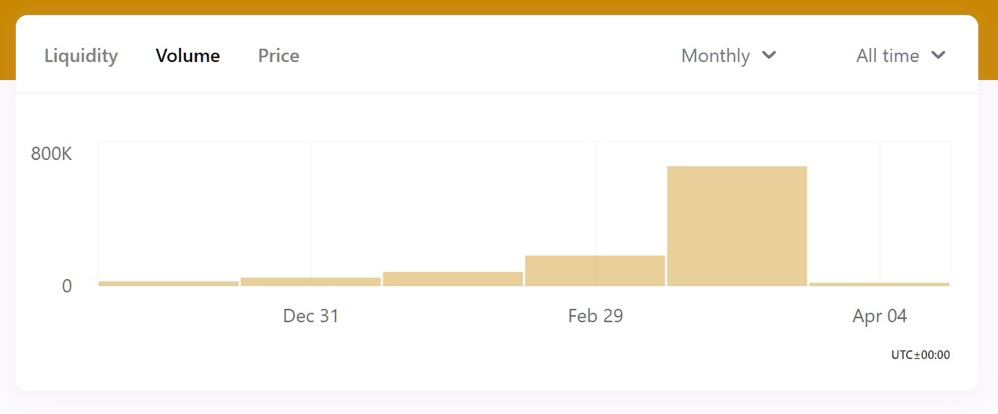
The size of the pool has doubled in about three months, and the transaction volume has almost doubled in one month! During the period from November last year to February this year. Since then, the trading volume in March has exploded (because of Black Thursday).
The following figure shows the merged data:
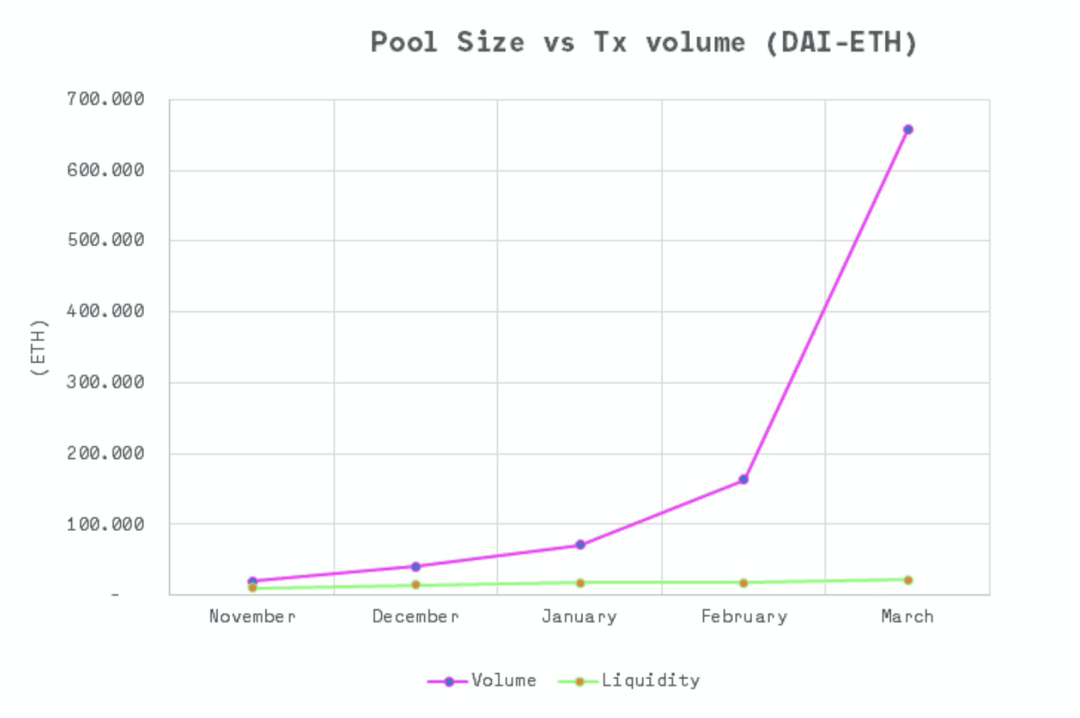
The black Thursday market shock in March severely distorted the chart. In order to see more clearly, we have made a graph of trading volume / liquidity, the ratio of November last year is set as a reference point:
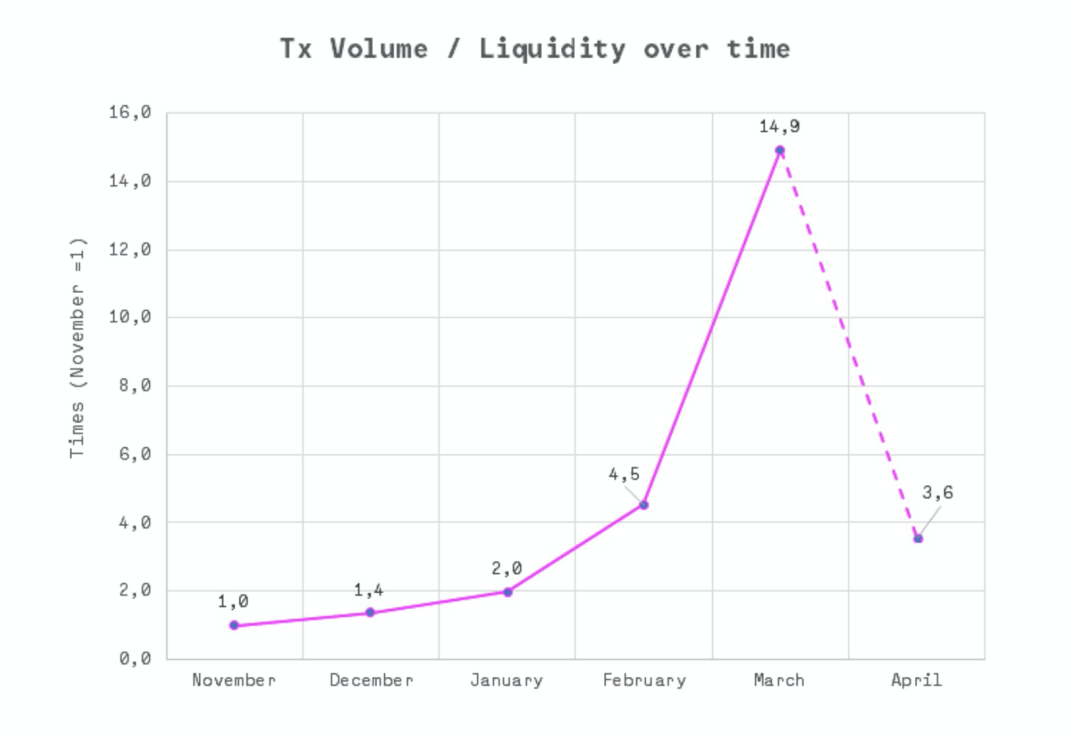
From November of last year to February of this year, this ratio rose to 4-5 times, while in March it rushed to 15 times. According to the current trend, the transaction volume in April will be 15-20 million ETH, which is similar to the level in February.
In any case, we can see that from November last year to February this year, the growth rate of transaction volume is much faster than the growth of liquidity. In the heat map we showed above, this means a sharp downward movement = this is a major positive for liquidity providers.
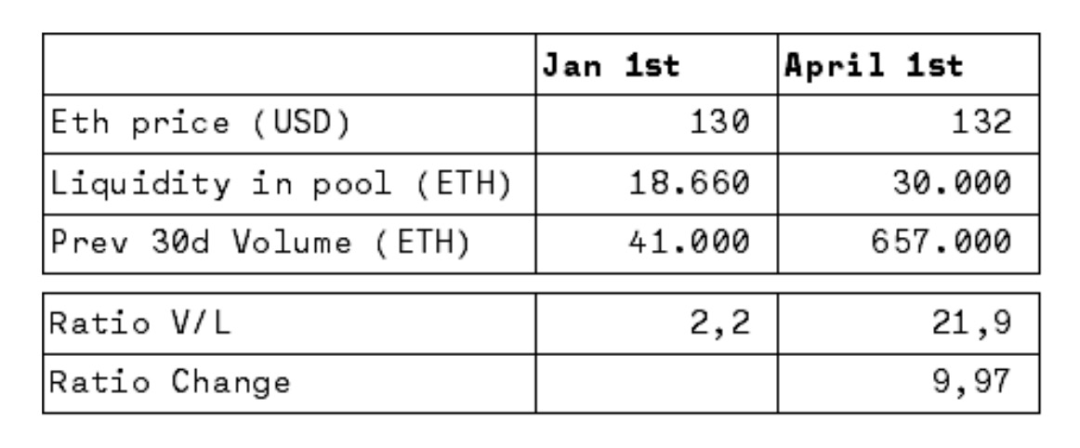
Look at the table below. This is the comparison between the price of ETH and the size of the capital pool from January 1, 2020 to April 1, 2020:
Looking at the following heat map, from January to April, the advantages of the pooling strategy over the Tuncoin strategy change:
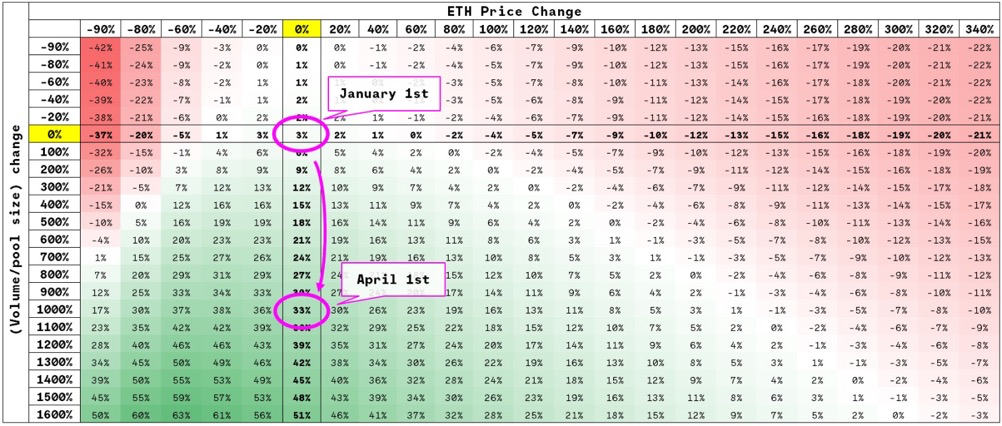
% = The return premium of Chiju strategy compared to Tuncoin strategy. Assumptions of the chart: Initial ETH price = 130 DAI, transaction fee = 0.3%, initial pool size = 18,660 ETH, initial monthly transaction amount = 41,000 ETH, holding time = 90 days.
During this period, the price of ETH was basically flat, and the ratio of trading volume / liquidity scale increased by 10 times. As a result, the liquidity provider's income during this period is nearly 33% higher than that of the Tunisian.
Black Thursday further proved the defensive nature of this strategy-as price volatility increased, the volume of transactions grew much faster than the growth of liquidity. This is a good thing for liquidity providers, because rising transaction fees hedge their losses on positions.
We will continue to monitor developments in this area, but so far we have found that changes in liquidity supply are much more modest compared to dramatic changes in transaction volume.
in conclusion
We see that with the help of AMM, people can invest their assets in the capital pool and get a return.
We see that compared with purely holding crypto assets, the pooling strategy may perform better or worse than the buy-and-hold strategy, which mainly depends on price changes and the ratio of trading volume / capital pool size.
The pooling strategy will outperform the Tuncoin strategy in two scenarios:
Sideways or moderately low market
The pooling strategy performed best when the price of the underlying asset fell slightly. If the price rises or falls sharply, the performance of the strategy will be lower than Tuncoin.
When the trading volume / liquidity ratio rises
When the growth rate of transaction volume exceeds the expansion rate of the capital pool, the fees charged will increase, which helps the pooling strategy outperform the Tuncoin strategy. On the contrary, if the growth of the capital pool is faster than the growth of the transaction volume, the cost of the single contribution will be reduced, and the interval for the strategy to maintain positive returns will also be narrowed.
Combined with the experience during Black Thursday, our analysis shows that, overall, this is a defensive strategy that performs very well during periods of price volatility and provides a good hedging when prices fall moderately.
In the future, it is worth noting whether solutions such as Gelato Finance will automate the entry / exit strategy, that is, serve as a stop loss.
One last thought
Nassim Taleb, author of the best-selling book "The Black Swan", strongly urged that "convexity" should be maintained when taking risks. What he means is that on both sides of the risk spectrum, there should be upside or optionality. Compared with pure coin holding, this special strategy of pooling is concave, which will cause you to suffer losses in any sharp movement of the price. In his terms, this is fragile.
Unless you have the tools to monitor changes in capital pools and pricing conditions and act quickly based on the changes, for most people, buying coins-holding coins (if possible, use some short selling to hedge!) May be more Security strategy.
We will continue to update Blocking; if you have any questions or suggestions, please contact us!
Was this article helpful?
93 out of 132 found this helpful
Related articles
- Babbitt Cloud Summit | Where is the path to open finance to crack the bottleneck of DeFi development?
- The latest report of the European Parliament: Crypto assets are not the same as CBDC. Global stablecoins will have a far-reaching impact (full text download)
- The anti-epidemic supplies company was fined for returning goods, this pot blockchain does not back!
- Foreign media views | Digital RMB is ushering in a golden stage, the People's Bank of China actively promotes legal digital currency
- To break the bottleneck of DeFi development, where is the open financial path? | Babbitt Cloud Summit
- Gemini co-founder: The new crown virus pandemic will become a historic turning point for Bitcoin
- Featured | What happens if you inherit 55,000 bitcoins?


