Ethereum price analysis on April 12

Key points
Ethereum's decline has widened and fell below the support of $170.
The seller got the incentive to push the price to the $160 support level.
- Bitcoin price analysis on April 12
- The libertarian think tank criticizes the US SEC's approach to cryptocurrency and blockchain
- Deng Jianpeng: “Drilling” activities such as polluting the environment without safe production conditions should be eliminated
On the hourly price chart, there is a major bearish trend line with resistance at $164.
The currency price continues to fall and may fall to the support level of $155 in the short term.
Ethereum price analysis
After struggling for a while at the $185 support level, Ethereum began to fall. Ethereum's bearish momentum has strengthened and has fallen below the $175 and $170 support levels. However, the selling pressure continued to increase, and Ethereum fell below the $165 support level and the 100-hour SMA shortly after. This led to more losses and the price moved in the direction of the $160 support level. At present, the price is consolidating the decline above 160 US dollars, and the angle is bearish.
If the price goes up, the initial resistance is at $164 and the last 23.6% Fibonacci retracement (from a high of $185 to a low of $160). On the hourly price chart, there is a major bearish trend line with resistance at $164. The previous $165, which was expressed as a support level, was also converted to resistance. If the price can close above $165, Ethereum will likely rebound to $172. The price coincides with the last 50% Fibonacci retracement (from a high of $185 to a low of $160), and the 100-hour SMA is also at $172.
If the price falls, the $160 will continue to play a supporting role. But falling to $155 is not impossible. The $155 support is very important. If the price falls below $155, Ethereum will likely slip to $142.
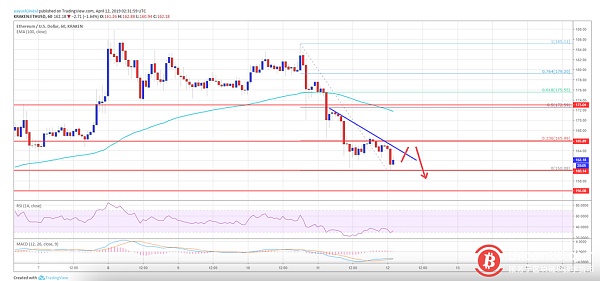
As can be seen from the chart, Ethereum fell sharply and fell below the support level of $170 and $165. The last one is now 唉155 USD, and the price may encounter buyers when it reaches this price. If you want to start a decent rebound, the price must rise above $165 and $172. Only in this way, it is possible for Ethereum to return to the resistance level of $185.
Technical indicator signal
MACD per hour – MACD moves slowly within the bearish range
RSI per hour – RSI is now well below 50 water, currently close to 32
Main support level – $155
Main resistance level – $172
Author: Kiran
Remarks: Bitcoin86 manuscript article, please indicate the source. The article is an independent view of the author and does not represent the standing position.
Disclaimer: This article market analysis is for reference only and does not constitute any investment advice or advice. Risk control, thank you.
We will continue to update Blocking; if you have any questions or suggestions, please contact us!
Was this article helpful?
93 out of 132 found this helpful
Related articles
- Bitcoin fell below $5,000, and the final surrender of prices began?
- USDT continues to have a high premium and enthusiasm for a further increase of US$300 million.
- ATM bitcoin payment through lightning network is becoming a reality
- CoinNess analyst: BTC is short-term bullish, "model currency" has reached the escape period
- V Shenfa Bo: What should the correct speculative posture be?
- According to reports, Russian social media giant VK Eyes is considering launching its own cryptocurrency
- The ultimate way out of cryptocurrency exchanges: decentralization (below)


