Ethereum price analysis on April 11

Key points
Ethereum prices continued to rise, but failed to break through the $185 gain.
The currency price began to move downwards and fell below the support of $180 and $174.
- Bitcoin price analysis on April 11
- Goldman Sachs really want to do cryptocurrency transactions? Why is JP Morgan Chase?
- Early warning: wavefield dapp may become a new target for hackers
In the downturn, Ethereum fell below this important bullish trend line this week, with support at $178.
Ethereum still has the potential to fall further, but can still find support above $165.
Ethereum price analysis
Yesterday, we discussed the possibility of Ethereum breaking through $180. Ethereum did break through the resistance levels of $180 and $182. Although the rally was urgent, it did not break through $185. And Ethereum was also rejected in the last 61.8% Fibonacci retracement of the fall (from a high of $188 to a low of $174), which triggered a new round of sharp decline and fell to $182. Below $180.
More importantly, Ethereum fell below this week's important bullish trend line during the downtrend, with trend line support at $178. The pair even fell below the $174 support level and formed a low of $170.6. Recently, Ethereum has risen a few points above the $173 and the last drop of the 23.6% Fibonacci retracement (from a high of $185 to a low of $170). However, the currency price faced strong resistance near the breakout of the trend line and around $178.
In addition, the last 50% Fibonacci retracement (from a high of $185 to a low of $170) also represented a resistance level. Ethereum is currently trading under $178 and $180 below the bearish. Therefore, the price is likely to fall below $174 and below $172. It is also possible to fall back below $170. The next major support is at $165, and if the price reaches this level there may be a large number of buyers.
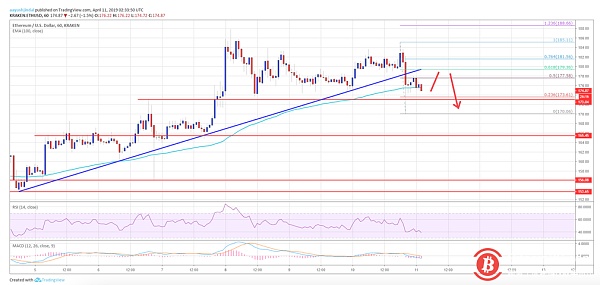
As can be seen from the chart, the Ethereum price began to show a significant downward correction from the resistance level of $185. Therefore, Ethereum is completely at risk of falling below $170. Having said that, the $165 level may be a large price for buyers. Conversely, if the price falls below $165, Ethereum will likely return to the support level of $156.
Technical indicator signal
MACD per hour – MACD gains momentum in the bearish range
RSI per hour – RSI fell sharply below 50, currently close to 40
Main support level – $170
Main resistance level – $180
Author: Kiran
Remarks: Bitcoin86 manuscript article, please indicate the source. The article is an independent view of the author and does not represent the standing position.
Disclaimer: This article market analysis is for reference only and does not constitute any investment advice or advice. Risk control, thank you.
We will continue to update Blocking; if you have any questions or suggestions, please contact us!
Was this article helpful?
93 out of 132 found this helpful
Related articles
- Bitcoin's new high 5400 US dollars, the upper and lower pins burst
- Market Analysis: On April 11th, Jianbi Qingye, stopped to rectify
- Remittance giant Western Union remittance integrates cryptocurrency wallet, making it easier for Filipino users to receive remittances
- The secret of the currency is well known: the so-called wealth freedom is nothing but a plunder
- Head of the International Monetary Fund (IMF): Digital currency is “inciting the banking system” and must be monitored to maintain stability
- Economic Daily: Technology such as blockchain fundamentally changes the path of factor flow and spatial allocation
- KPMG polls show that blockchain adoption is not a priority for finance executives