Ethereum price analysis on May 6

Key points
Ethereum has a downward revision, but is still above the key support of $156-$157.
If the price goes up, Ethereum will face several important resistance levels, such as $162 and $163.
- Seeing the systemic risk of Tether (USDT) from the trend of USDT
- Is it still possible to buy Bitcoin now?
- Bitcoin price analysis on May 6
On the hourly price chart, there is a short-term downtrend channel with resistance at $163.
A further increase will occur if the pair must remain above the $156 support level.
Ethereum price analysis
Recently, Ethereum prices have seen a good rise and broke through $165. However, Ethereum did not hold the previous gains during the $170 climb and failed to break the resistance of $168-$169. Ethereine then fell and fell below the $165 and $163 levels. Soon after, the price even fell below the $160 and 100-hour simple moving average. However, prices have encountered a large number of buyers in the range of $156-$157.
Subsequently, Ethereum rose to $162 and the last 23.6% Fibonacci retracement (from a high of $169 to a low of $157). The signs of recovery are very clear, but $163 is a strong resistance. The price is also at the same time as the 50% Fibonacci retracement of the last decline (from a high of $169 to a low of $157). Therefore, Ethereum is lower again, but above the support level of $156-$157. If the buyer fails to hold the support level of $157, the price may fall further.
The next major support is around $155. If Ethereum falls below this price, the price will move towards $150. On the other hand, if the price rises, Ethereum must break through the resistance level of $163 to start a new round of gains. On the hourly price chart, there is a short-term downtrend channel with resistance at $163.
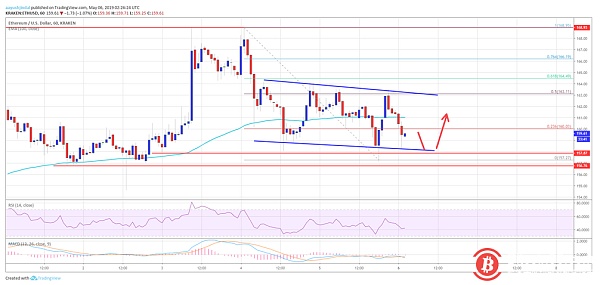
As you can see from the chart, Ethereum may have a period of range fluctuations above $157 before the next step. As long as bitcoin prices continue to rise, Ethereum will have a chance to be boosted. If Ethereum falls below $155, it may put a lot of pressure on the bulls in the short term.
Technical indicator signal
MACD per hour – MACD is currently in a bearish range
RSI per hour – RSI has recently fallen below 50, but remains above 40
Main support level – $157
Main resistance level – $163
Author: Kiran
Remarks: Bitcoin86 manuscript article, please indicate the source. The article is an independent view of the author and does not represent the standing position.
Disclaimer: This article market analysis is for reference only and does not constitute any investment advice or advice. Risk control, thank you.
We will continue to update Blocking; if you have any questions or suggestions, please contact us!
Was this article helpful?
93 out of 132 found this helpful
Related articles
- Does Buffett still have enough bitcoin?
- Bitcoin confirms daily trading volume to the highest level in 16 months
- May 6 madman market analysis: trump or re-launched against BTC to take the upper US dollar?
- Monthly News | Bitcoin prices have risen sharply, is the bull market coming?
- Buffett and Bitcoin: The old stubborn new technology that I don’t understand has always been a rumor
- Will Belarus be the first country to use nuclear power for bitcoin mining?
- Brazilian police arrest suspect suspected of using money laundering to launder money


