Bitcoin price analysis on May 6

Key points
Bitcoin has fallen back after breaking through $5,800.
The price of the currency fell below $5,700 and tested the key support at $5,580.
- Does Buffett still have enough bitcoin?
- Bitcoin confirms daily trading volume to the highest level in 16 months
- May 6 madman market analysis: trump or re-launched against BTC to take the upper US dollar?
On the hourly price chart, there is a key bullish trend line formed with support at $5,600.
As long as Bitcoin is above $5,540 and $5,600, the price is likely to return above $5,700.
Bitcoin price analysis
Last week, Bitcoin rose sharply and the price of the currency broke through the resistance of $5,700. The price even broke through the $5,800 and 100-hour simple moving average. After forming a new high of 20,837 in 2019, the currency price began to be revised downward. Although Bitcoin has fallen below the $5,700 support level and $5,650, it is still above the $5,540 and $5,580 support levels.
More importantly, Bitcoin still holds 100 hours of SMA and is above $5,600. On the hourly price chart, there is a key bullish trend line formed with support at $5,600. The first resistance is $5,685 and the 50% Fibonacci retracement of the last decline (from a high of $5,782 to a low of $5,584). However, the most important resistance is still at the $5,760 level and a bearish trend line in the same chart. Bitcoin's successful close at $5,760 and $5,780 may drive prices to $5,800 and $5,850.
On the other hand, if the price falls, the main support is at $5,600 and the 100-hour SMA. Below $5,600, the next major support is at $5,540. If the price really goes to this level, it will encounter many buyers. However, once the price falls below $5,540, the price will likely return to $5,420. If it is further reduced, Bitcoin will likely move to $5,200 and $5,100.
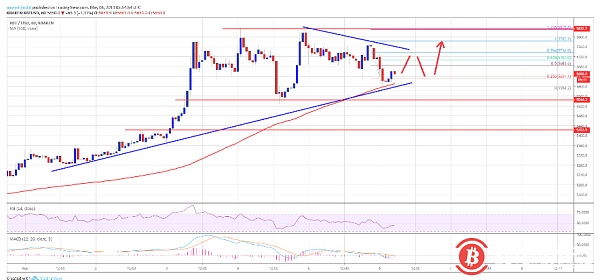
As can be seen from the chart, the current transaction price of Bitcoin is significantly higher than the important support of $5,600 and $5,580. Therefore, there is an opportunity for Bitcoin to rise above $5,700 and $5,760. If the bull market regains momentum, the bitcoin price will likely hit a new high in 2019, which is higher than $5,850.
Technical indicator signal
MACD per hour – MACD is currently in a bearish range
RSI per hour – RSI is currently recovering, but still well below 50
Main support level – $5,600 and subsequent $5,540
Main resistance levels – $5,680 and $5,700 and $5,760
Author: Kiran
Remarks: Bitcoin86 manuscript article, please indicate the source. The article is an independent view of the author and does not represent the standing position.
Disclaimer: This article market analysis is for reference only and does not constitute any investment advice or advice. Risk control, thank you.
We will continue to update Blocking; if you have any questions or suggestions, please contact us!
Was this article helpful?
93 out of 132 found this helpful
Related articles
- Monthly News | Bitcoin prices have risen sharply, is the bull market coming?
- Buffett and Bitcoin: The old stubborn new technology that I don’t understand has always been a rumor
- Will Belarus be the first country to use nuclear power for bitcoin mining?
- Brazilian police arrest suspect suspected of using money laundering to launder money
- Samsung invests $2.9 million in encryption hardware startup Ledger
- Japan will provide encryption supervision solution for G20
- Bitfinex CFO: Bitfinex needs "a few weeks" to unfreeze funds


