How many entities hold Bitcoin? These 7 exchanges are worth watching
Written by: Rafael Schultze-Kraft
Translation: Lu Jiangfei
Source: Chain News
Problems with quantifying the number of Bitcoin users
For Bitcoin researchers and investors, one question is always lingering in their minds: How many people actually own and use Bitcoin?
- 4D Long Text: Underrated Ethereum
- US presidential candidate Andrew Yang likes Bitcoin? These 7 points can prove
- Bai Shizhen: Proposal to issue encrypted digital currency "belt currency" to improve cross-border payment systems in countries along the "Belt and Road"
Even if you can access the entire transaction history of Bitcoin through an open ledger, it is not easy to accurately evaluate the number of users in the Bitcoin network.
Until now, the number of addresses in the Bitcoin network has been used as a reference for the number of Bitcoin users / holders. But everyone knows that this is wrong, because there is not a one-to-one mapping relationship between users and Bitcoin addresses, and:
- Bitcoin addresses can deposit funds from multiple people (such as exchange addresses);
- A single entity can also own and control multiple Bitcoin addresses to hold BTC.
How to use the address to get the exact number of Bitcoin users
In order to be able to more accurately estimate the actual number of users in the Bitcoin network and understand how this number changes over time, we need more advanced statistical methods.
At Glassnode, we have been trying to solve these problems with an "integrated" statistical solution, including industry-standard heuristics, proprietary clustering algorithms, and advanced data science methods based on data on the original chain.
In this article, through aggregation and advanced data science analysis of a new generation of entity-based on-chain indicators, we can obtain relatively more accurate statistical results and set a new upper limit for the number of entities holding Bitcoin. For now, this work we are doing should be the first professional Bitcoin entity quantification method introduced in the crypto industry, and its statistical scope is also better than the simple address counting method and the simpler heuristic exploration statistical method. .
Entity, not user
When using our statistical method, it should be noted that this method can only solve one of the two confounding factors mentioned above, that is, using Bitcoin addresses as a statistical standard for the number of users, and our method can map multiple addresses to Related to a single entity.
In addition, we did not consider the case where a single Bitcoin address has multiple user funds: In this case, the address holding the Bitcoin is still controlled by a single entity above the network level, such as an exchange, so we refer to the number as "Entities", not so-called "users" or "individuals".
Through research, we have implemented a series of real-time on-chain indicators that can be used in real-time on Glassnode Studio and through our application program interface (API):
- Number of new entities The number of unique independent entities that first appeared in a Bitcoin network transaction.
- Net growth of the entity The net growth of the only independent entity in the network. This indicator defines the difference between a “new entity” and a “disappearing entity” (“disappearing entities” refers to those entities with zero account balance in the previous Account balance is not zero in timestamp).
- Number of "giant whales" Number of unique independent entities with at least 1,000 BTC.
- Number of active entities The number of unique independent entities that are active. Such unique independent entities are either transaction senders or receivers.
- Number of Bitcoin Sending Entities The number of unique independent entities acting as Bitcoin senders.
- Number of Bitcoin Receiving Entities The number of unique independent entities acting as Bitcoin recipients.
Note: Because our physical indicators rely on aggregation technology and statistics that change over time, these indicator values are variable, which means that the latest data points may change slightly over time. However, we have established the necessary mechanisms to obtain highly stable values in order to keep statistical fluctuations to a minimum (less than 1% on average).
Quantifying the number of Bitcoin entities
The statistical results obtained using our method are shown below.
For comparison, Figure 1 shows the number of new entities and new addresses entering the Bitcoin network each day.
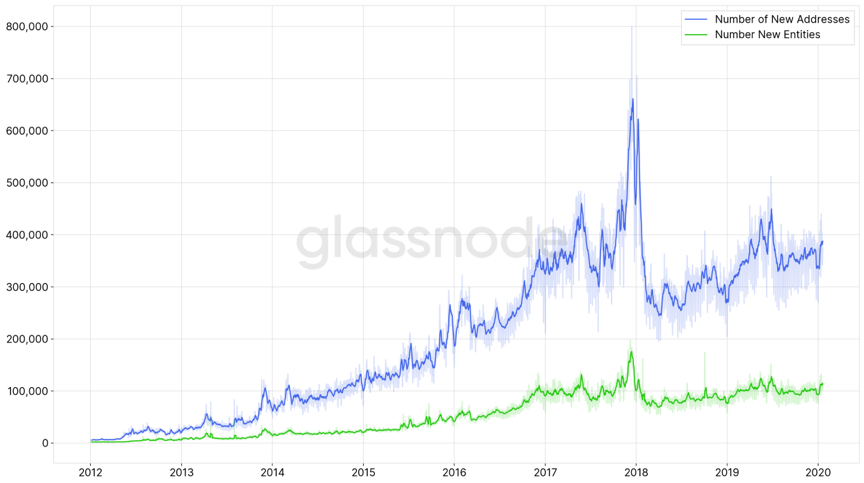 Figure 1-The average daily number of addresses / entities that first appeared in a transaction in the Bitcoin network.
Since our method clusters addresses into "entities", the final number of new entities represents only a small number of new addresses in the Bitcoin network. For example, in 2019, the daily average number of new addresses added to the Bitcoin network exceeded 355,000, compared with just over 100,000 new entities per day, accounting for about 28%.
Figure 2 shows the changes in the ratio of new addresses and entities in the Bitcoin network over time.
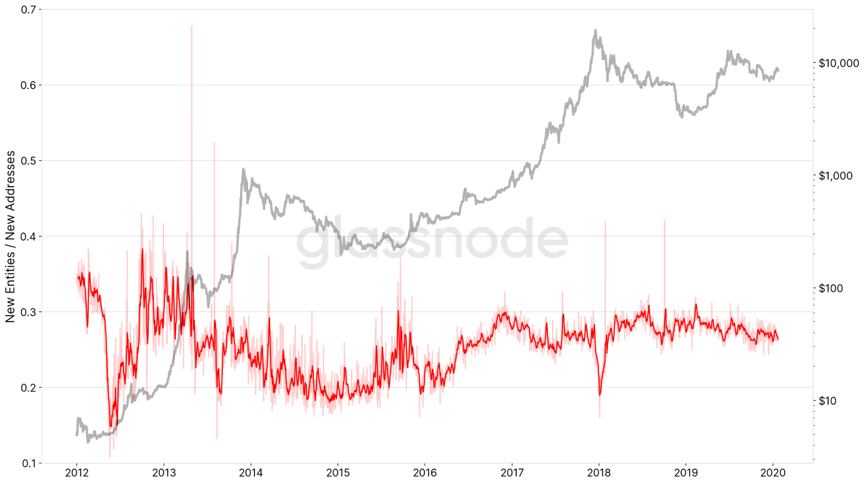 Figure 2-The ratio of daily new entities and daily new addresses in the Bitcoin network.
It is worth noting that the ratio data in Figure 2 provides some potential information. For example, at the beginning of 2018, we saw a clear downward peak, which indicates that the difference between the new address and the new entity is increasing, which also means that the activity in the network actually comes from the increase in activity of existing users, and Not a new user (the new address is actually a change of the existing user's address).
A comparison between the number of daily active addresses and the number of active entities also yields a very similar graph:
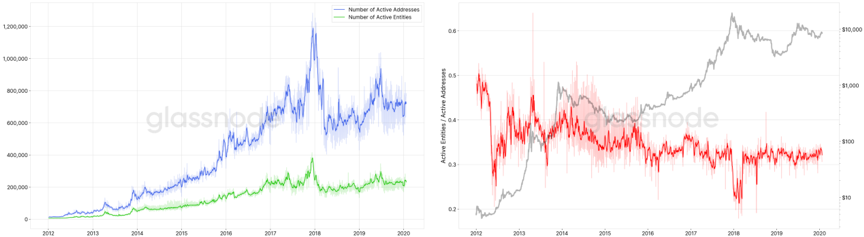 Figure 3-Left: Number of daily active addresses and entities. Right: Ratio between active entities and addresses.
So how many entities hold Bitcoin?
Figure 4 depicts the average daily net growth of entities in the Bitcoin network. Compared with the number of new entities, this indicator also reflects the difference between "disappearing entities": "disappearing entities" refers to those entities with a zero balance but a non-zero balance in the previous time stamp.
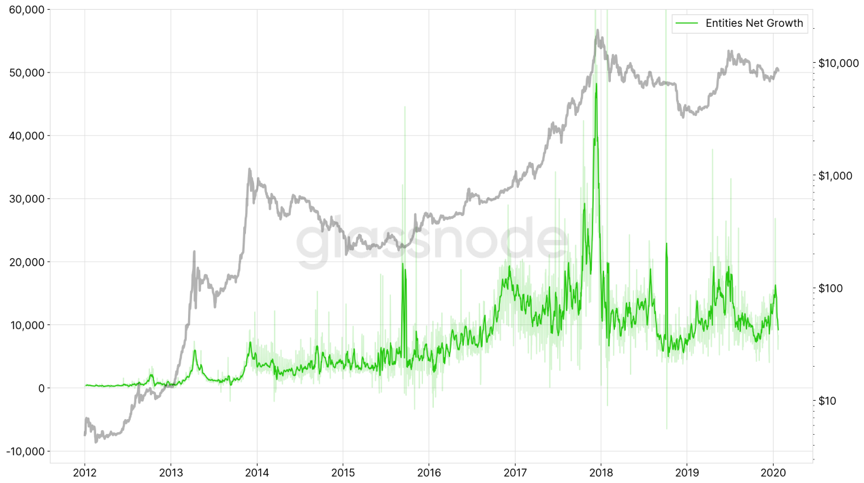 Figure 4-Daily average net growth of entities
Using the cumulative summary over this time series, we can obtain an estimated number of entities at each given point in time. Figure 5 shows the comparison of the number of non-zero addresses and the number of entities.
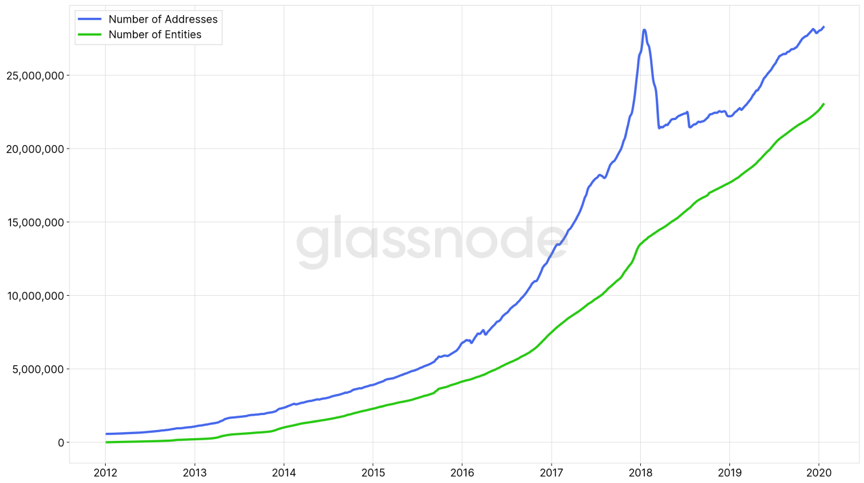 Figure 5-Address / total number of entities with non-zero account balance.
According to our analysis, as of January 2020, the number of entities holding Bitcoin is approximately 23.1 million, which is 18.5% less than the current non-zero account balance address (approximately 28.4 million).
Not only that, it is worth noting that the number of entities is increasing in one direction. When we analyze the entity data, we will find that the number of addresses is slightly different. In early 2018, the number of Bitcoin addresses dropped sharply.
According to our analysis, as of January 2020, the number of on-chain entities holding Bitcoin is approximately 23.1 million.
Bitcoin's growth performance is relatively healthy
Comparing the average daily physical growth and the net growth of the address (Figure 6) is very valuable. From the results, it can be found that the fluctuation of Bitcoin address growth is significantly higher than the physical growth, and it also has a large amplitude deviation (whether it is a positive or negative deviation).
More importantly, the average daily net growth of the entity is always positive: in the history of Bitcoin, so far, the net growth of the entity has been negative for only 21 days.
This indicator clearly shows that the popularity of Bitcoin has been healthy and sustainable in the past ten years.
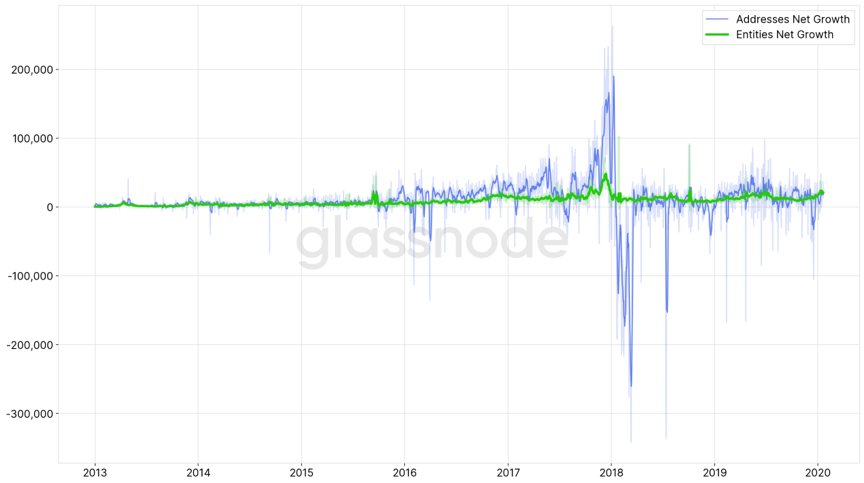 Figure 6-Comparison of daily average addresses and net growth of entities.
Number of “ Bitcoin Giant Whales ''
In our on-chain indicator analysis list, there is another entity-based indicator: the number of "bitcoin whale". For the concept of a giant whale, we consider a giant whale to mean an entity holding ≥1,000 BTC. For giant whales that do not rely on a single address, this indicator provides more accurate statistics (note: we exclude entities marked as exchanges in these numbers).
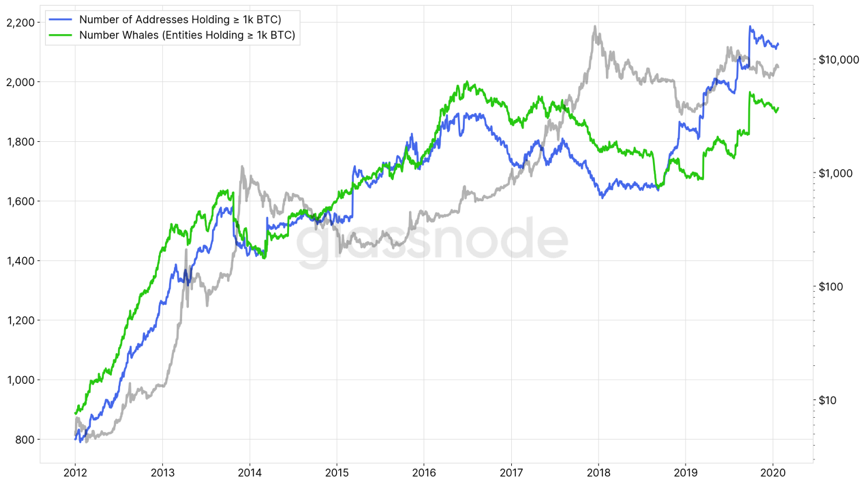 Figure 7-Number of addresses / entities holding ≥ 1,000 Bitcoins.
Although both curves show similar trends, there are significant differences in the number of addresses and entities holding ≥1,000 bitcoins, allowing us to more accurately estimate the behavior of giant whales at a particular moment in a particular market cycle .
Distribution statistics
The following figure describes the relationship between the number of entities and the size of the entity (the number of addresses the entity controls).
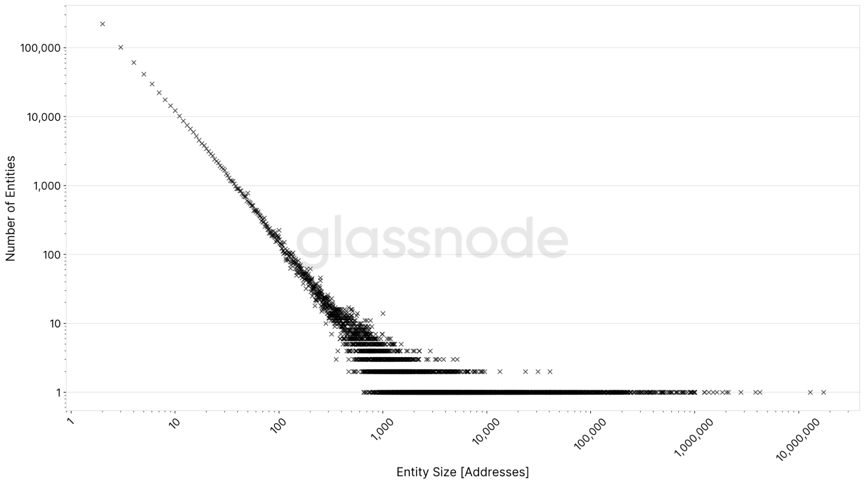 Figure 8-January 2020, the distribution of the number of entities relative to the size of the entities (divided by cluster address).
The figure above shows a clear power-law relationship, with entities ranging from an entity with a single address to a cluster of entities with up to 22 million addresses (such as Coinbase).
It should be noted that the results of our analysis show that most cluster-like entities (approximately 96%) still consist of one address. Therefore, we also set a strict upper limit on the number of Bitcoin entities. Due to the inclusion of potentially missing links, the actual number of entities may be lower than the upper limit we provide.
Similarly, the number of entities and the corresponding balance reveal a power-law distribution relationship, most of which (about 22.3 million) hold at least less than 1 BTC (in the distribution diagram below, we ignore this part of the entity).
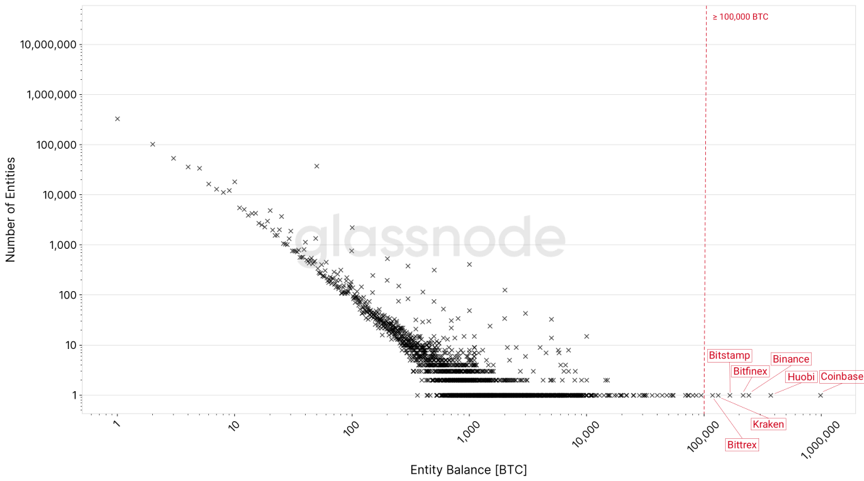 Figure 9-Distribution of the number of entities with respect to their Bitcoin balance (January 2020). All entities with a balance of more than 100,000 Bitcoin are cryptocurrency exchanges.
As of January 2020, 75 entities hold more than or equal to 10,000 bitcoins, and 7 entities hold more than or equal to 100,000 bitcoins-all these entities are cryptocurrency exchanges: Coinbase (983,800 BTC), Huobi (369,100 BTC), Binance (240,700 BTC), Bitfinex (214,600 BTC), Bitstamp (165,400 BTC), Kraken (132,100 BTC), and Bittrex (118,100 BTC).
The 7 richest entities (exchanges) control 2,350,000 BTC, which is equivalent to about 13% of the circulating bitcoin supply.
Below is a chart comparing bitcoin balances on cryptocurrency exchanges.
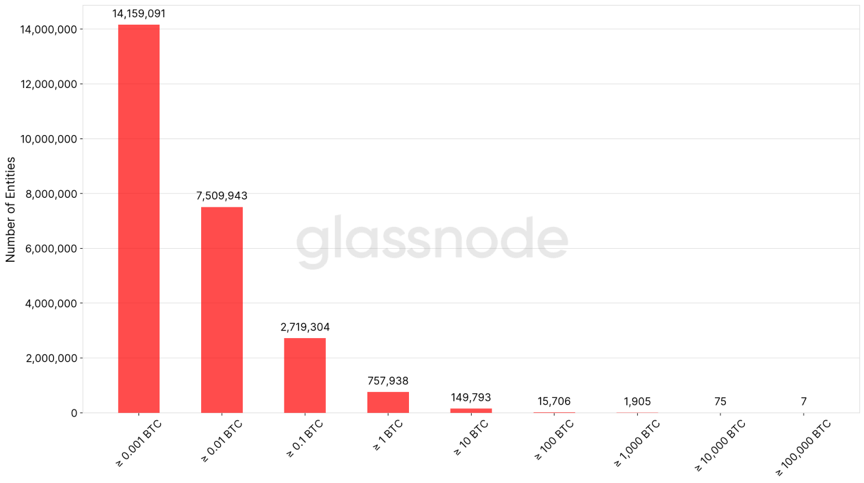 Figure 10-Distribution of account balances of entities in the Bitcoin network (January 2020).
Source link: medium.com
We will continue to update Blocking; if you have any questions or suggestions, please contact us!
Was this article helpful?
93 out of 132 found this helpful
Related articles
- Zuckerberg: Libra is fully handled by the foundation, and Facebook is developing the Libra wallet
- Despite bank ban, cryptocurrency exchange Zebpay reopens in India
- Red Cross, we have a way for you: it's time for some new technology!
- Reflecting on the epidemic in Wuhan, what can the blockchain do for disease control and early warning?
- "Digital Dollar" latest details: or similar to the central bank's digital currency
- Popular Science | Extended Blockchain: ZK-Rollup
- Former JPMorgan Chase R & D: Why isn't the IBM blockchain real blockchain?