In-depth data reporting | Global digital currency market activity status
China is already the super red sea in the digital currency market competition. How to expand overseas markets and explore new traffic growth points is the main problem facing most exchanges. This report attempts to evaluate the status quo of digital currency market activity in each country through comparative analysis of various dimensional data. The author has found that TOP20 countries account for the total global activity through long-term tracking of changes in digital currency flows in 185 countries and 53 exchanges. 74.74%, the remaining 165 countries together accounted for 25.26%. For an exchange or any other blockchain product, there is always more choice than global effort in global market expansion. If you unfortunately choose one of the 165 countries, it is very likely that you will get twice the result.
The main conclusions of this report are as follows:
- Countries such as the United States, Russia, Brazil, Turkey, Indonesia, Japan, Ukraine, Poland, Thailand, South Korea, Mexico, and Australia have high-trading regional exchanges with strong local strength and high barriers to entry; while the United Kingdom, Vietnam, Countries such as Germany, France, the Netherlands, Spain and Canada have strong trading demand, but lack local exchanges, which can be the focus of the exchange's overseas market.
- South American countries represented by Venezuela and Argentina, and African countries represented by Sudan and Nigeria, although the transaction volume is not high, their legal currency system is unstable and the inflation rate is high. Users tend to configure digital currency and hedge through over-the-counter trading. The risk of legal currency has strong demand for use and can be used as a reserve in the blue ocean market.
- India, Slovenia, the Philippines, Venezuela, Pakistan, Nigeria and other countries have a high public opinion but low transactional heat, which is a high-potential growth market and sustainable observation.
- In the study of Japan and South Korea, it was found that there are very few global exchanges from Japan and South Korea. Japanese users are mainly concentrated in local exchanges such as Bitflyer, Zaif, Bitbank, and Coincheck. Korean users are also concentrated in local transactions such as Upbit and Bithumb. All. In addition to local strong exchanges, users in Japan and South Korea have shown strong “closedness” characteristics. Therefore, the author believes that Japan and South Korea do not have a good overseas market expansion target.
Next, the author will start with the activity statistics model in order to display as much data details as possible, which will provide a little thought for the domestic digital currency industry in terms of global market expansion.
Introduction to the Statistical Model of Market Activity in the Global Digital Money Market
- QKL123 blockchain list | Market value continues to concentrate, domestic media is hot (August 2019)
- Is the opportunity for Bitcoin coming? Global $17 trillion negative-yield bonds allow more investors to vote for Bitcoin
- Boxing champion Pacquiao wants to send coins, heavy punches or digging holes?
The author explores the dynamics of the digital money market in various countries through the distribution of activity in the global market, such as trading heat, tool heat and public opinion. Among them, the transaction heat covers the exchange traffic and the distribution of OTC traffic; the tool class heat mainly refers to the market traffic of the market and the distribution of the traffic of the blockchain browser; the public opinion is distributed globally with the search heat of the “BTC” entry. The situation is reflected. The weight is as shown in the figure below.
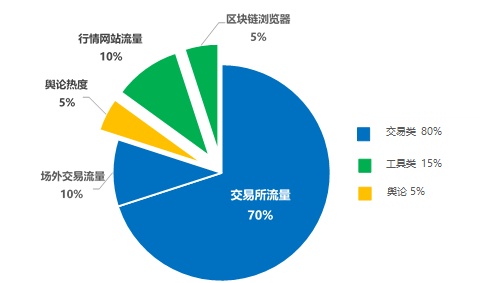
Graphic: Statistical model of global digital currency market activity
Note: The traffic of this report refers to the average monthly PV monthly data of the Web terminal 2019.5-7, and the data are all from similarweb.
In terms of weight distribution, the author mainly made these thoughts. First, the trading heat of a certain region can directly reflect the activity of the region. Therefore, the traffic of the exchange and the traffic of the OTC website are the first relevant data. The author gives 70% of the traffic of the exchange. However, the over-the-counter data is not objective, and it is inevitably beneficial to areas with inconvenient access. Some areas with unobstructed access to capital are mostly conducted inside the exchange, and there is no need to access vertical OTC websites. Therefore, the author only gave Over-the-counter trading is 10% weighted. Quotes sites such as CMC and CoinGecko are the entry-level tools that most digital currency traders need to use, and they are also a huge traffic entry for the digital currency industry, so they are also given a 10% weight. The blockchain browser is also a tool, but it is an advanced tool category. The user frequency of a slightly professional point is higher and does not have universality. Therefore, the author gives it 5% weight. In terms of public opinion, because it is mainly through GoogleTrends statistics, and Google is not a universal universal search engine, and the public opinion is highly susceptible to political events, it will cause a rapid increase in search in the short term, so it is only given to it. 5% weight. In addition, due to the language restrictions and usage habits of the blockchain media, it is too regional, and this model has not been referenced.
- Global market activity overall ranking – the United States, Russia, Brazil separated TOP3
Based on the above model and at the same time weighted blessing, the overall ranking of the TOP20 countries' market activity is as shown in the following figure. The author sets the global total activity to 100%, and the ordinate represents the share of national activity. The statistics involved a total of 185 countries, of which TOP20 countries accounted for 74.74% of the total global activity, and the remaining 147 countries shared 25.26%.
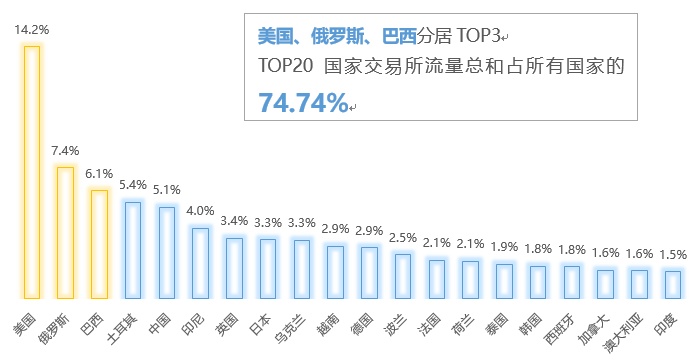
The above chart data comes from the weighting of each dimension data according to the model. Next, the detailed data of each dimension will be displayed.
- The flow of exchanges on the exchanges of trading heat – the United States and Russia ranked TOP 1-3, China ranked fifth. The UK, Vietnam, Germany, France, the Netherlands, Spain and Canada do not have strong local exchanges, and the traffic is also considerable, which can be focused on.
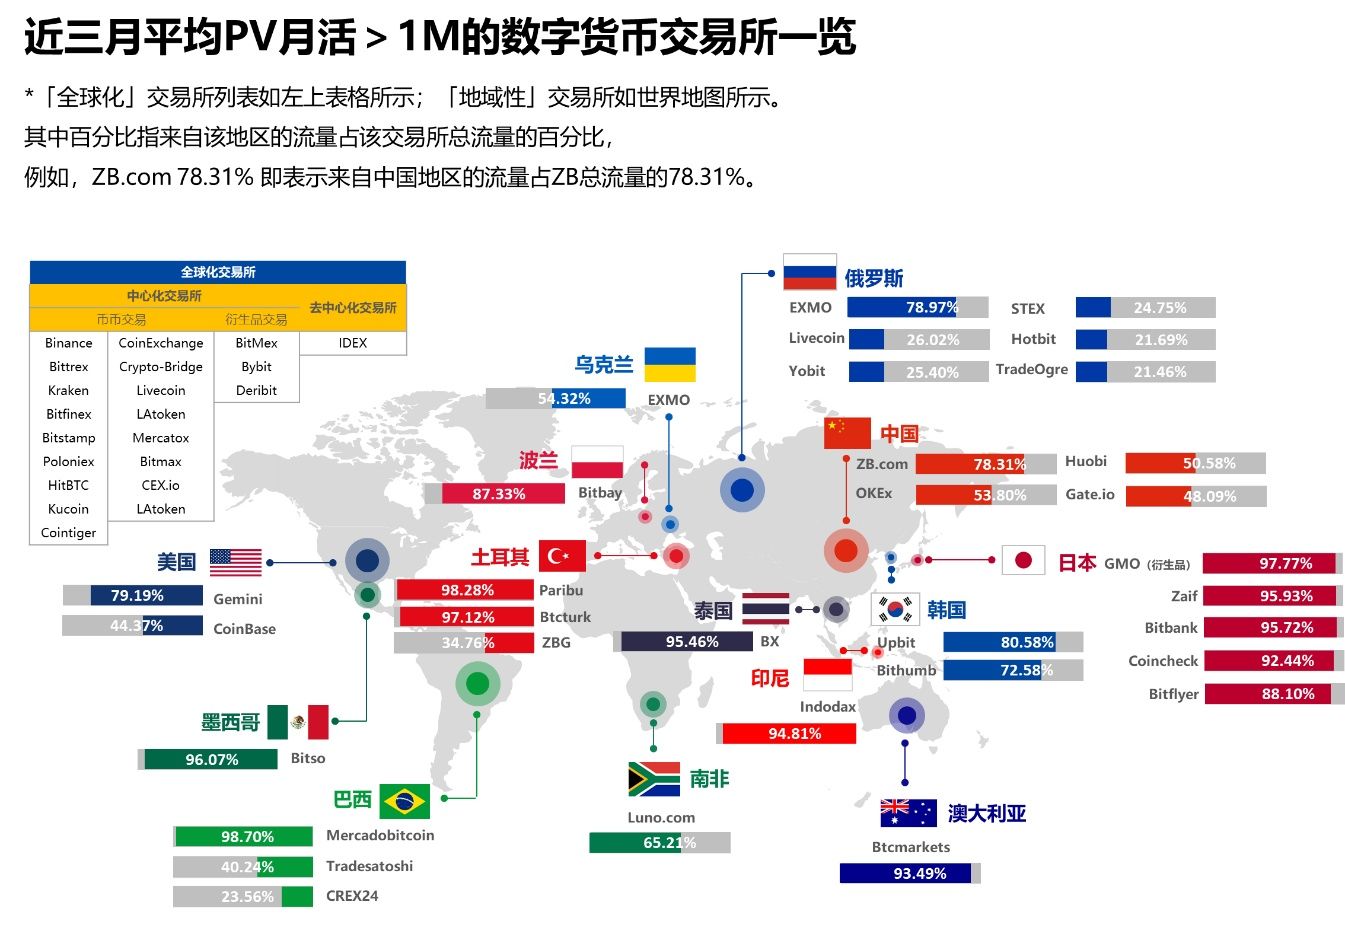
In terms of exchange product selection, in order to avoid subjective bias, the author only uses the website traffic as the standard of measurement – only the exchange with the average PV monthly activity >1M in the past three months (the same exchange multiple domain name traffic plus 1M) Yes), and take into account DEX and derivatives exchanges (only IDEX meets >1M in all DEX). Under this constraint, the author's statistics involve a total of 53 exchanges. The specific exchanges are selected as shown below.
In the above picture, the author also divided the “regional” and “global” of the selected exchanges. The basis for the division is as follows: From the overall activity ranking, it is found that TOP1 US activity accounts for less than 15% of the world, because the trading heat weight accounts for 70%, so the overall market activity ranking is largely determined by the trading heat, in the following The ranking of the trading heat also confirms this point – TOP1 countries account for <15% of the total transaction heat, so we determine that if the exchange's own traffic comes from a country > 20%, it is regarded as a "regional" exchange, Otherwise, it is regarded as a "regional" exchange.
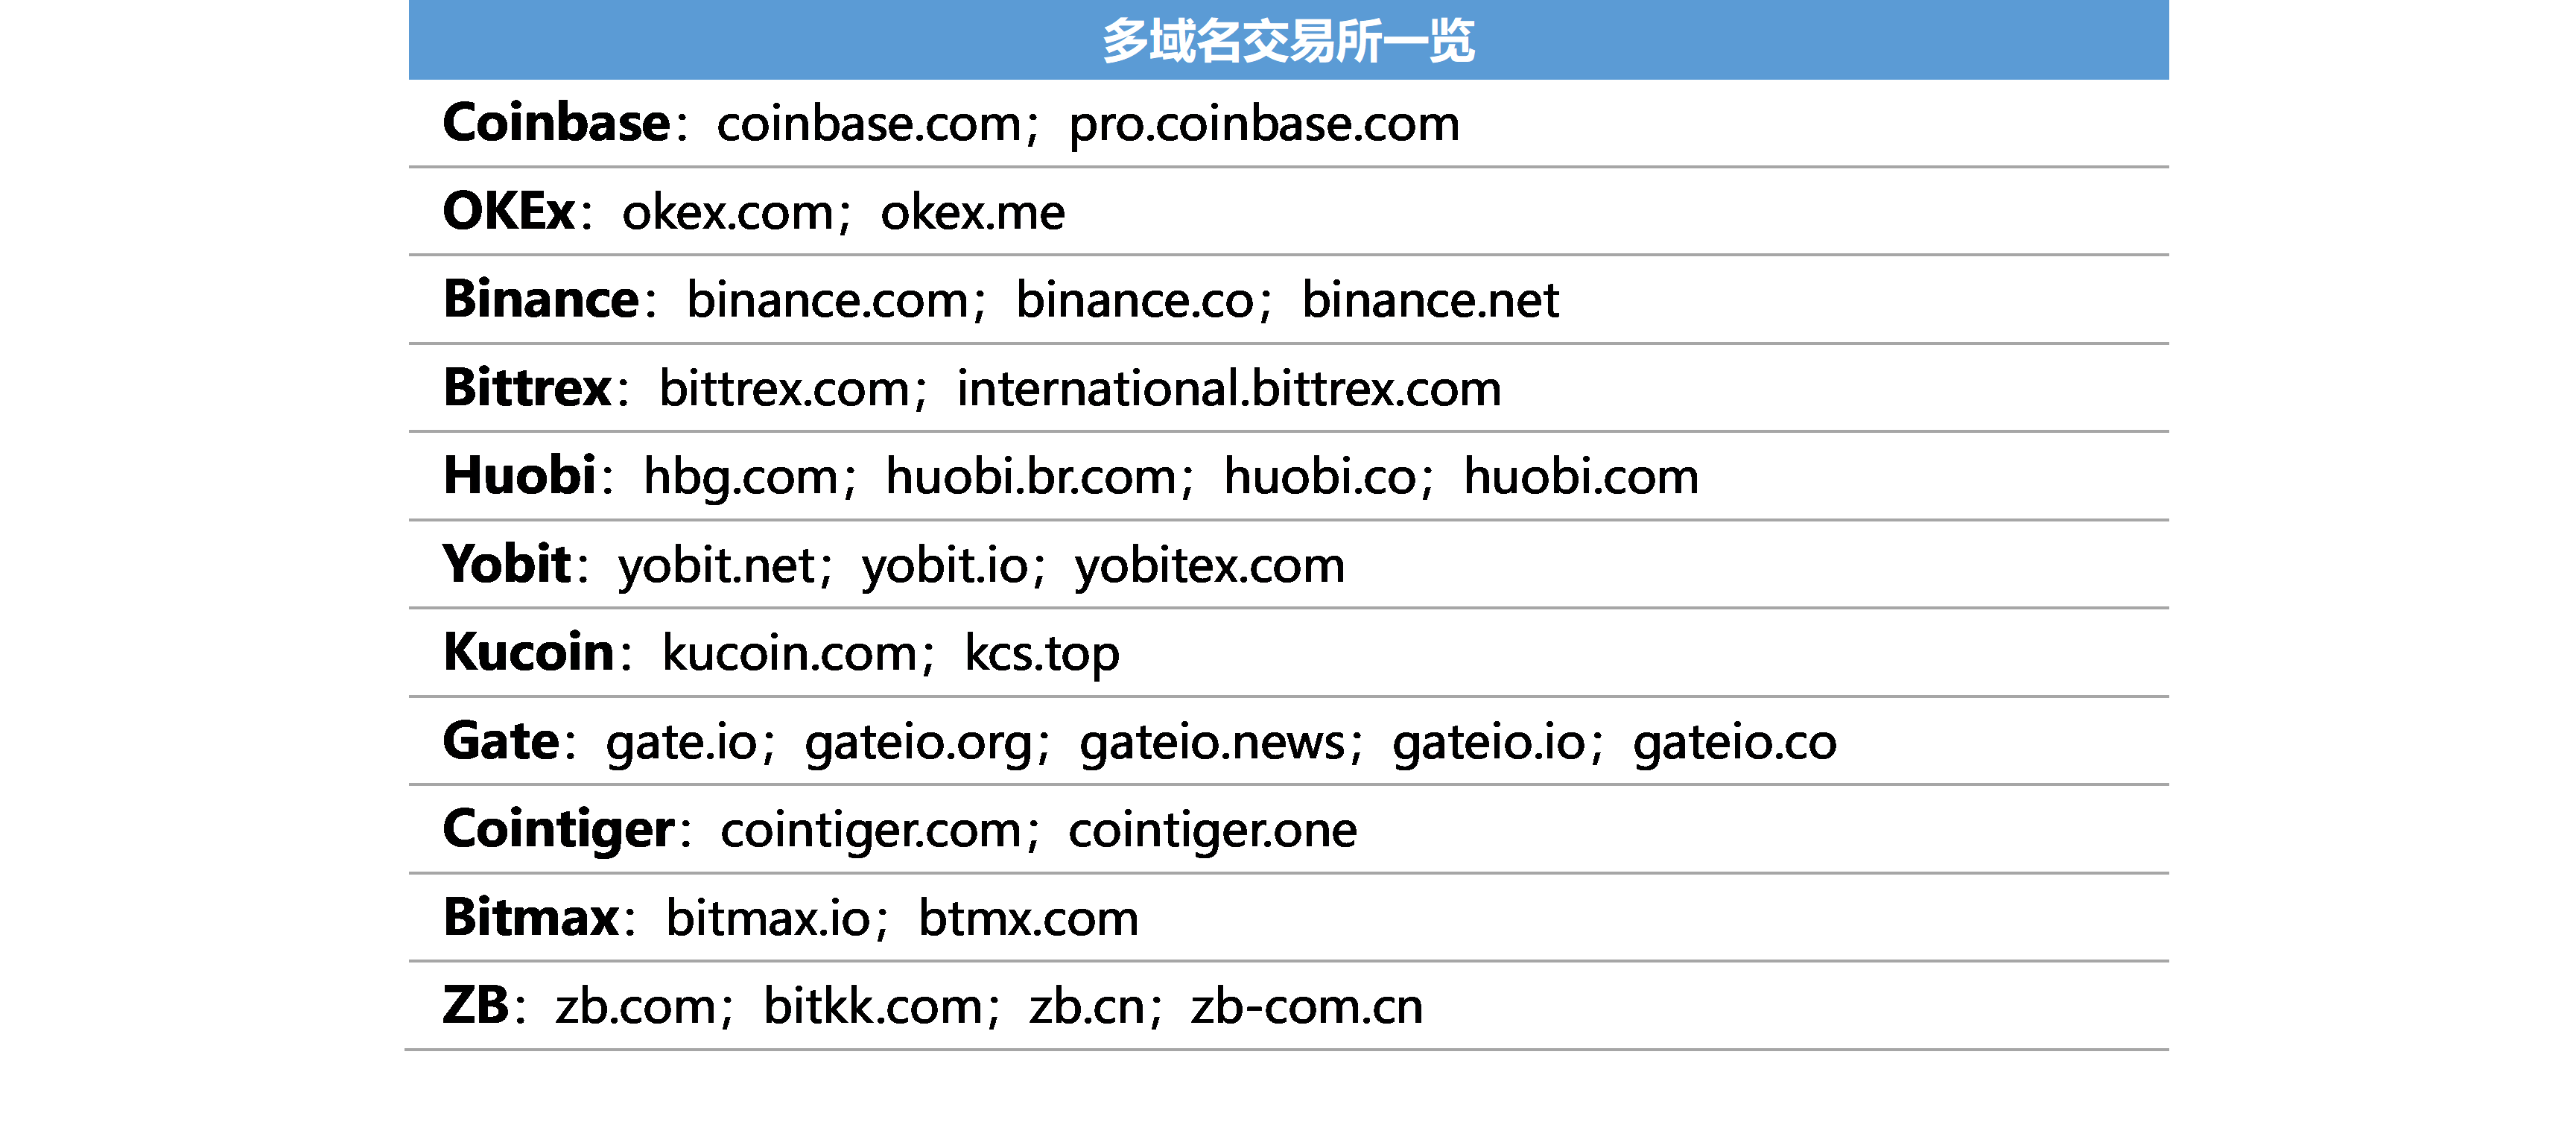
In addition, for the statistical data as objective as possible, in addition to the main website, the author also takes into account multiple domain names on the Web side, the exchanges involving multiple domain names are as follows:
Based on the selected types of transactions mentioned above, the author analyzes the distribution of the overall flow of the exchange in various countries. The TOP20 countries of the exchange flow are shown in the following figure. The United States, Russia, and Brazil are ranked TOP1-3, followed by Turkey, China, Indonesia, and Japan. The total traffic of TOP20 national exchanges accounted for 76.17% of the total flow of all countries.
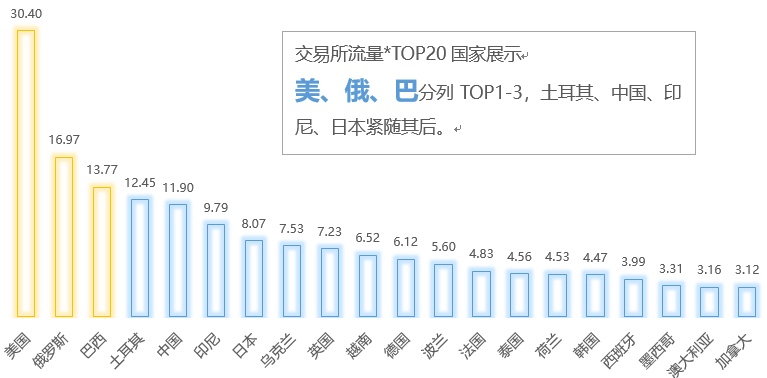
Combined with the "Monthly Live > 1M Digital Currency Exchange at a glance" map, you can find that the United States, Russia, Brazil, Turkey, Indonesia, Japan, Ukraine, Poland, Thailand, South Korea, Mexico, and Australia are apart from the global exchanges. There are also strong regional exchanges. Usually these regional exchanges are local exchanges, and the barriers to such countries are high. There is no strong local presence in the UK, Vietnam, Germany, France, the Netherlands, Spain and Canada. Exchanges, and the flow is also considerable, can focus on development.
In addition, the reason for the low traffic from China is that there are two main points. First of all, compared with other countries, China Mobile Internet is more developed, users are more inclined to use mobile apps, and due to the limitations of statistical tools, the author only counts traffic from the Web. In addition, even if multiple domain names are considered, VPN users can't count them, although similarweb said that it has restored the vpn users by working with operators, but the degree of restoration is doubtful. According to the news, the digital currency transaction traffic of Chinese users on the APP side is 4 times that of the Web side (API users directly access the browser, not counting monthly activities). Based on this speculation, the trading volume in the Chinese market is likely to far exceed that of the United States.
- The spread of over-the-counter trading flows with hot trading – countries with unstable legal currency systems and high inflation rates tend to hedge their currency risks by configuring digital currencies, which in turn makes demand for over-the-counter transactions in digital currencies strong.
The author maps the digital currency market activity from the average monthly live traffic distribution of major OTC platforms such as Localbitcoin, Buybitcoinworldwide, and Paxful. The active TOP20 countries are as follows:
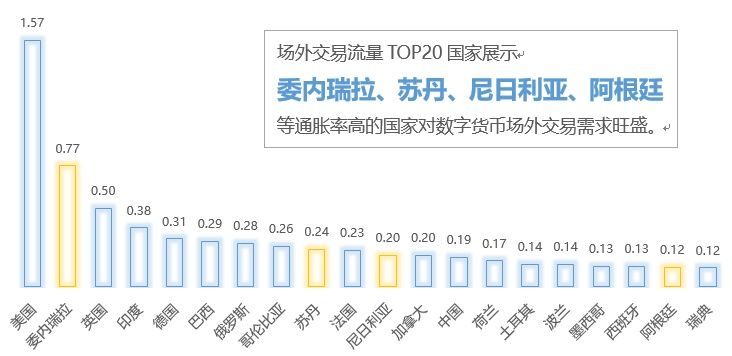
From the activity of over-the-counter trading, it can be found that some countries such as Venezuela, Sudan, Nigeria, Argentina and other countries have a sharp rise in rankings. The author speculates that countries with unstable legal currency systems and high inflation rates tend to hedge the risk of legal currency by configuring digital currency, so that the demand for over-the-counter transactions in digital currencies is strong. Sorting the country according to the inflation rate found that countries such as Venezuela, Sudan, Nigeria, and Argentina all ranked TOP15 countries with inflation rate. The above speculation is basically established. These countries have low trading flows, but have strong demand, and reserve as a blue ocean market for the overseas market expansion of the exchange.
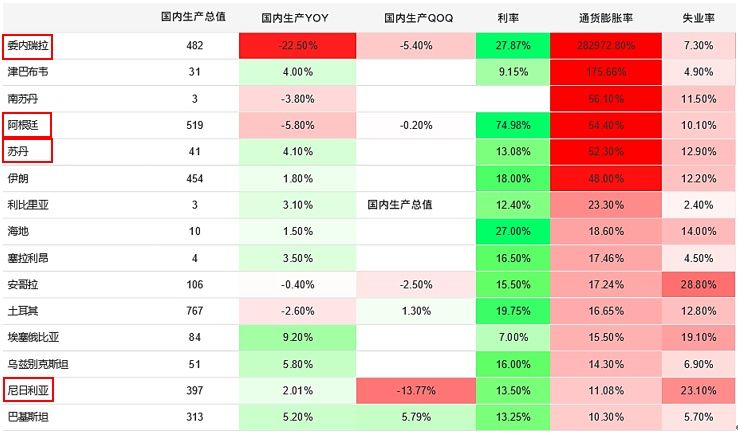
Illustration: Countries around the world rank TOP15 according to inflation rate
Data from TradingEconomics
- Public opinion – India, Slovenia, the Philippines, Venezuela, Pakistan, Nigeria and other countries have high public opinion but low transaction heat, which is a high potential growth market.
This dimension is to map the heat distribution of the digital currency in different countries through the “BTC” entry search heat distribution. When considering the popularity of the "BTC" entry search, the author has taken into account the popularity of GoogleTrends and the distribution of Google.com's own traffic in various countries.
First, in the Google Trends interface, you can see the search scores of BTC entries in each country for nearly 90 days. The higher the percentage of BTC search frequency in all search frequency in the region, the higher the score. However, in some countries where the Internet is not popular enough and the overall search frequency is not high, it is easy to produce “survivor bias”, that is, a few social elites are more likely to contact the network, and they are more inclined to search for cutting-edge content such as BTC. BTC has a high percentage of local searches, and most of the silence did not contribute any valid samples. This possibility exists in the Bahamas, Slovenia, Nigeria and other countries in the figure below. Therefore, the author also needs to consider the distribution of Google.com's traffic in various countries in order to objectively reflect the true public opinion of the digital currency.
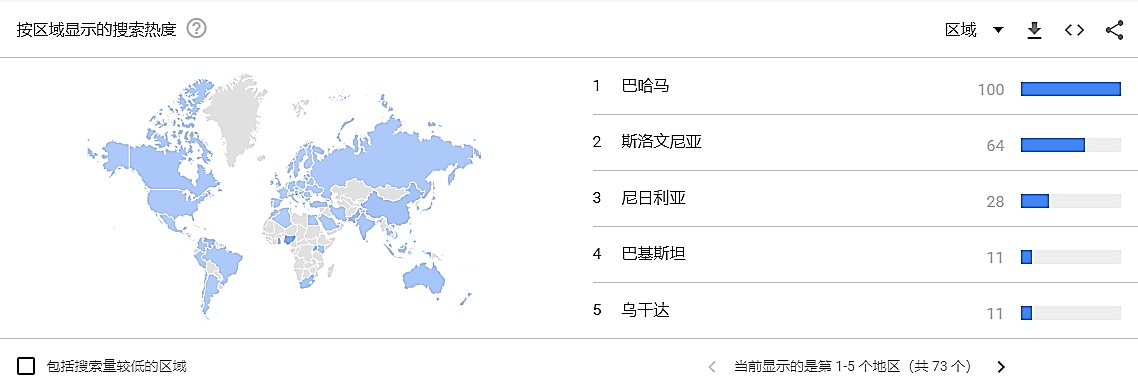
Icon: Google Trends shows "BTC" entry search heat country by country
Also using Similararweb to get the distribution of Google.com traffic in various countries, the TOP20 countries are as follows: (China is not ranked in TOP20 because of blocking Google)
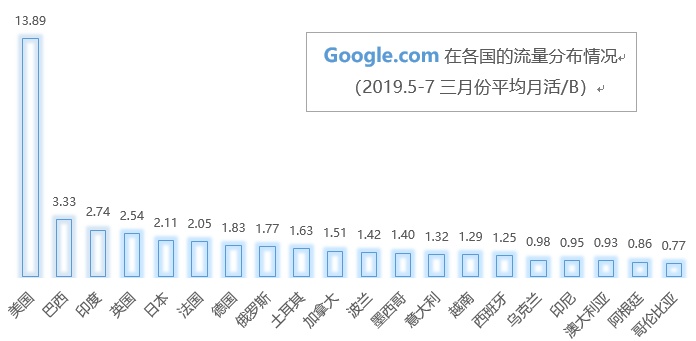
Here, the author defines "BTC entry search heat in each country" as the product of the "GoogleTrends heat" of each country and the "Google.com traffic distribution" of the corresponding country. The digital currency paradox of its reaction is ranked as shown below.
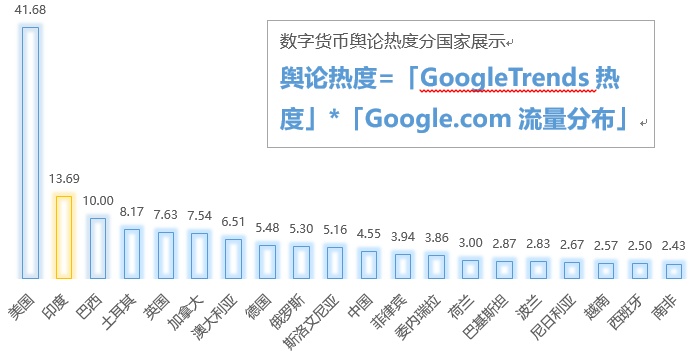
It can be seen that the discussion of digital currency in India is very hot. It can be speculated that the Indian market as a whole has a strong interest in digital currency. However, from the transaction flow data, the people who actually participate in the transaction are still in a minority, so it is a blue ocean market with great potential. Very worth exploring.
There may be readers who doubt that the heat is so high, whether it is because India's recent hearing on digital currency will lead to a search surge in the short term, which is not representative. Starting from this problem, the author has collected the popularity of GoogleTrends in the past five years in the Indian region, and found that its nearly 90-day heat is not particularly eye-catching in the long history of five years. It can be seen that India’s discussion on digital currency is not high. Because of a single political event.
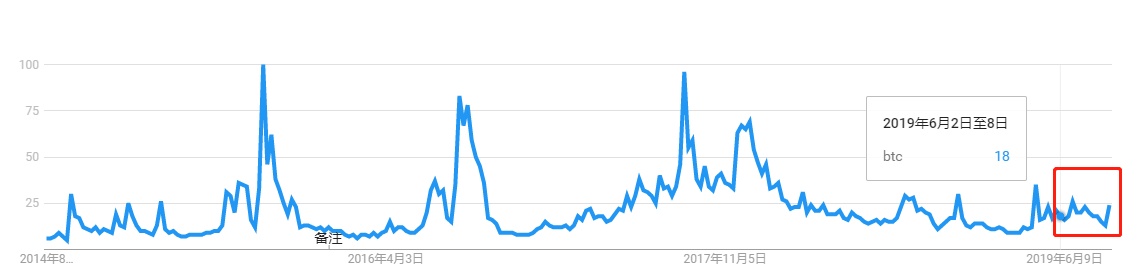
Illustration: Changes in the Google search for the "BTC" entry in the Indian market in the past five years
In addition, Slovenia, the Philippines, Venezuela, Pakistan, and Nigeria are similar to India. The same is true of the high public opinion, but the transaction is low, all of which belong to the blue ocean market.
- Tool usage heat market traffic distribution – CMC is still a global vertical market news traffic crocodile
In this dimension, the author from the market sites Coinmarkercap, Coingecko, Worldcoinindex to understand the country's heat, and in order to compensate for China's traffic, the author has taken into account the non-small website traffic (Coinmarkercap traffic far exceeds the other market sites selected). The following rankings are obtained, and the traffic distribution of the market website in each country is basically in line with the distribution of the exchange traffic.

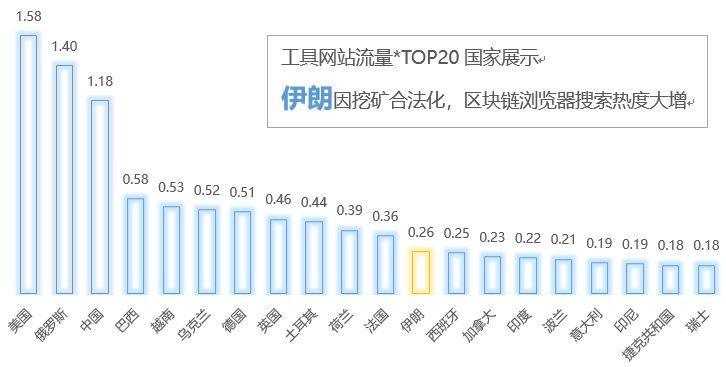
- Tools use heat blockchain browser traffic distribution – mining developed countries are more suitable for browser promotion
The blockchain browser products I chose include etherscan.io, bitcoin.com, btc.com, blockchain.info, and blockchair. Except for the sudden rise in Iran, there has been no significant change in the rankings of other countries. The author believes that the main reason is July 23, 2019, Iran officially recognized that cryptocurrency mining is a legal industry in its territory, and the prosperity of the mining industry has promoted the massive increase in blockchain browser traffic.
The above is the author's analysis of the current status of the global digital currency market activity. This article only uses the global digital money market to divide the country's activity for data analysis and display, and does not give specific explanation on how to enter a country. Later, countries that can focus on expansion, countries that can be used as reserves in the blue ocean market, and countries with sustainable observation will successively release a series of national market expansion guides. Please continue to pay attention.
We will continue to update Blocking; if you have any questions or suggestions, please contact us!
Was this article helpful?
93 out of 132 found this helpful
Related articles
- Uncover the secrets of cryptocurrency algorithm trading
- Ethereum is recognized by Islamic scholars as "halal certification", and the digital currency is also halal.
- The price is about to break through? Senior trader said: BTC has entered the fourth round of the rising cycle
- Confession of a Bitcoin Mania Powder: Why do I only recognize Bitcoin?
- Why did Ethereum 1.0 fail and Bitcoin succeeded?
- USDT, DAI, Libra, do we really need so many stable coins?
- "Received" game? BTC early investors have already left the market with high prices