Uncover the secrets of cryptocurrency algorithm trading
Trading through algorithms in the cryptocurrency industry is an area worth exploring. In this article, we explore the design and implementation of trading algorithms in the cryptocurrency industry. We focus on several factors that need to be considered when implementing algorithms, market-making algorithms, and market microstructures.
Execution algorithm
The goal of executing an algorithm is to convert one state of the portfolio to another while minimizing the cost. For example, if you want to increase the BTC/USD exposure by a factor of 1000, you probably won't be able to slam the order into a BitMEX order, as this will result in a sharp price drop. Instead, you can consider a combination of market and limit orders on multiple exchanges over a period of time to slowly reach the position you want.
- Ethereum is recognized by Islamic scholars as "halal certification", and the digital currency is also halal.
- The price is about to break through? Senior trader said: BTC has entered the fourth round of the rising cycle
- Confession of a Bitcoin Mania Powder: Why do I only recognize Bitcoin?
An execution algorithm usually has three layers: macro traders, micro traders, and intelligent routing.
Macro trader this layer will be a large amount of order [meta order: that is, a large amount of trade orders, and is divided into small pieces of step by step] or a parent order [parent order: that is, a large order, when the transaction is executed, it will be split Split into smaller sub-orders that span a period of time for smaller batches (called sub-orders) . This is actually the scheduling part of the entire algorithm. VWAP, TWAP And POV are a common simple example of a macro trader algorithm.
VWAP: the volume-weighted average price, which is the average price calculated by weighting the prices of multiple transactions according to their respective trading volumes;
TWAP: the time-weighted average price, which refers to the average price over a specified time period;
POV: is the volume percentage. This trading algorithm is used to execute the trading volume of large orders without excessively affecting the market price.
Often, to design a complex macro trader layer, there are many different market impact models available. The market impact model looks at how the market reacts to an implementation. Is the market intact after an implementation? Still deviating further? Or can it achieve some degree of recovery? The two most groundbreaking market models are the permanent market impact model of Almgren-Chriss (1999, 2000) and the temporary market impact model of Obizhaeva-Wang (2013) . Because the market impact is not permanent in practice, the Obizhaeva-Wang model seems to be more realistic. After this model was proposed, many new models were built to address its shortcomings.
The decline of market influence after the execution of the transaction
The micro-trader layer makes decisions for each sub-order, such as whether it is executed through a market order or a limit order. If it is a limit order, the price should be set. There is much less literature on the design of micro-traders. This is because the size of a sub-order is usually a small part of the entire market, so how it is executed is not important.
However, the field of encryption is very different, because the liquidity is very thin, and in practice, even for ordinary-sized sub-orders, the price decline is quite significant. The design of micro-voters, usually focusing on the distribution of order arrivals in time and depth, queue locations, and other characteristics of the market microstructure.
Market order (and cross [cross: refers to when the broker receives the same stock trading order at the same price, and then simultaneously trades between two independent customers at that price ] limit order, if we ignore the delay) guarantee Execution, and pending limit orders [Pending Limit Orders: Limit Orders that have not yet been filled (Buy Limit <Minimum Quote, Sell Limit> Maximum Bid)) There is no such guarantee. If execution is not guaranteed, you may not be able to keep up with the schedule set by the macro trader.
The intelligent routing layer determines how paths are chosen between different exchanges/transaction locations. For example, at a given price level, if Kraken has 60% liquidity and GDAX (Coinbase Pro/Prime) has 40% liquidity, then all market orders decided by the micro-trader should be The proportion of 60-40 is assigned to Kraken-GDAX.
You may come up with a different view: arbitrageurs and market makers in the market will move liquidity from one exchange to another. So, if you execute half of the order in Kraken and then wait a few seconds, liquidity will be transferred from GDAX to Kraken under the influence of arbitrageurs and statistical arbitrageurs, so that you can complete the rest at a similar price. Order.
However, even in this case, the arbitrageur will charge you extra for your own profits and pass on your own hedging costs such as Kraken's market-making fee. In addition, some market participants will publish orders that exceed their actual size across platforms, and will cancel the excess orders once the target is achieved.
In the final analysis, it's best to have your own native smart routing. Native intelligent routing also has the advantage of reducing latency compared to third-party intelligent routing services. With native smart routing, you can route directly to the exchange, and in the former case, you need to send a message to a third-party service before they route your order to the exchange (and you have to go to the Three-party service payment routing fee). In short, the sum of any two sides of the triangle is greater than the third side.
Market making algorithm
Market making refers to providing immediate liquidity to other participants in the market and obtaining compensation. You take on the inventory risk in exchange for a positive expected value. In the end, the market maker was compensated for two reasons.
First, the market taker has a high time preference and hopes to close the deal immediately. Market makers who facilitate liquidity are compensated for their lower time preferences and patience. Second, the PnL (profit and loss) characteristics of market makers are left-leading, and most people tend to prefer right-wing. In other words, market makers are similar to bet brokers in quiz markets, casinos, insurance companies, and state-run lotteries. They often win small and don't lose much. Because of this unpopular reward strategy, market makers receive compensation for predictable value.
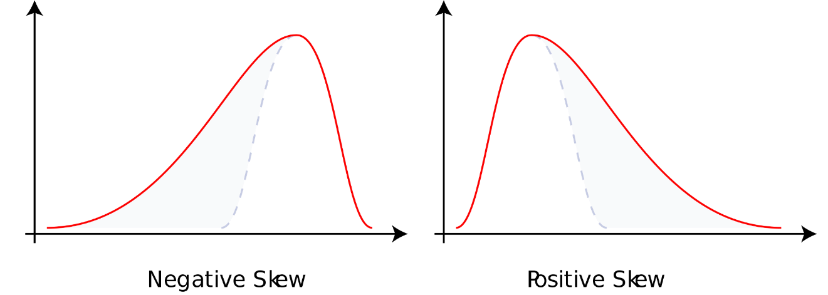
Skewed state
In the case of high, the limit order is actually a free option for other market participants. Other participants in the market have the right but not the obligation to buy or sell an asset at the price given by the limit order. In a market with complete information, no one will sell free options. Just because the market as a whole does not have complete information, it makes sense to sell free options.
On the other hand, if the market is completely unaware of the information, then even if there is only a small spread, a risk-neutral market maker is willing to sell the options for these free limit orders, because all transactions are noise at this time [noise: refers to Stock market activity caused by procedural transactions, dividend payments, or other phenomena that do not reflect overall market sentiment ] . Obviously, there are various players in the real market, each with their own level of knowledge.
When designing a market-making algorithm, three perspectives need to be considered: market makers, market acceptors, and other market makers.
Market makers' own perspectives are expressed in their inventory. If you already have too many asset exposures, then you may tilt / skew your offer in a low direction. If the asset exposure is too small, you will have the opposite tendency. There are two different reasons for doing this. First, as a company, you have a certain degree of risk aversion (maybe less than a person, but your money utility curve is still concave). The shape of this utility function has many structures (such as CARA, CRRA, more general HARA, etc.). Second, as a passive liquidity provider on the market, you will face the risk of adverse selection. Positive liquidity recipients may know something you don't know, or just be smarter than you. Fundamentally, this is a problem for people who sell free options to the market.
In addition, even at the mechanical level, hitting the market price of your bid price will lower the price by mark-to-market, while the market order that meets your selling price will be the price of the market value. raise. At the exact moment of any transaction, you are always on the wrong side. In addition, quotes from market makers have a negative market impact. In other words, the act of submitting an order to the order book itself will have a little bit of pushing the market away from you.
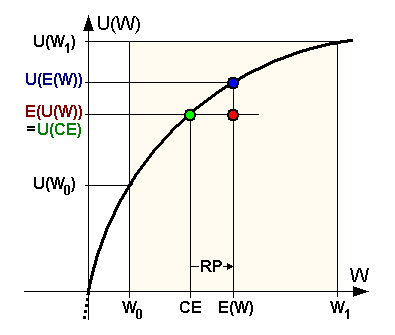
Utility function of risk aversive individuals
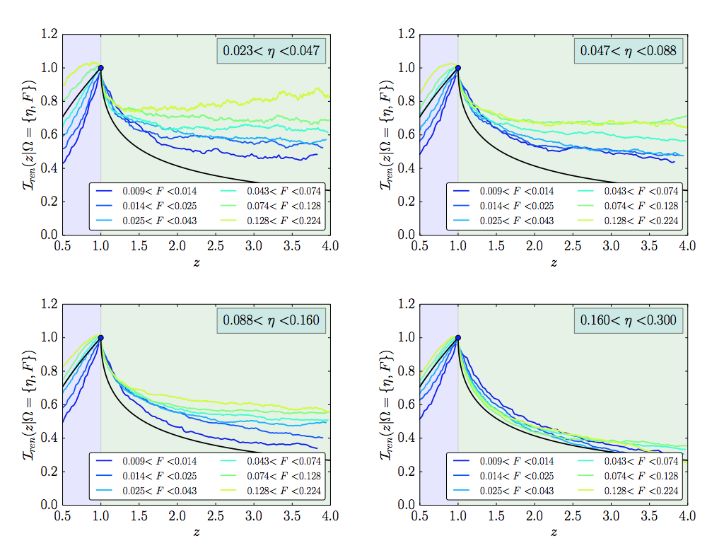
The view of the market acceptor is expressed in the order flow. The volume-weighted order arrival frequency, as a depth function from the top of the order book, should have several key attributes.
The function should be
- Decrement
- Convex (it is difficult to explain with intuition here, but it is indeed the case at the empirical level);
- As the depth becomes infinite, the function approaches zero.
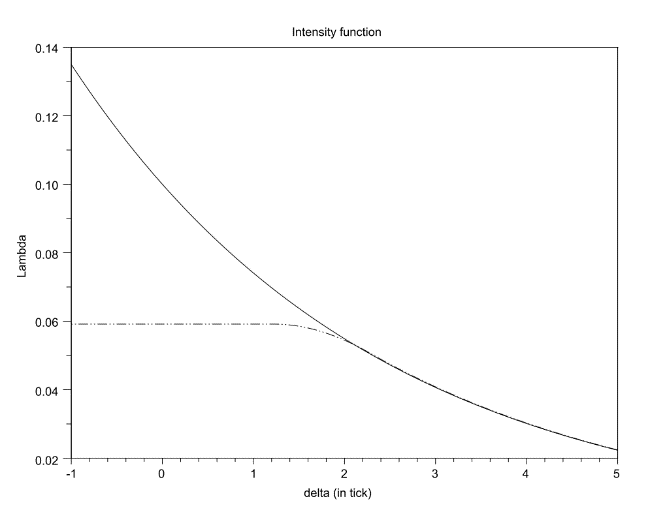
Some formulas require that this intensity function can be differentiated twice in a row. This manageability is a good and reasonable presupposition, but it is ultimately unnecessary. In addition, there are various formulas to calculate the "depth or distance from the top of the order book". You can usually use either a "reasonable mid-price" or a so-called best bid and best bid from all angles. There are different trade-offs between the two methods, which we will not discuss here.
In addition, there is another brain-burning question: what is the "reasonable middle price"?
Slightly add a few words, the so-called mid-price between the best bid price and the best bid price is very susceptible to noise, which happens when the junk order is submitted and cancelled. In addition, if the two cases have the same order book form, then the best-selling best-selling price means that there will be a reasonable price below the latest best-selling price. There is another question, is the history of the release of records important, if it is important, then should we observe it from the perspective of clock time or transaction time? Based on the characteristics of the order flow, where is the location of the optimal limit order for the market maker? If you submit a close quotation at the top of the order book, you will trade frequently, but earn very little each time. If you submit a deep quote, your deal will not be as frequent, but you will earn more each time. This is actually a convex optimization problem with a unique global maximum.
Another issue to consider is that the order flow arrives across time and looks a bit like the Poisson process. Some people think it is closer to the Hawkes process. Moreover, the bid-ask bounce that market makers try to capture is the shortest-term version of the mean return. Since this ultra-short-term mean regression is scaled by local fluctuations, market makers should expand the range of quotes when the volume is large, and tighten the range of quotes when the volume is small.
Order arrival intensity changes with depth
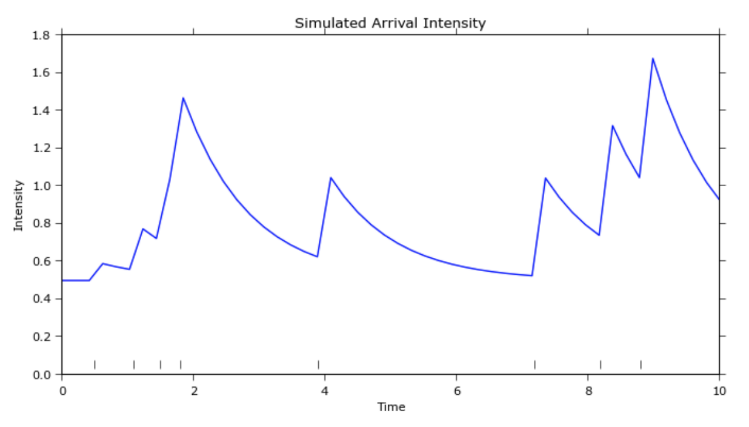
Hawkes process
The perspectives of other market makers are represented by the order book. The order book reveals some private information from other market makers. Near the top of the order book, if the sell order is more than the buy order, it means that other market makers are more willing to sell instead of buying assets. There are two possibilities. First, there is already a huge positive imbalance in the inventory of these market makers. Second, they believe that prices are more likely to fall rather than rise in the short term.
In either case, as a market maker, you can adjust the quote based on the distortion of the order book. Moreover, when market makers compete with each other, if the smallest quotation unit [minimum quotation unit: the smallest gap between two consecutive prices] is small, you will often see the so-called "penny jumping" [penny jumping] [ Grab the spread trade: a trade that is strictly prohibited. Refers to the act of pre-emptive trading of its own account in the case of a securities company or a market maker holding a client transaction commission in the hands of a market maker trading system.
Market makers compete for the transaction priority by grabbing the price or climbing the stairs in the order book until the arrival of the surrender point [surrender point: surrender means giving up, the term indicates that the investor decided to give up trying to regain the loss caused by the stock price decline. At the point of time of the profit], there is only one winner who finally gets the priority of the transaction.
After determining the winner, the runner-up will usually withdraw to a position that is one quotation unit from the next best bid or ask price difference. If you don't get a deal priority, you can get a second deal priority and pay just enough. This will lead to a return, that is, the champion retreats to the nearest quotation unit in front of the runner-up, and the climbing stairs game begins again. You can see this stair climbing game in real encrypted market data.
Buy a single side climbing stairs game
Finally, the long-term directional signal can be overlaid on the market-making algorithm. In this case, the goal of the market-making algorithm is no longer to keep the order inventory flat or constant, but to consider some long-term goals and corresponding deviations to promote achieve.
speed
Speed is important for two reasons. First, you can hit the order in the order book before the order is cancelled. Second, you can cancel the order in the order book before the order is hit. In other words, you want to shoot old orders, and you want your orders not to be shot by others. The arbitrage algorithm (active) and the execution algorithm (active) value the former, while the market-making algorithm (passive) pays more attention to the latter.
Often, the strategy that benefits the most from speed is also the most basic strategy. Any complex logic will inevitably slow down the round trip time. These types of algorithmic strategies are trading the world of F1 racing. For speed, data verification, security checks, instrument monitoring, orchestration, etc. can all be stripped. Skip OMS, EMS, and PMS (Asset Management System) and connect the computational logic on your GPU directly to the binary API of the same location exchange. This is a fast and dangerous game.
Another type of speed-sensitive strategy, the relative statistical arbitrage strategy, requires the server to be physically located between multiple exchanges rather than being co-located with a particular exchange. Although they can't get the data of any single exchange as quickly as possible, they will get the data before any other strategy and can act on the basis of correlation and cointegration data.
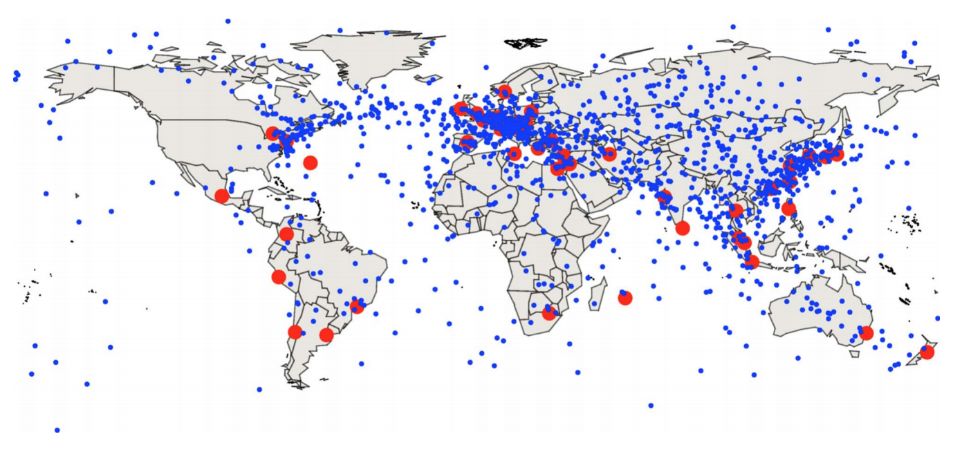
The best trading node location between the world's largest stock exchanges
In the speed game, the winner takes most of the gains. In the simplest case, if there is an arbitrage opportunity, whoever gets the arbitrage opportunity first will grab the profit. The second place will get the breadcrumbs, and the third place will have nothing. The benefits are likely to be power-law-distributed.
Speed game is also a race to the bottom. Once everyone has upgraded from fiber to microwave or laser network, everyone will return to the same starting line, and any previous advantages will be smoothed out.
Minimum quote unit, fill order priority, and queue position
Most matching engines follow price-time priorities (proportional matching is a less common alternative, but we don't consider them first). A price limit with a better price limit is even worse. If the prices of multiple limit orders are the same, the orders submitted earlier will be traded earlier than the orders submitted later.
Coin is able to split the order book to a minimum of 8 decimal places. If the price of an asset code is .000001, the quote for .00000001 is 1% of this price. If the price of an asset is .0001, the quote of .00000001 is 0.01% of this price, which is 1 bps (bps (basis points): 0.01%, used to describe the value of financial instruments or interest rate changes. The unit of measure for the percentage]). The difference between the two is huge. In the former case, it takes a whole point before going to a large order, so time priority is more important, and in the latter case, the cost of capital is 100 times cheaper, so price priority is more important.
In other words, if you have to pay a full 1% to get the deal priority, it may not be worth it, because you pay a relatively high cost, and only a relatively small increase in the possibility of a deal. In this case, maybe waiting in line for better. But if you only need to pay 0.01% to get the deal priority, then you'd better do this because you only spend a small amount of cost, but relatively increase the probability of the transaction. Smaller trading units are good for price priority strategies, while larger trading units are good for time-first strategies.
This naturally leads to the next question: How much is your queue position worth?
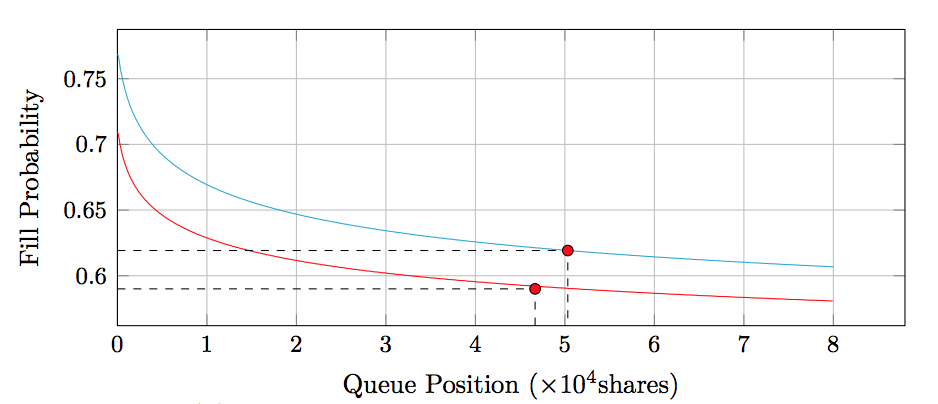
Probability of the transaction as a function of the queue position
Order book increment
At a certain price level in the order book, there are only two ways to reduce the amount: either a trade crossed or a pending limit order is cancelled. If it is a cross-discount, then all other price levels that are better than this price will also be cross-trading and the amount will decrease. We can arrange the opening and canceling orders one by one on the quotation sheet, and record each reduction as a transaction or a cancellation. Intuitively, a transaction means that the parties agree to buy or sell at a certain price, and a cancellation means that one party decides not to buy or sell an asset at a particular price. Therefore, on the surface, we can say that if an order with the best bid price is cancelled instead of being sold, it is a strong signal that the market will go down in the short term.
On the other hand, there is only one way to increase the amount at a certain price level in the order book: that is, a pending limit order has been submitted.
The increase and decrease in the order book reveals the private information of market participants, thus providing a short-term price signal.
Better price index and optimal exchange costs
Currently, most price indices are obtained from multiple exchanges and aggregated together to obtain a volume-weighted average price. The Tradeblock Index is especially special in that it penalizes the weight of exchanges that are inactive and whose prices deviate from their peers. And what else can we do?
On GDAX, the market handling fee is 0 bps, and the market acceptance fee is 30 basis points (ie 30%), if a transaction is announced [release price: when the transaction appears on the ticker or otherwise The price at the time of public record is $4000/BTC, and the sell price side is hit, which means the seller sells at $4000/BTC and the buyer buys at $4012/BTC. The "reasonable price" for this deal should be close to $4006/BTC instead of the actual release price.
If you switch to the Bittrex exchange, the reasonable price is the release price because the cost of 25 basis points applies to both the market maker and the receiver. In other words, a $4000/BTC release is actually bought by the buyer at $4010/BTC, and the seller is sold at $3990/BTC, which averages the price of the order.
Therefore, from the perspective of price discovery [price discovery: the process by which buyers and sellers reach a transaction price for the quality and quantity of a commodity at a given time and place ] , the exchange table of each exchange is not directly comparable. Therefore, when constructing the price index, the cost should be cut and standardized.
Of course, there is another complexity here, from the transaction-based cost ladder, which may increase or decrease the asymmetry of the market maker-receiver cost, because the cost is a stepped jump, so we are not sure, The exact price that the buyer buys and the seller sells. This also implies two interesting inferences.
First of all, price discovery is limited and somewhat schizophrenic [schizophrenia: here the analogy of "fair price" is rapidly oscillating between the two poles], especially when it comes to market maker-receiver costs. Symmetrical exchange.
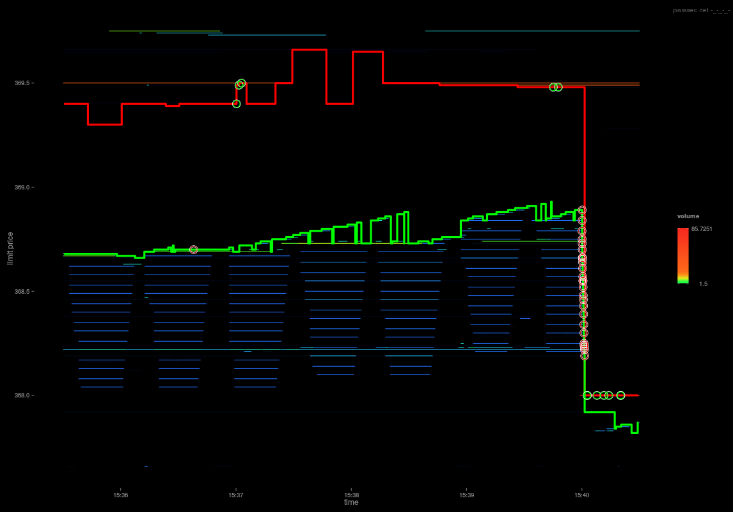
Assuming that most of GDAX's accounts are at the market maker-receiver cost level of 0/30 bps, and we noticed that GDAX often has a spread of 1 cent in its BTCUSD order book, then each bid is at the purchase price. On the side of the transaction, the reasonable price will be lower than this price of 15 bps, and the transaction price of each transaction on the selling side will be 15 bps higher than this price. Therefore, in a calm period, the "reasonable price" will quickly oscillate between these two points, and there will be no more granular price discovery between the two.
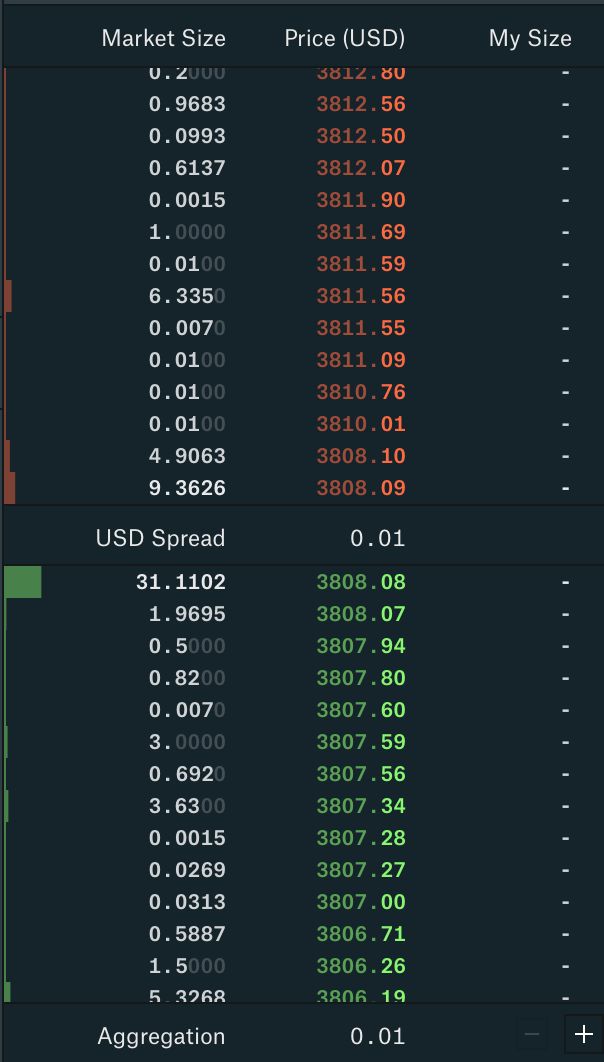
GDAX order book
Second, as with the tax association between producers and consumers, market makers and recipients have similar relationships in terms of cost sharing.
If you charge the market maker a relatively large amount of fees, they will widen the gap between the order books and pass some of the costs on to the recipient. If you charge the recipient a relatively large amount of fees, the market maker will tighten the gap in the order book and absorb some of the fees from the recipient.
The extreme case is that if you over-recour the market maker, the spread of the order book will be reduced to the minimum quote unit (as we often see on GDAX), and the order book cannot be further tightened. Moving forward, any additional costs will fall on the exchange in the form of lost revenue. Through this extreme case, we can see that it does not matter which party the cost falls on. The important thing is the sum of the market maker and the recipient.
In the end, just like the Laffer curve in the tax policy, the exchange is also facing the income optimization problem of the charging policy. We can see that the extreme situation is the same as the tax policy. If the exchange does not charge any fees, they will not have income. If the exchange charges 100% of the fee, there will be no transactions, so they have no income. If we add other theories, it is clear that the graph of the exchange's income and total cost levels is a convex function with a unique maximum.
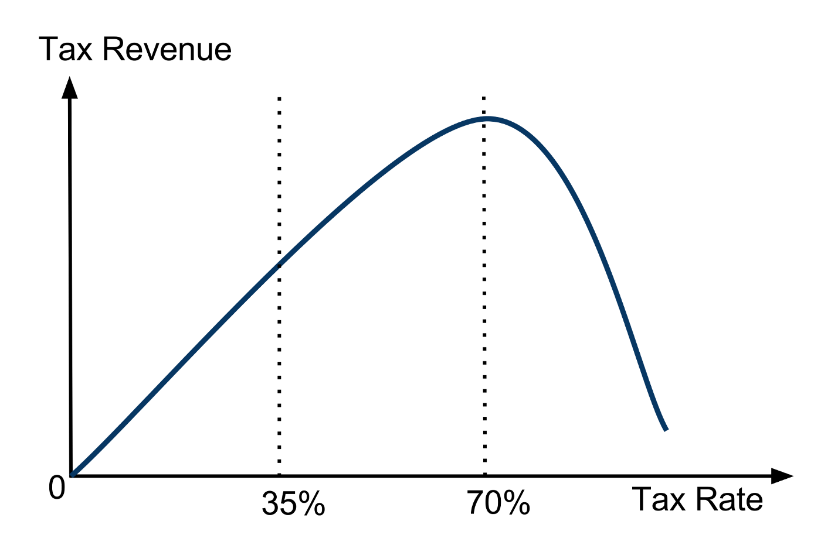
Laffer curve
Proprietary data
Each OTC (over-the-counter) institution has graphical data of a semi-unique tag of its counterparty address, as well as a currency stream between these addresses and known exchange addresses. These tagged data provide a good starting point for many machine learning algorithms.
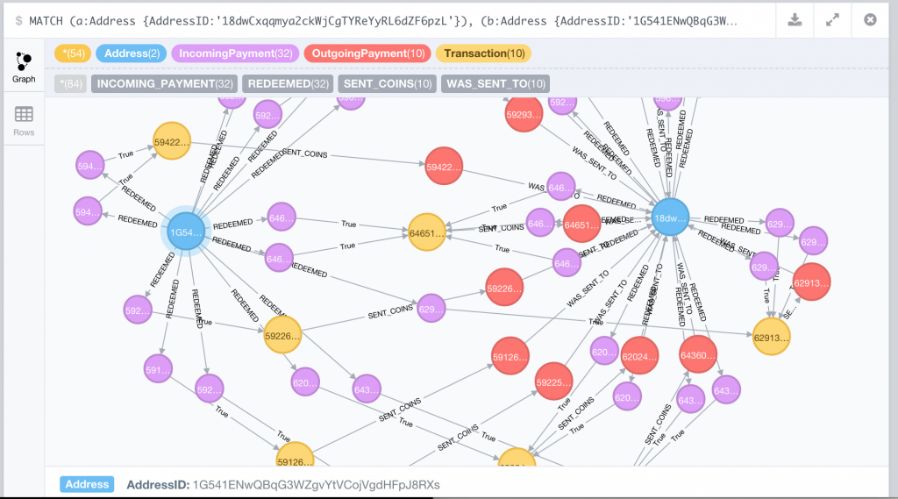
Bitcoin transaction chart
Each miner has proprietary data on the marginal cost of digging coins (the type of proof currency). If they can sense their position in the global miners in terms of mining efficiency, they will gain a unique insight into the short-term supply or shortage.
Black box
Everyone knows that the black box is not good. It's hard, if not impossible, to identify what's going on, and when something goes wrong, it's extremely difficult to diagnose the cause.
However, many of the best hedge funds and proprietary trading companies will eventually create black boxes. There are a few good reasons to explain this.
First of all, the company's people come and go, those legacy code with poor documentation, it is difficult to understand after the newcomer takes over. Second, market competition means that any strategy that any individual can fully understand will ultimately be lost to strategies developed by experts and experts in their small areas. Finally, the merged strategy is usually better than the one that runs alone. For example, suppose you have a long-term momentum strategy (S1) and a short-term mean regression strategy (S2). Of course, S1 can benefit from S2's short-term execution advantage, and S2 can obviously benefit from S1's long-term trend forecast. So naturally, we will combine them into a merge strategy that is more effective than any component. In the end, this strategy became a black box, not because we wanted a black box, but because we didn't consider the black box being unpopular.
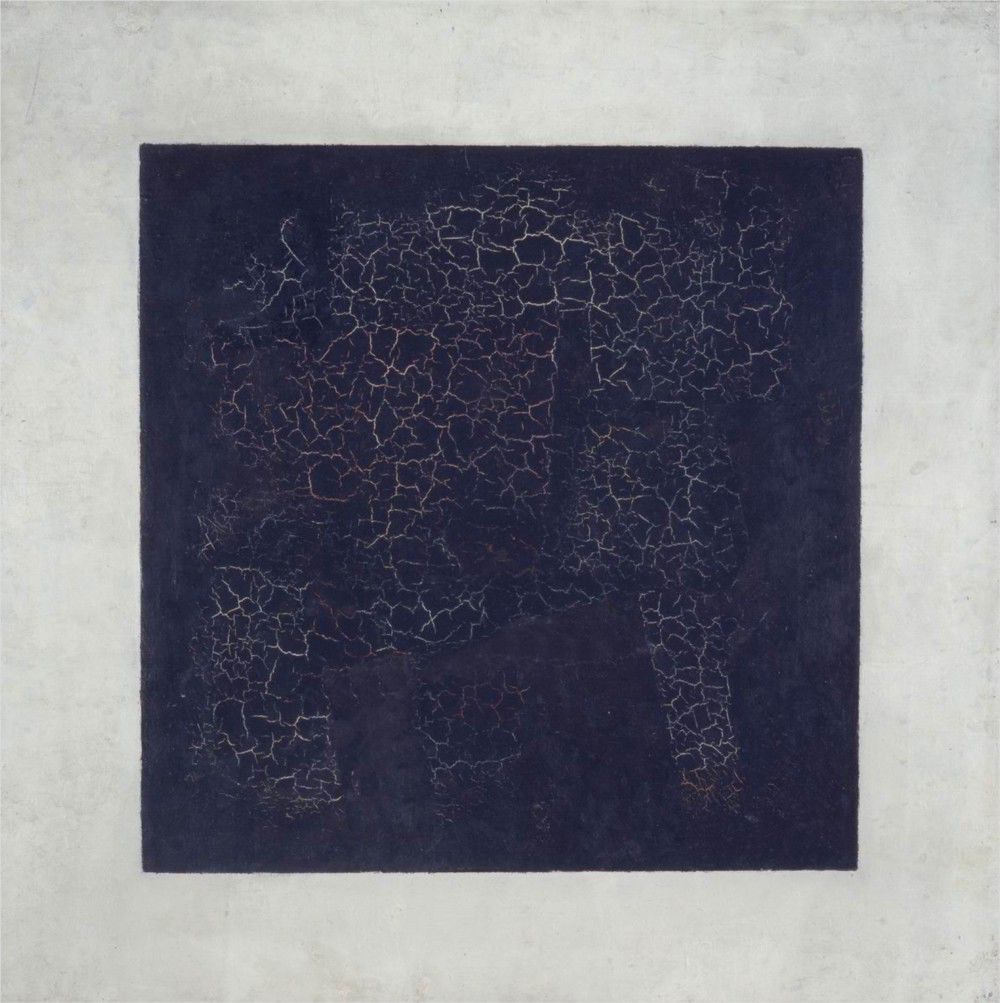
Malevich's Black Square
Untie the confounding factors
Suppose we have a model that uses the binary indicator of whether the ground is wet to predict Uber's travel rate, and this model works very well. Obviously, there is no direct connection between the wet ground and the Uber taxi, but indirectly, the rain will make the ground wet, and the rain will make people want to use Uber more. Even if our pseudo model performs well, it is susceptible to tail risk. If a pipe bursts in a certain part of the city, causing the ground to be wet or a natural flood, we will make a false prediction that Uber’s ride rate will increase.
In general, when A means B (A => B) and A means C (A => C), the model B => C may be valid, but only by chance. It must therefore be recognized that predictive relationships should be in line with intuition and common sense. Blindly mining data and discovering strong predictive signals is not enough. We should strip the confounding factors before the signals merge into a black box, because once a black box is formed, these factors will become increasingly difficult to unravel.
As another example, suppose A => B and B => C. Then, A => C This model will work, but the level is lower than B => C. First, A => C may damage your interests, because A may not be the only factor that causes (in Granger causality) B; perhaps A' will also lead to B. Second, if the relationship of A => B does not hold, then the A => C model will also collapse, but the B => C model will still be valid.
Feature selection
Let us turn to a multi-factor model, ideally the features should be as statistically irrelevant as possible. For example, suppose we are studying the price of ice cream and design it as a function of sugar price and milk price. Perhaps a better model is the use of sugar prices and seasons (spring, summer, autumn, winter). In the former model, each feature and inflation are related to both “food ingredients/inputs” and “consumer goods”, and both come from the supply side of ice cream production, while the latter model is different, and the two characteristics are statistically irrelevant. Sex (one from the supply side and the other from the demand side). Of course, if you use the three characteristics of sugar price, milk price and season, you can produce a more accurate model. However, as the model dimensions increase, if the tuning time is not exponential, it will at least be linearly extended. When you have 20 features, running some optimization methods (such as gradient descent) can be tricky, so feature selection is key. We should abandon the interrelated characteristics and choose those features that are more statistically irrelevant.
Epistemology
Both positivism and deductive reasoning are valuable when designing quantitative models.
One drawback of the purely empirical approach is that we are unable to conduct controlled experiments in the market. We can't try two different actions at the same time to see which one performs better. In other words, unlike hard science, there is no real counterfactual in the soft/social science. Especially in trading, we cannot accurately measure the impact of our own actions on the market. In other words, in the historical time stream, when we don't have a trade, we can't know how the order book and the order flow will change if we make a trade; in the historical time stream, when we make a trade, We also don't know how the order book and order flow will change if we don't make a deal.
Another shortcoming of positivism is that there are an infinite number of models for any given historical pattern, each model will conform to this historical pattern, but each model can make a completely different prediction for the future (such as the black swan a version of the problem). Hume, Wittgenstein, Kripke, Quinn, Popper, and Taleb have many criticisms and defenses about logical positivism and induction, and further elaboration of these ideas.
One problem with pure deductive reasoning is that we are prone to mistakes as human beings. Any logical error on the chain of reasoning will immediately invalidate the result. In addition, the reliability of the conclusion not only requires that every logical step along the way is effective, but also requires that the premise of our hypothesis is true and in line with reality. Because models must be easy to use, they are usually a simplification of the world, and the presets they make cannot be contrary to reality.
Let's look at an example. Suppose you want to run a Monte Carlo simulation on the price trajectory of an asset. If you get historical data on the return on the asset and sample it directly to simulate the path, you will encounter the following problems:
- In the case of the tail that represents an extreme event, the data is sparse;
- You find some noise in the data, away from the probability distribution of some unknown real returns. Now, let's say you fit the historical data to a normal distribution and then sample your simulation path from it. Now you have a problem, in fact, the return is not normally distributed (such as spikes, fat tails). Or simply change the way, you fit the historical return to the Cauchy or Levi distribution, more commonly to the Levial alpha stable distribution. At this point, the model becomes more and more complicated, and you accidentally write a bug in the code. After a few days of hard work, you figure out the problem and solve it. The code was pushed to production, you have a working model… It took two years. Two years later, it turns out that the moments (moments, a set of metrics for the distribution of variables and the morphological characteristics) are the key, and your steady distribution of rivier alpha does not capture this feature of reality. Basically the game you are involved in is such a process.
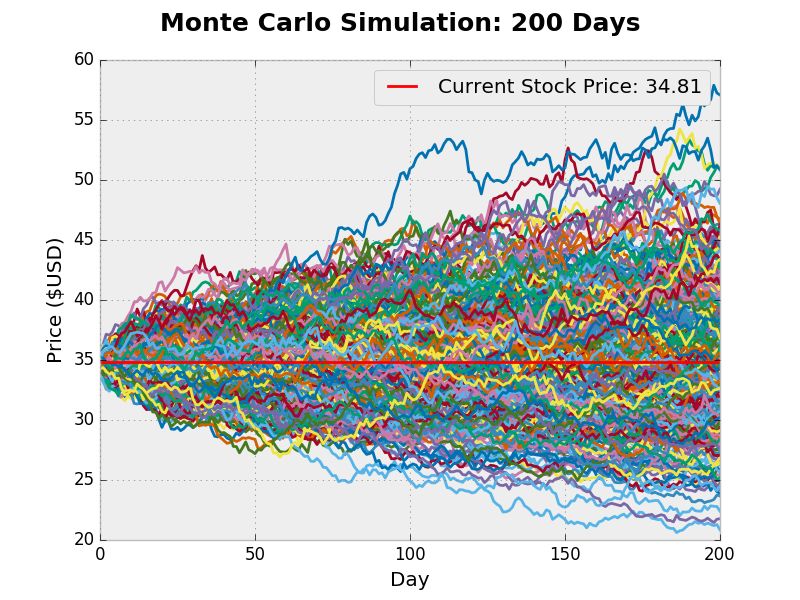
Monte Carlo simulation
Finally, I usually use two heuristics: 1) When in doubt, common sense is used by default. 2) If everything else is the same, simplicity and moderation are better than complex and bloated.
Real world friction
It is one thing to have a theoretically profitable algorithm, but dealing with the friction of reality is another matter.
Suppose you send a request to the exchange to place an order. Usually you will receive a reply confirming that the order has been posted, or an error has occurred and the order has not been released. If one day, your posting request did not receive any response. Do you think this Schrödinger order was released or failed? You are prone to two kinds of mistakes: type 1 (false positive [false positive: the test result is positive, but in fact negative]), type 2 (false negative [false negative: the test results are negative, but In fact, it is positive]), all of which are misclassified. Is one type of error lower than the loss of another?
Suppose you run an arbitrage strategy between two different exchanges. What would you do if there was a problem with one of the APIs when doing a pair of transactions between the two exchanges? One of the transactions may have passed and the other may have failed. Now you have an open position that you don't want. What is the best way to deal with this problem?
How do you handle release delays and cancellation delays when an exchange is under pressure by a DDoS attack or a matching engine under load?
What should you do when an exchange makes unconfirmed, unpublished changes to its API?
Suppose the exchange does update its customer's balance, and the matching engine that executes the transaction is working in parallel, so that the balance that is queried for the transaction success in the same millisecond or microsecond may be related to the balance reported to the customer. The conflict state looks like a trade executed, but the balance has not changed. How do you design your own system to keep pace with this constantly changing world, regardless of the state of the exchange's report and your own conflict?
Assuming the exchange's cost is too high, you can't place a limit order at the best price inferred by the model. Or worse, some of your competitors have privately traded on the cost of the exchange [sweetheart deal): An arrangement or agreement that the parties have privately reached in an informal or illegal manner. ]. How does this change your behavior?
If your bank does not go to work on weekends and the encrypted transaction is running 24/7, how do you deal with the rebalancing of the French currency [Rebalancing: refers to the process of re-adjusting the weight of the portfolio. ]?
It can be said that the same asset cannot be completely equivalent in different exchanges. First, the risk of counterparty on each exchange is different, which means that the asset should be offset by different negative interest rates. Second, since most exchanges have deposit/restrictions, when the limit is reached, it means that you cannot physically rebalance assets between exchanges for a period of time.
In your accounting system, how do you deal with forks, airdrops, dust attacks, and other situations that you can't control and avoid?
Here are some of the heuristics we usually follow:
- Anything that can go wrong will definitely go wrong, even something that you can't think of right now, so you have to fail elegantly when you fail to build things.
- You and all the third parties you connect to (such as exchanges) make mistakes.
- Unlike consumer-oriented technology, don't break things and then iterate quickly; if you lose too much money, you won't have a second chance.
- Create systems and data backups as much as possible, and create redundancy in the operational process to prevent human error
- Don't use floating point types, because when you hit a very low-priced asset class (such as KINBTC), the loss of precision can be very serious.
- Keep enough API calls from the API rate limit to prepare to suddenly cancel all open orders.
Final thought
Trading is one of the only direct goals in the world to transform capital into more capital. Coupled with the nature of the wild west of the encryption industry, you get a sump that gets rich quickly. Everyone wants a simple answer, but no one wants to learn craftsmanship. People want people on TV to tell them the price target, when to buy it, and when to sell it. They want to buy online trading courses for $99.99, or buy TA-based algorithm strategies for $19.99 a month. But no one actually sells you a magic box that can print money; they will keep it for themselves. There is no magic formula about profit and loss. The market continues to evolve and the game becomes more and more difficult over time.
The only way to stay ahead is to hire the best people who can adapt to the ecology and constantly surpass themselves.
The market is a huge poker table where millions of players sit down and everyone believes he/she can surpass his/her neighbors. The person sitting at this table is actually a self-selection. Winning means you have to play a little more than half the capital on the table, which in turn means that you need to be better than 90% of the players, because capital is summed up in the power of the winner.
Culturally, trading games are different from venture capital. In Silicon Valley, it is worthwhile to become a clear optimist by Peter Tell. You need to believe that new technologies will change the world, and you can and will develop ways to achieve this.
In Chicago, which is spread across proprietary trading companies, culture varies widely. In Chicago, it is worthwhile to be a person with a very high confrontational thinking. Everyone is as eager to be a winner as you are, and every time you trade, there is a sly idea in your mind: maybe the opposite person knows what you don't know.
Before facing any real competition in the market, Silicon Valley startups must first fight the indifference of the world. Trading companies are different, and although there are no customers who need to deal with them, they cannot avoid competition from the beginning. The strongest trading company, wrapped itself in the secret.
Cryptographic currency trading is the intersection of these two worlds, and there is no clear winner in this new field.
The chain is authorized by the author of this article to translate and publish the Chinese version of the article.
Written by: Kevin Zhou, market maker of cryptocurrency algorithms, former head of Kraken trading business
Compile: Neo Ge
Source: Chain smell
We will continue to update Blocking; if you have any questions or suggestions, please contact us!
Was this article helpful?
93 out of 132 found this helpful
Related articles
- Why did Ethereum 1.0 fail and Bitcoin succeeded?
- USDT, DAI, Libra, do we really need so many stable coins?
- "Received" game? BTC early investors have already left the market with high prices
- Ethereum 2.0 new virtual machine Ewasm guide: three advantages to fully hang EVM
- BTC short-term test for $9,800 resistance, the disk is not stable, should not chase
- Depth | The dry season is approaching, the analysis of Bitcoin mining industry chain
- The investment "block dog" just collapsed in two days and collapsed 400 people and lost more than 3 million yuan.


