Introduction to blockchain | Correlation analysis between cryptocurrency price and data on chain
Price increases are the most prominent feature of any class of assets, and cryptocurrency is no exception. Bitcoin has become a news hotspot due to its unpredictable price increase, which is beyond any other recent developments in Bitcoin. During and after the price increase, we will hear a variety of speculative remarks about the causes and expected movements of price volatility, but sometimes we ignore the most obvious data. Like many other events in the cryptocurrency network, price increases leave a mark on the underlying blockchain.
Today, I want to highlight some important indicators and analysis examples that can help us understand the price increase based on chain behavior.
There are several reasons for analyzing the price increase behavior associated with the data on the chain: First, the chain signal can reveal the mystery of some subjective and speculative analysis formed after the price rises. More importantly, understanding the patterns in the indicators on the chain can help us identify relevant conditions that can be used as predictors of new price increases. With some exceptions, most price increases are unexpected events, so we will use our imagination to make a reasonable explanation for their reasons.
- Deciphering the central bank’s research and development of digital currency for 5 years
- The significance of blockchain currency: or promote a new round of development of the international digital economy
- The RMB “breaks seven”, the Litecoin halved, and Bitcoin has crossed $15,000 this week?
1. Three stages of price increase
Price increases are very important for investor behavior and psychology of any crypto asset. While the structuring process of the open market and the stock exchange's control mechanisms provide the ability to clearly explain and even constrain price increases, these factors are completely different in cryptographic assets. Using some of the perspectives of behavioral psychology, we can describe three different stages of rising asset prices:

(1) Unexpectedly: Most of the price increases were unexpectedly triggered, leaving most investors unprepared.
(2) Trend tracking: Contrary to most of the principles in technology trading, that is, never chasing up and falling, many retail investors do exactly that. If the price increase is triggered by a major cryptocurrency such as Bitcoin, a normal mode of operation is what it takes to find the altcoin.
(3) Subjective interpretation: The rise of cryptocurrency is a perfect case study of the behavioral finance narrative fallacy model. In the case of severely asymmetric information, pseudo-experts attempt to make the most incredible explanation for the factors driving price increases and use them as predictors of future price movements.
Unlike other asset classes, cryptographic assets record many events in the lifecycle in a publicly available blockchain. When it comes to price increases, data on the research chain may be one of the most effective ways to understand the effects and behavior of price increases.
2. Chain indicators: leading, backward or coincident
In the financial market, there are three basic indicators that can be used to understand a given asset class:
(1) Leading indicators: indicators that point to future events.
(2) Lag index: An indicator that confirms that an event has occurred.
(3) Synchronization indicators: indicators that occur in real time and clarify economic conditions.
Understanding the data on the chain of encrypted assets not only helps to clearly understand how price increases are reflected in the blockchain, but also helps to identify clear conditions that signal a new round of price increases.
3. What does the blockchain tell us about price increases?
The blockchain provides a lot of data to help us understand the mechanism of price increases. Using data from the chain, we can provide some unique metrics related to large price fluctuations in crypto assets.
3.1. Profits of token holders: analysis of the allocation of funds in and out
A clear sign of rising prices is the rise in the number of token holders. The analysis of the inflow and outflow of funds reveals the distribution of money and money lost by token holders. After the price rises, we should see the number and size of the green circles in the chart below increase. If we compare the Bitcoin indicator (some recent price increases) and the results of Ethereum, we can see some strong comparisons.
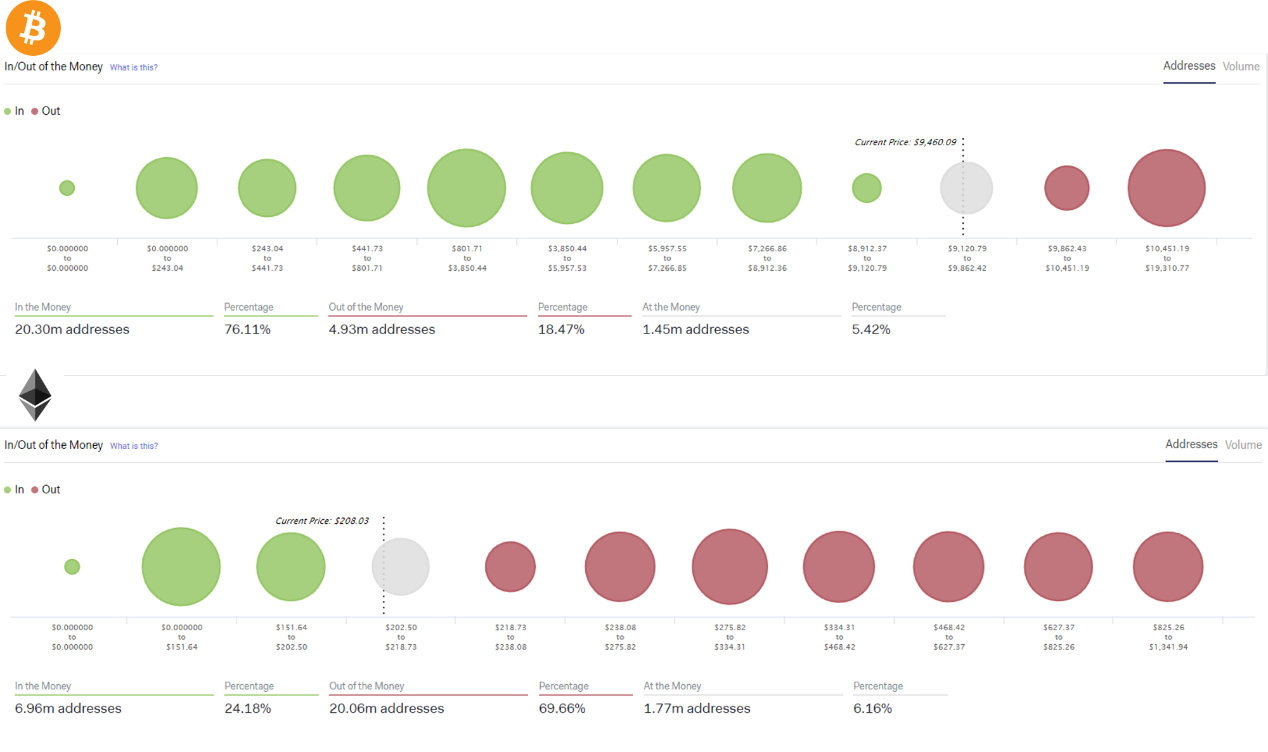
Source: http://intotheblock.com
The problem with the entry and exit of funds is that they may be behind or may be ahead of price increases.
3.2. Increase in the number of new investors: analysis of trader indicators
New investors are often one of the most important factors in any price increase. Counting the number of new and active addresses on a given encrypted network helps to understand the impact of new investors on previous price increases and the conditions for new price changes. Trader analysis shows that the recent price increase of Litecoin has created more and more new addresses.
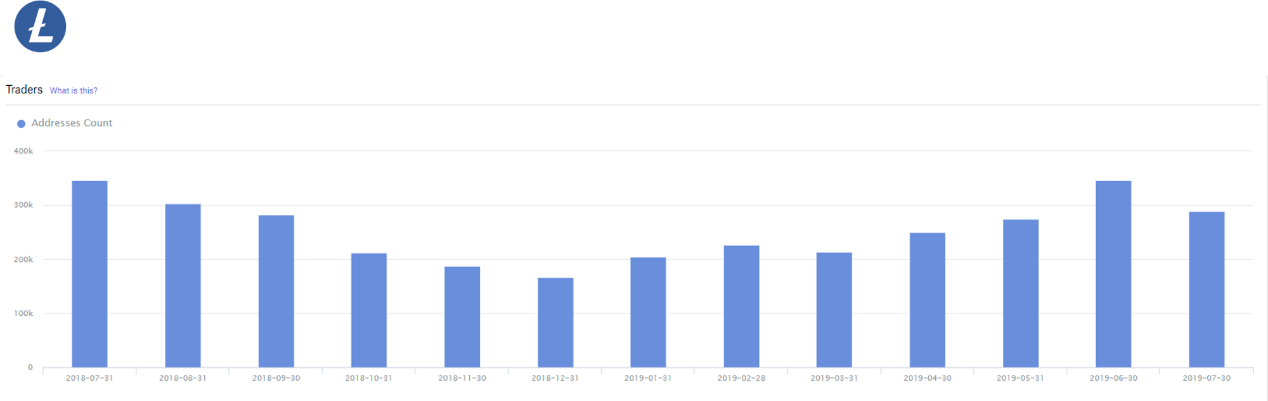
Source: http://intotheblock.com
3.3. The whale trade is more active: analysis of concentration indicators
Large investors are usually associated with rising prices. In some tokens, large players mainly play the role of passive investors, while in other tokens, large transactions are active, causing price fluctuations. The analysis of large-scale activities shows the trading activities of large investors. The analysis of BCH is as follows:
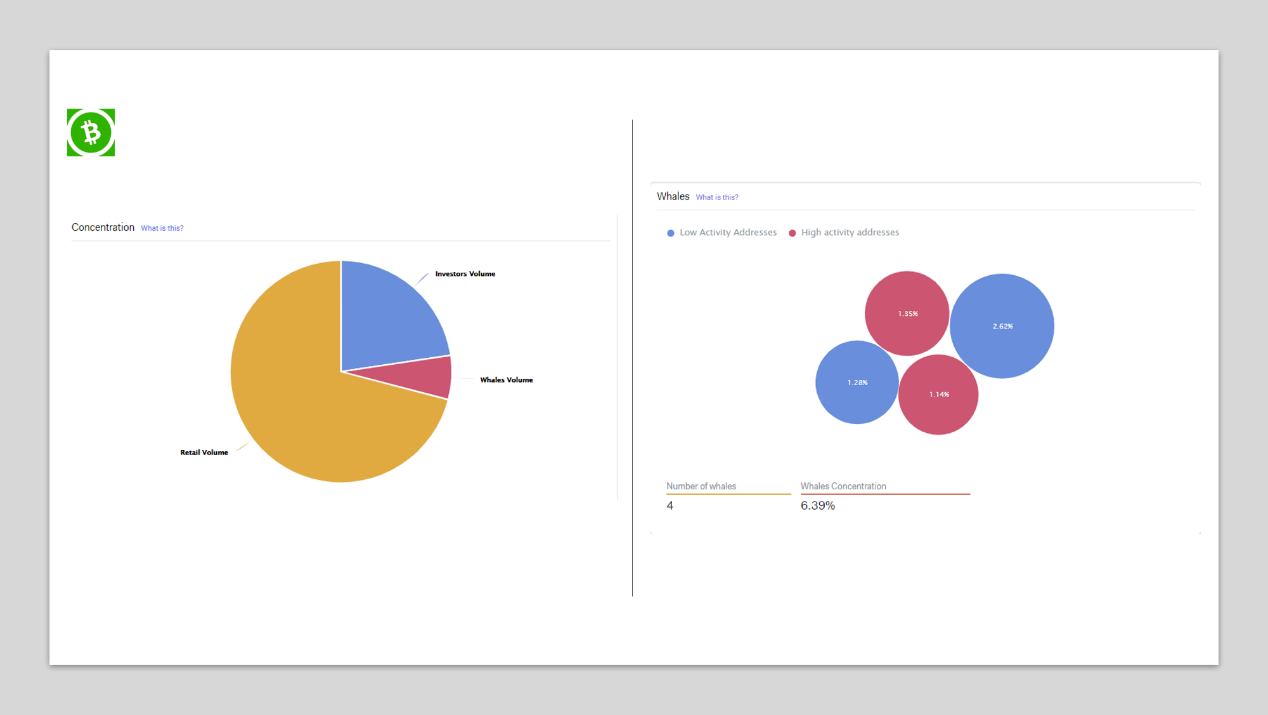
Source: http://intotheblock.com
3.4. Increase in the number of active addresses: analysis of address activity indicators
A clear sign of rising prices is the increase in the number of active addresses. In any price increase, we should see more and more active addresses and new addresses entering the network. The address analysis shows the number of active addresses, new addresses, and zero balance addresses, and you can see that ETH looks very healthy.
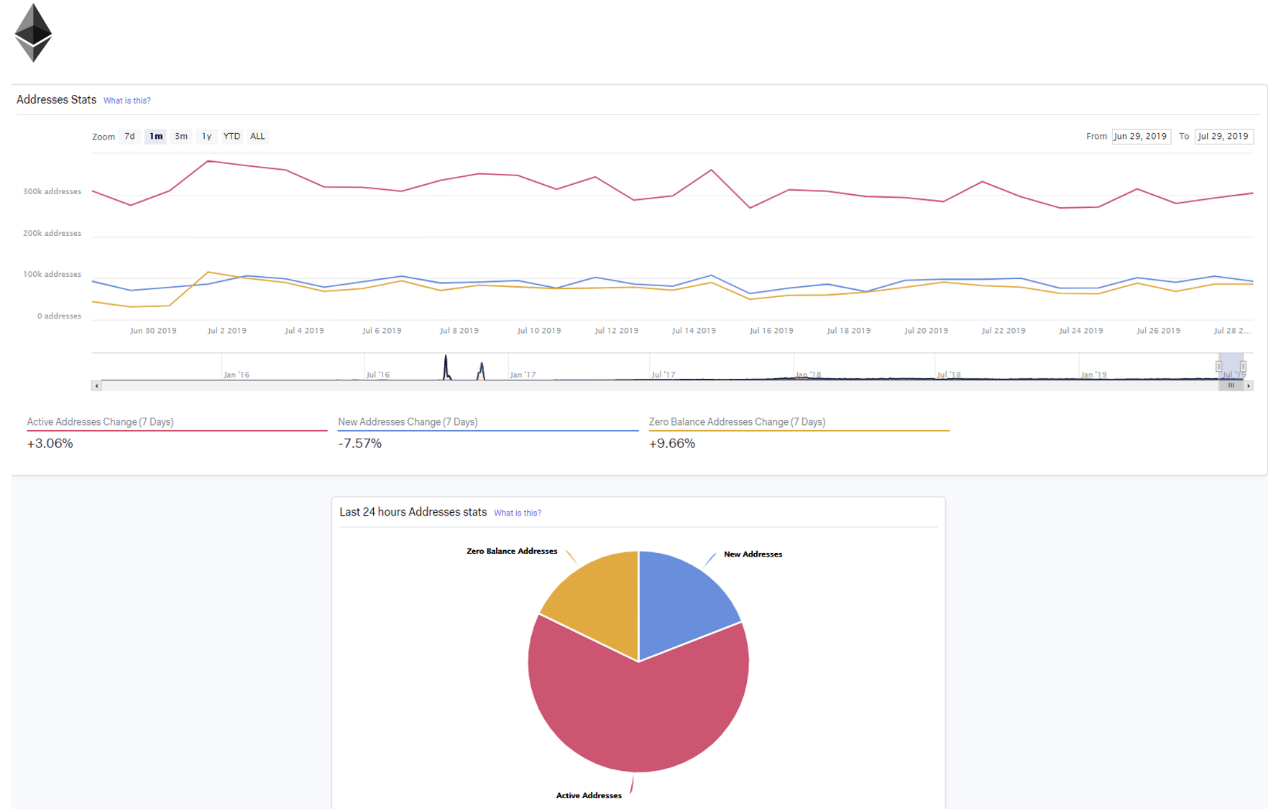
Source: http://intotheblock.com
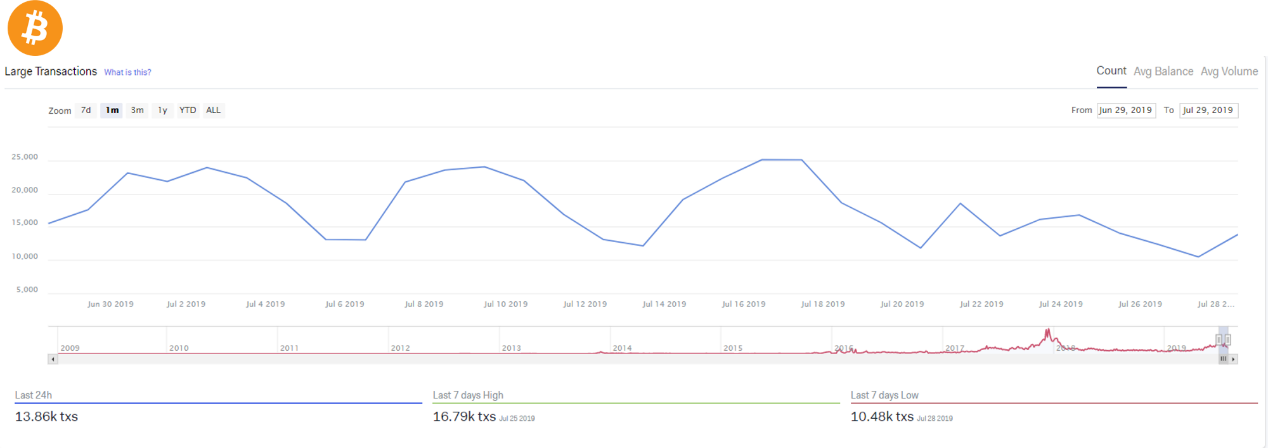
3.5. Increase in the number of large transactions: large trading activity indicators
Large-value chain transactions are often a sign of large capital transfers, which can indicate that a trading fund accounts for a large proportion of assets, and can also be used to aggregate a large number of smaller transactions. These two indicators tend to rise significantly during the price increase.
The analysis of the data on the chain is not very obvious, and it is difficult to achieve it on a large scale. However, when it comes to price increases, the on-chain dataset provides some of the richest and more accurate reference data to help us understand price increases and predict future growth conditions.
Author: Jesus Rodriguez
Translation: Bitker Institute
Disclaimer: This article was compiled by the Bitker Institute. The Bitker Institute focuses on theoretical exploration of the blockchain industry, technology development, and analysis of the secondary market analysis of digital currency.
We will continue to update Blocking; if you have any questions or suggestions, please contact us!
Was this article helpful?
93 out of 132 found this helpful
Related articles
- Bitcoin price recovery, driving the blockchain industry investment and financing continue to pick up
- South Korea's second largest bank develops blockchain-based stock lending business
- Dragon White: The Central Bank Digital Currency Q&A Handbook – a book that takes you through CBDC and Libra
- The era of negative interest rates is coming, can BTC keep up with the pace of gold?
- Comment: Is Libra a paper tiger?
- On the line in March, the daily trading volume broke through 100 million, and the FTX exchange that turned out to be so hot is so hot?
- Ethereum: What will be the next four years?