A picture to understand the world currency and market
Foreword: How big is the current asset market in the world? What proportion of bitcoin and cryptocurrency is in the entire world currency and market? It feels like a slap in the face, understand this, you can know that bitcoin and cryptocurrency are still childish and early. The proportion of assets in the world money market has been evolving and will become more and more exciting in the future.
All the currencies and market sizes in the world are in this visual chart, which is long and long:
- Is DeFi a flash in the pan? Fund big coffee Pomp believes that automation finance is the future
- ETH breaks the daily resistance and leads the mainstream currency
- 500,000 new ASIC mining machines are sturdy, BTC's entire network is breaking 100EH/S just around the corner
(Image courtesy of MoneyProject, a collaboration between the author and Texas Precious Metals. Blue Fox Note: Due to some non-real-time data, there will be some discrepancies. For example, the market value of Bitcoin is currently more than $180 billion, and Ethereum is 200. About $100 million, not the $100 billion and $28 billion that I said in the picture, but we can get some intuitive feelings from the macro scale.
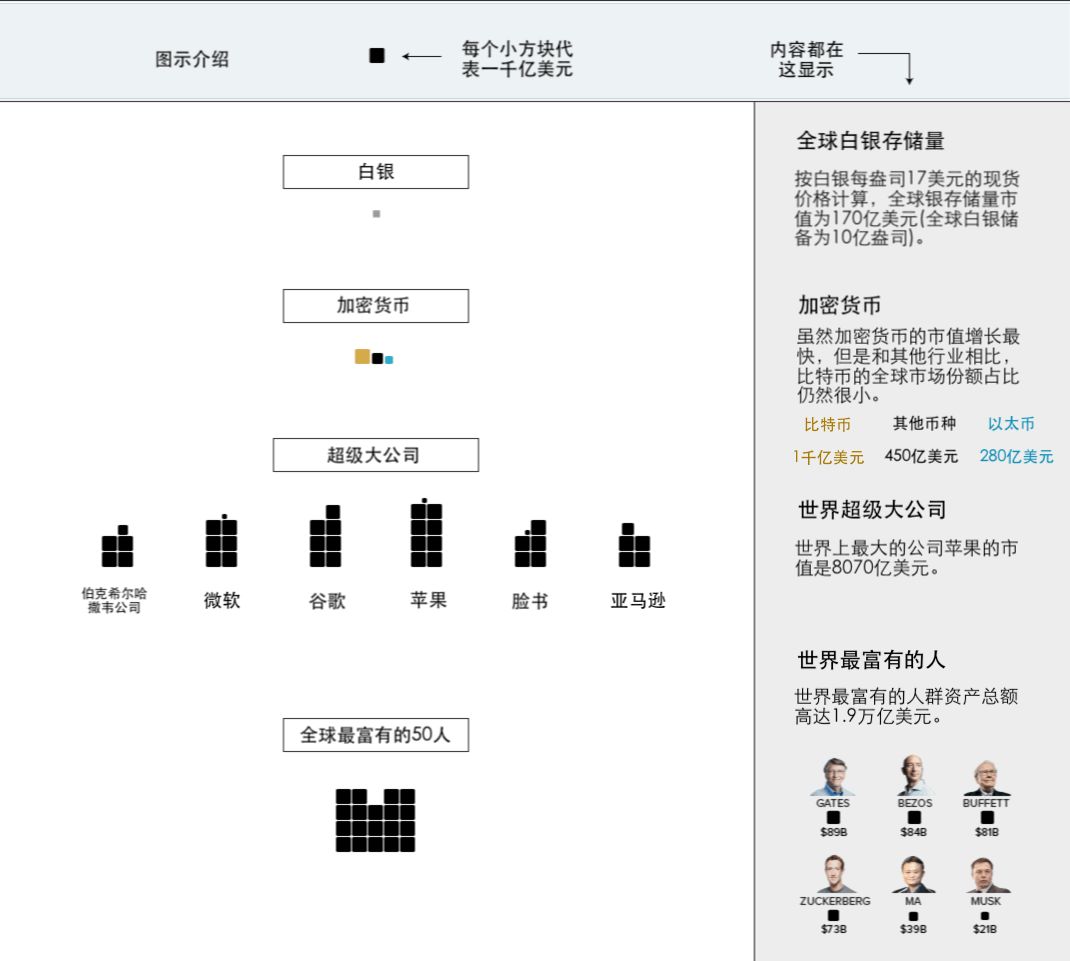
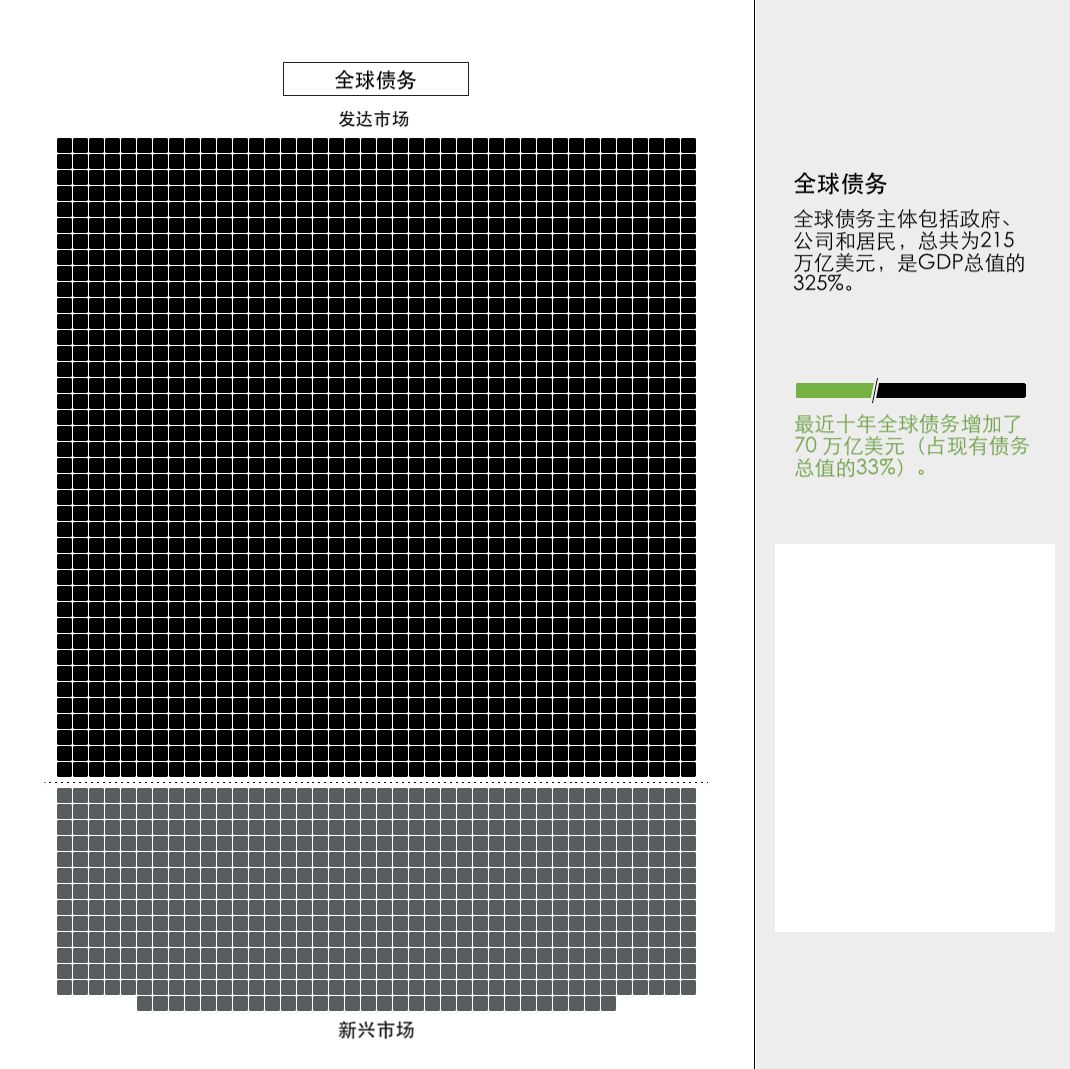
When we talk about the sheer size of Apple, the wealth of Warren Buffett, or the huge debts that accumulate globally, all of this sounds huge, but it's actually just because of their size.
That's why we visualize things spatially, because it allows us to understand money and markets from a better perspective.
So how much is it?
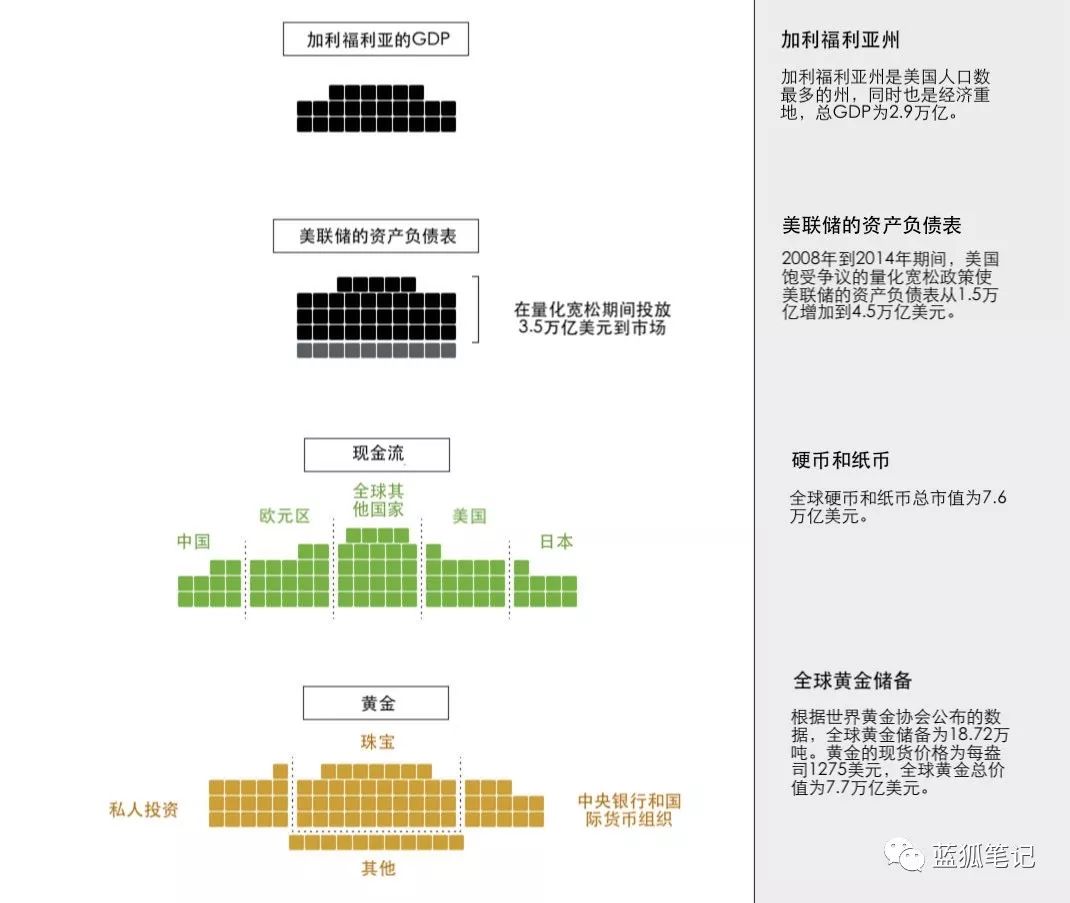
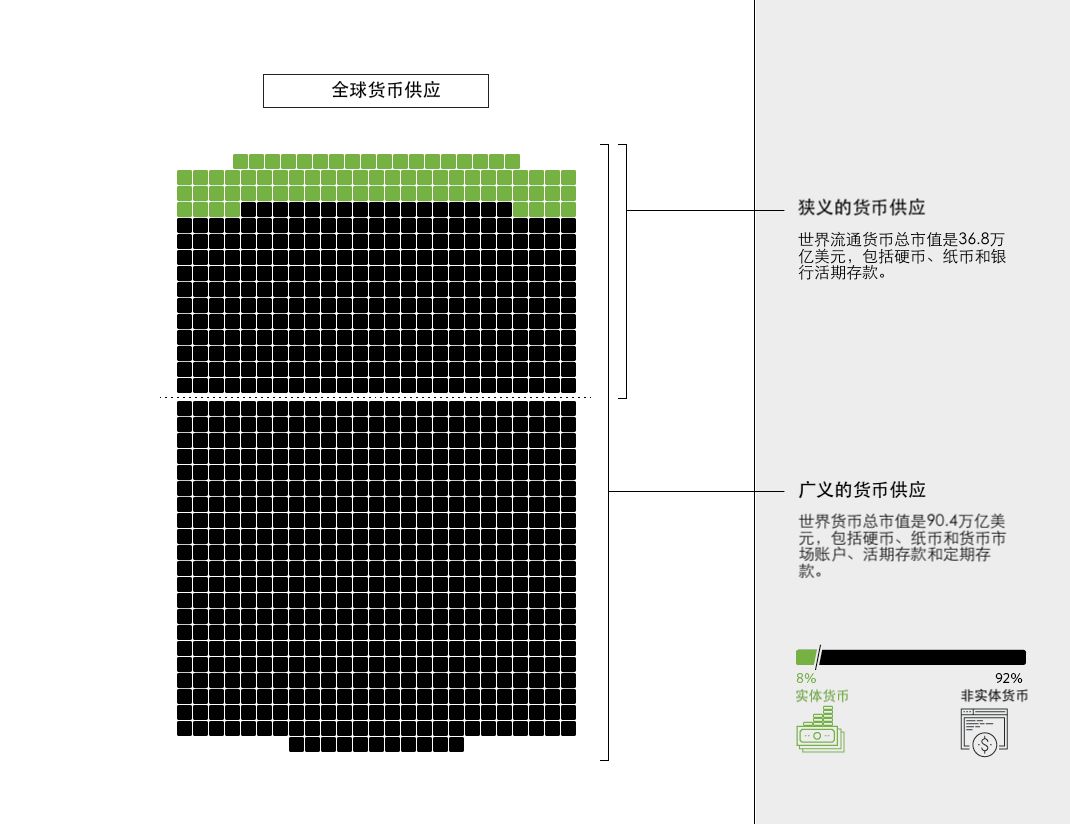
This infographic was originally intended to show the different forms of existence of the currency. For example, the amount of actual cash is highlighted in comparison to the broader monetary measures, including savings and checking account deposits.
What exactly is "money" depends on who you are asking. Gold, bitcoin or other hard assets, are they money?
a new meaning
However, since we first published this infographic in 2015, “global currency and markets” have different meanings for us and many others. This picture simplifies complex currencies, assets, and other financial instruments in a way that people can understand.
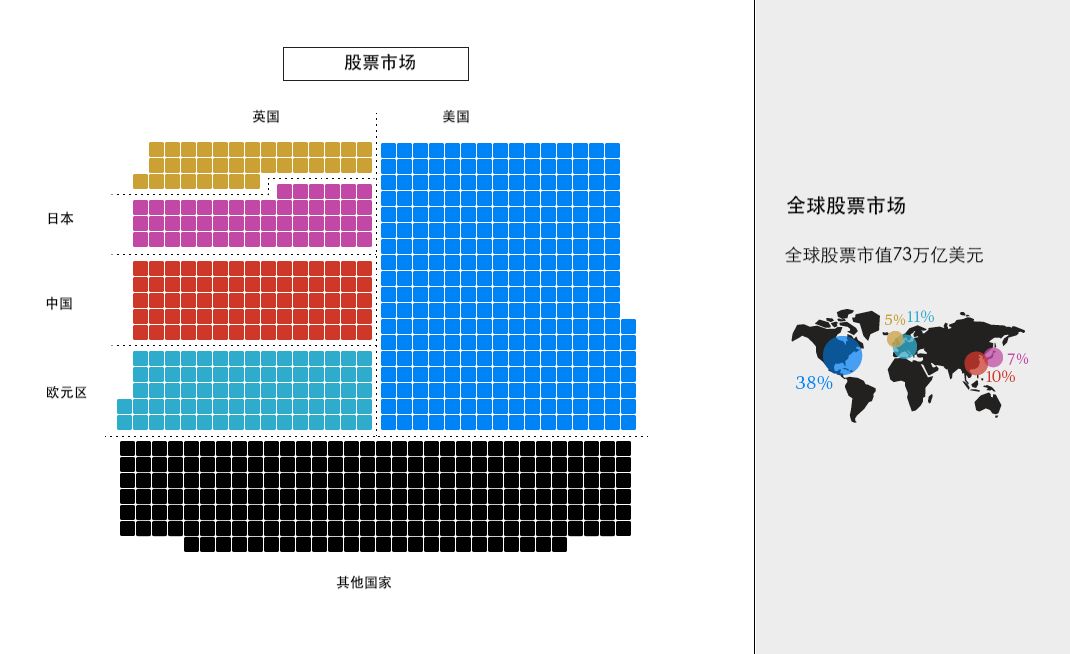
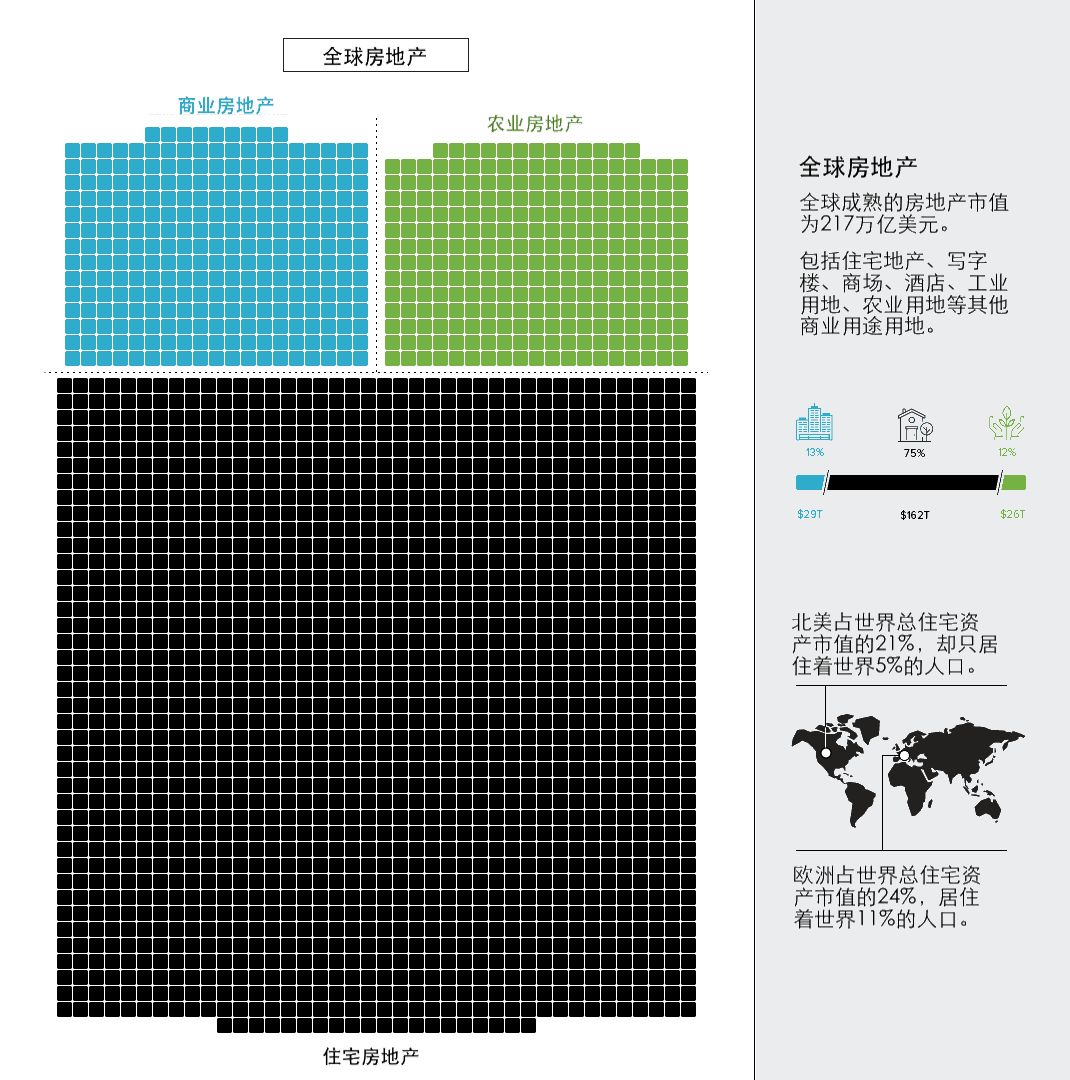
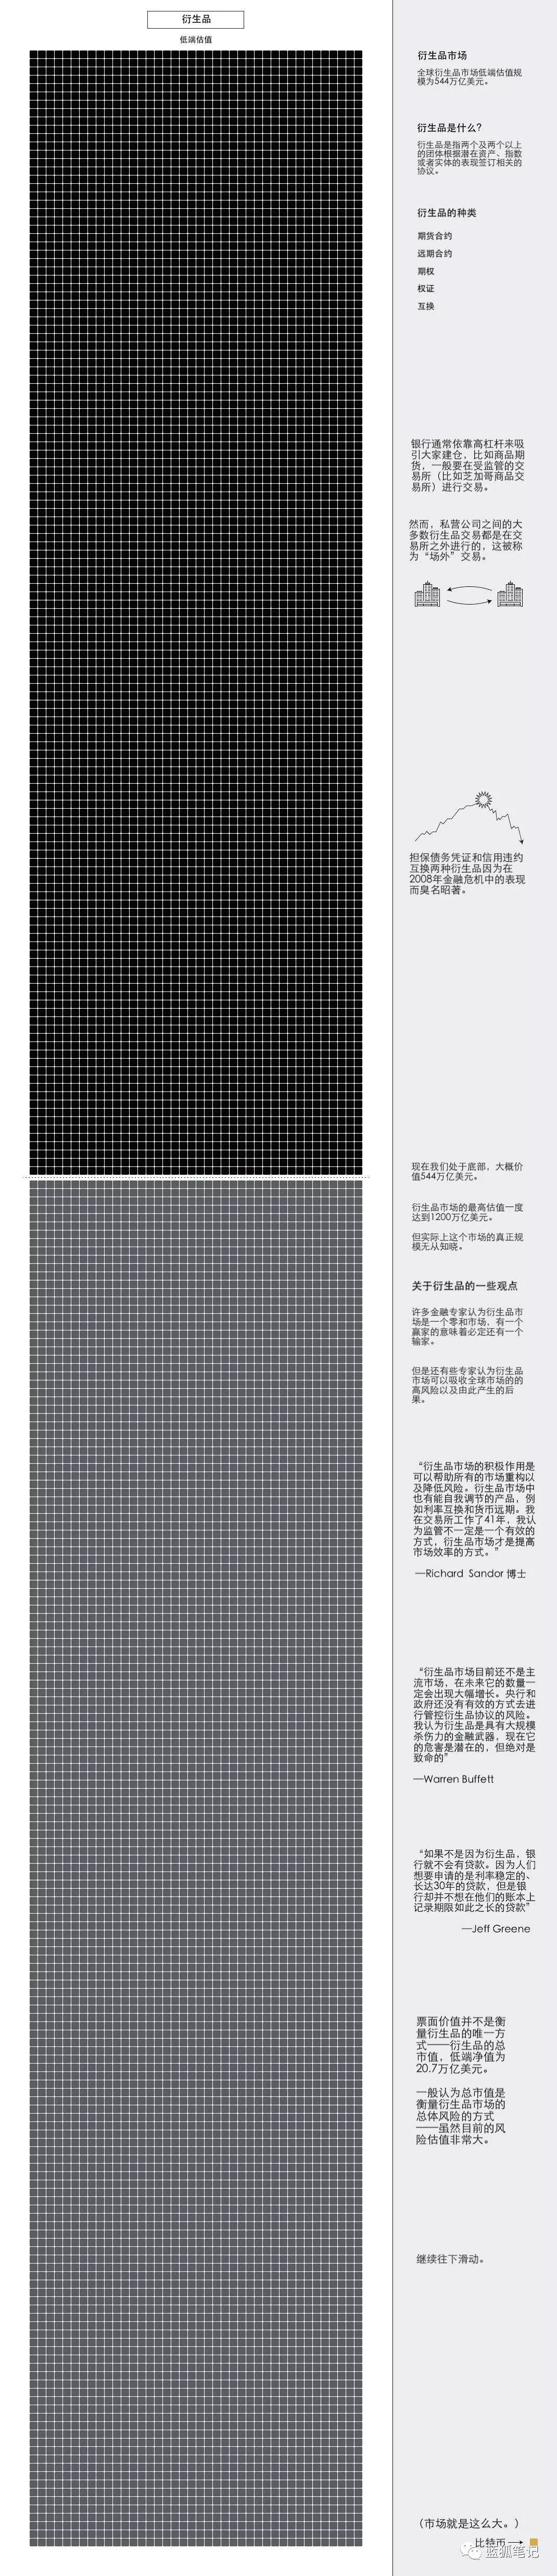
The figures shown in the data visualization include the silver market ($17 billion) and the face value of all derivatives (high-end estimates are $1,200 trillion). Between these two extremes, we have added many other familiar indicators, such as California's GDP, stock value, real estate market, and different money supply indicators.
What is the end result? We have learned about the vast global asset universe through a simple and illuminating new approach.
The author of this article, Jeff Desjardins, is translated by the "Lu" of the "Blue Fox Notes" community.
We will continue to update Blocking; if you have any questions or suggestions, please contact us!
Was this article helpful?
93 out of 132 found this helpful
Related articles
- What role should the IEO start in the second half?
- Viewpoint | The market is just around the corner, the bear market is coming to an end?
- Interview with FISCO BCOS Zhao Zhenhua: Meeting the distributed business with open mind
- ConsenSys Announces Decentralized Financial Project "Codefi" to Promote Ethereum Enterprise Adoption
- Cryptographic currency lending: Innovation or emulation?
- Defeat the dry season: Will the miners' northward move be smooth in 2019?
- Wu Jihan's latest speech: Analysis of the market, space and time factors affecting the marketability of Bitcoin


