Analysis of the price of Ethereum on May 7

Key points
After testing the key support at $160, Ethereum rebounded well.
The currency price has broken through the resistance levels of 165 US dollars, 168 US dollars and 170 US dollars in the process of rising.
- Bitcoin price analysis on May 7
- Buffett regrets missing Google, Amazon, and he will regret the miss of Bitcoin in the future.
- Wave field reveals key vulnerabilities that could lead to blockchain collapse
Ethereum broke through the contraction triangle in the hourly price chart during the ascent, with resistance at $162.
Ethereum touched a weekly high of $180 and was well supported.
Ethereum price analysis
Yesterday, the Ethereum trend was relatively bleak, and the price of coins continued to fall and fell below $165. At the time of the $160, Ethereum met buyers and held the decline. As a result, Ethereum began to re-strength and broke through the resistance levels of $162 and $165. The currency price trend eventually changed, and Ethereum was above $165 and 100-hour SMA.
Ethereum broke through the contraction triangle in the hourly price chart during the ascent, with resistance at $162. Soon, Ethereum broke through the resistance levels of $165, $168 and $170. The currency price even broke through the resistance level of $175 and formed a new high this week around $180. At present, Ethereum is consolidating above $175. The first support is $175 and the last volatility of the 23.6% Fibonacci retracement (from a low of $160 to a high of $180). If the price falls, Ethereum may test $169.
Before the $169 level was a resistance level, it has now turned into a support level. The last volatility of the 50% Fibonacci retracement (from a low of $160 to a high of $180) is also around $169. If the price rises, the main resistance is around $180-$181. If the price closes above $180, Ethereum will continue to move towards $185 and $192.
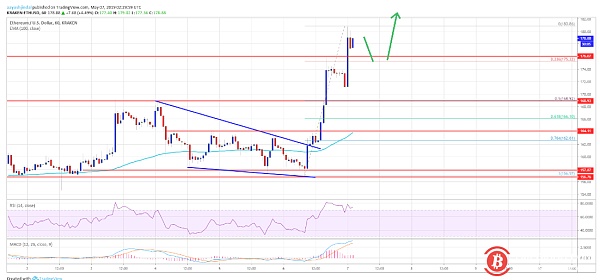
As can be seen from the chart, Ethereum has a strong rise from the support of $160. Currently, the price trend is relatively positive and is likely to break through the resistance level of $180. Buyers will even lock their targets to $200 in the next few days. If the price falls, the main support is at $175, $170 and $169.
Technical indicator signal
MACD per hour – MACD is currently reducing its bullish slope
RSI per hour – RSI is currently well above 70, angle is bullish
Main support level – $169
Main resistance level – $180
Author: Kiran
Remarks: Bitcoin86 manuscript article, please indicate the source. The article is an independent view of the author and does not represent the standing position.
Disclaimer: This article market analysis is for reference only and does not constitute any investment advice or advice. Risk control, thank you.
We will continue to update Blocking; if you have any questions or suggestions, please contact us!
Was this article helpful?
93 out of 132 found this helpful
Related articles
- Why do bitcoin miners have a few days of sorrow every month?
- Buffett hates the three main reasons for bitcoin
- Bitcoin developer Pieter Wuille released two new BIPs and is expected to implement Taproot in the next soft fork
- Investment institutions: Bitcoin will climb to 100,000 US dollars, the altcoin will "dead"
- Ethereum price analysis on May 6
- Seeing the systemic risk of Tether (USDT) from the trend of USDT
- Is it still possible to buy Bitcoin now?