Depth | Beyond 2020: BTC Fundamentals Analysis
Source: Crypto Valley Live
Author: Howard

A sudden new pneumonia epidemic disrupted the work and life rhythm of most people. We seem to have entered the Ice Age from the fast lane. In fact, this black swan incident has not been the first time since 2020. From The Iraq-U.S. Crisis, Brexit, and the outbreak and spread of nCoV in 2019, the global economy is under the shadow of a huge uncertainty. As Taleb mentioned in his "Black Swan": Our world is Dominated by extremes, unknowns, and very unlikely events, our environment is more complex than we realize.
- Lingting: Under the disaster, the blockchain needs a "medical observation"
- Analysis: why Bitcoin will rise periodically around halving
- China files 84 patents for central bank digital currency
In fact, every Black Swan incident is an opportunity to rebuild social order and distribute wealth. We need to face up to the impact of this black swan incident. There are both dangers and opportunities. The opportunity lies in emerging, anti-fragile things. Since the birth of BTC, it has been announced by the media 363 times. Every time the price drops, the news of BTC's death will be heard. However … BTC may have a very good anti-fragility to deal with uncertainty in a certain way. Entering a new decade in 2020, fundamental analysis of BTC, an alternative emerging asset, may help us.
"History and society are not crawling slowly, but jumping step by step. They jump from one fault to another with very few twists and turns. "

BTC and the crisis
BTC was born in 2008. As everyone knows, in 2008, the Black Swan incident of the subprime mortgage crisis occurred in the United States, and then triggered a global financial crisis. The global financial market fell into a panic. The stock market crashed, and the old investment bank Lehman also declared bankruptcy. In October 2008, Satoshi Nakamoto published the famous BTC white paper "Bitcoin, A Peer-to-Peer Electronic Payment System." On January 3, 2009, Satoshi Nakamoto proposed the actual operation of the BTC theoretical system. The so-called "mining" process, the first BTC block was born, which contains 50 BTC.
The coincidence of the world financial crisis and the birth of BTC in time does not mean that there is a direct correlation between the two. However, behind the two isolated events of the world financial crisis and the birth of BTC, there is a strong historical and logical relationship. BTC is not a product of the subprime mortgage crisis. Satoshi Nakamoto actually started to design the BTC code in 2007. Finally, in 2008, when the subprime mortgage crisis broke out, he officially launched this social experiment with the geek spirit of free money.
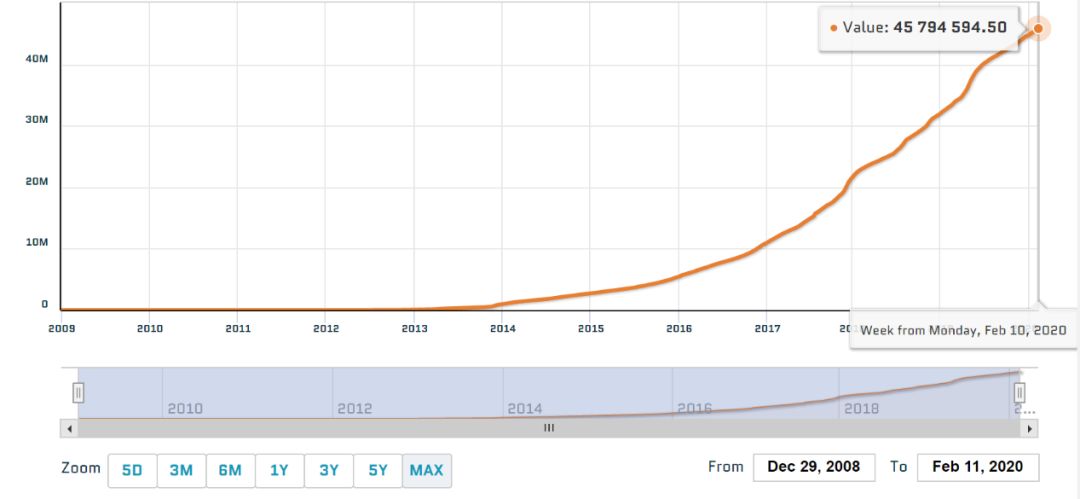
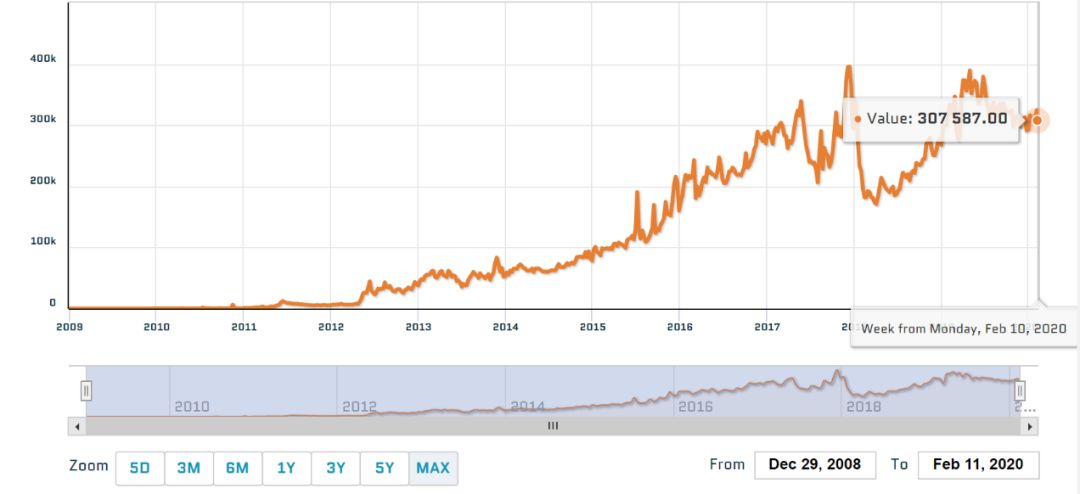
We can see that under the crisis, the basic means for governments to respond to the financial crisis is generally quantitative easing of the money supply, expanding government investment and strengthening their influence on the economy. As a result, it has promoted a new world-wide Round of inflation. It is precisely BTC that provides a new idea and choice to overcome the inherent defects of fiat currencies. BTC's digitalization, no license, scarcity, and decentralization have attracted more and more people, not only BTC users or BTC active trading addresses. All show a steady growth trend.
BTC wallet users (continuous growth)
Number of BTC's active trading addresses (steady growth)
In the following, we can focus on analyzing the fundamentals of BTC from seven related indicators.

Sharpe Ratio
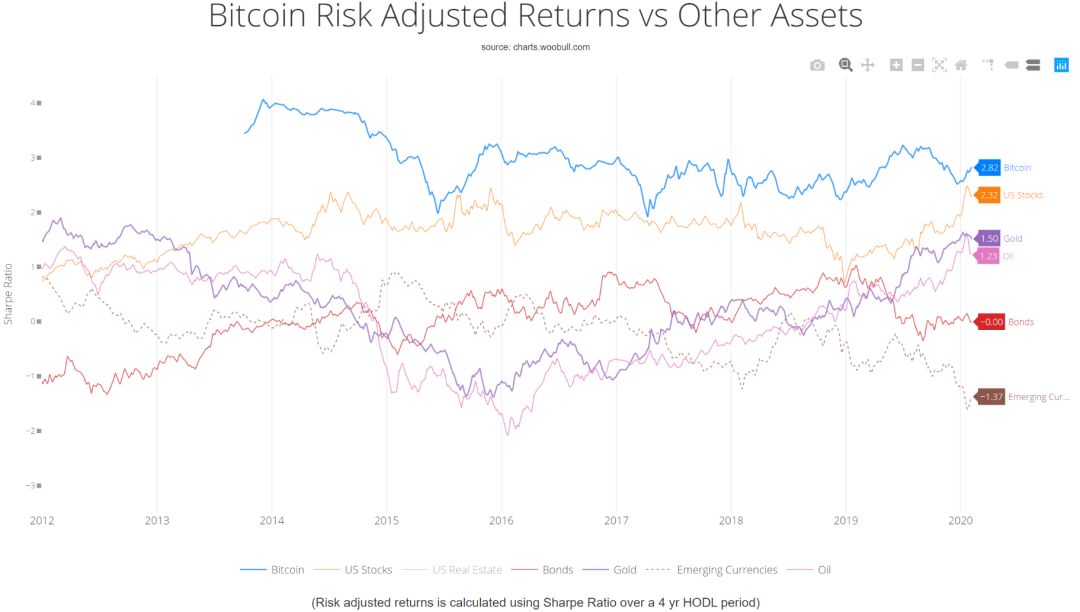
After ten years of development, BTC has evolved from an obscure geek game into an asset with a market value of nearly 200 billion U.S. dollars. It has already entered the perspective of mainstream institutions and has become an alternative asset allocation category that cannot be ignored. The Sharpe ratio is the most commonly used measure of portfolio management when measuring assets, also called return-to-volatility ratios.
Sharpe ratio = ( expected rate of return-risk-free interest rate ) / portfolio standard deviation.
If we compare and analyze the returns of related assets since 2012, it can be seen that the Sharpe ratio of BTC is always ahead of other assets. , Bonds and emerging market currencies. The Sharpe ratio of BTC currently reaches 2.82, which is a relatively healthy level.
As everyone knows, BTC has always been regarded as "digital gold". In the past 10 years, the value of BTC as digital gold has increased significantly. Both gold and BTC are safe harbors to avoid the depreciation of fiat currencies. BTC has the advantages of digital technology and has become a value storage method that can compete with gold in the digital age.
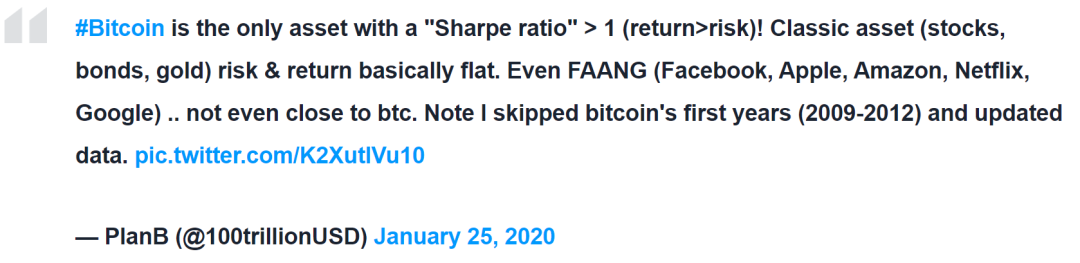
Analyst PlanB (@ 100trillionUSD) research on January 25 this year showed that the profit-to-risk ratio of BTC also surpassed the Internet giant FAANG.
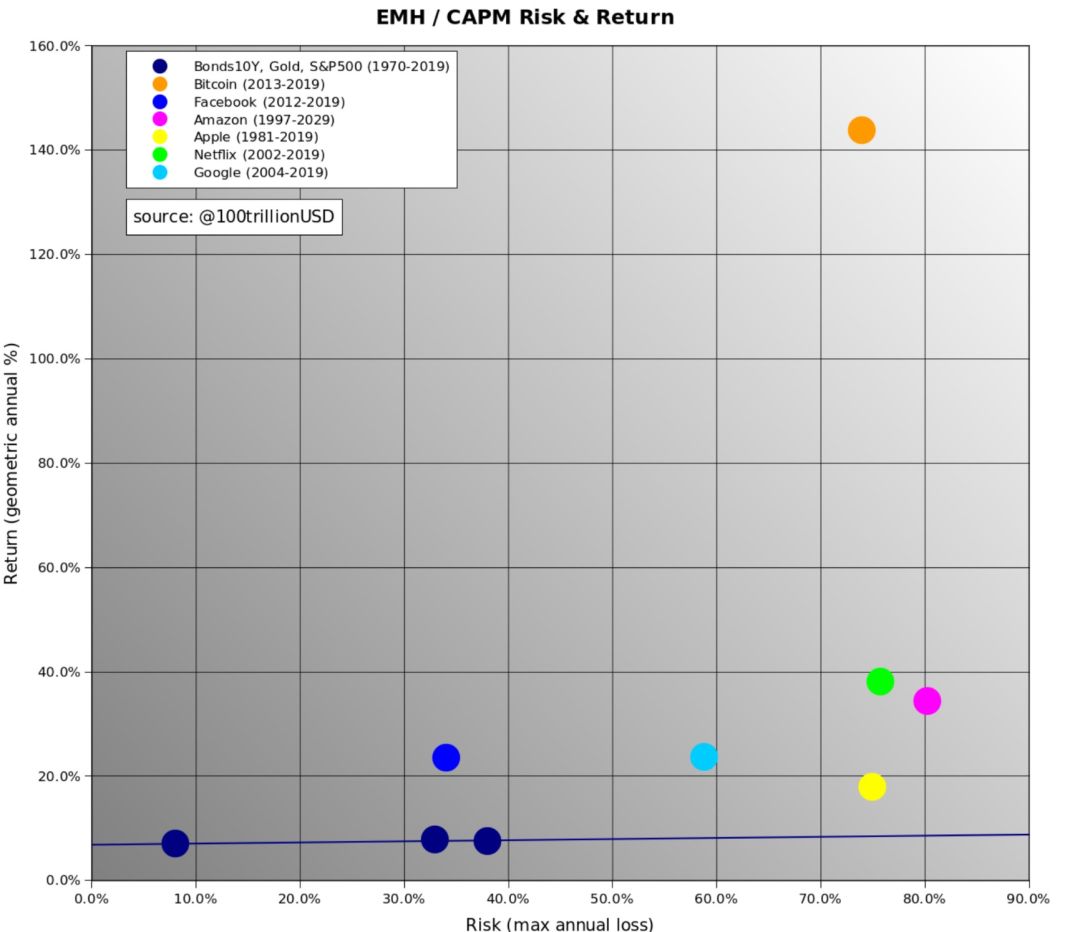
Since 2020, we are in a turbulent world, and we all hope to find an asset with low valuation, asymmetric risk and return, and BTC is a tool or a good choice for hedging actual risks. Fidelity Investment, an asset management giant from the United States, pointed out in May last year that 22% of institutional investors have entered the market, and nearly half of investors have considered increasing BTC investment.

S2F Model
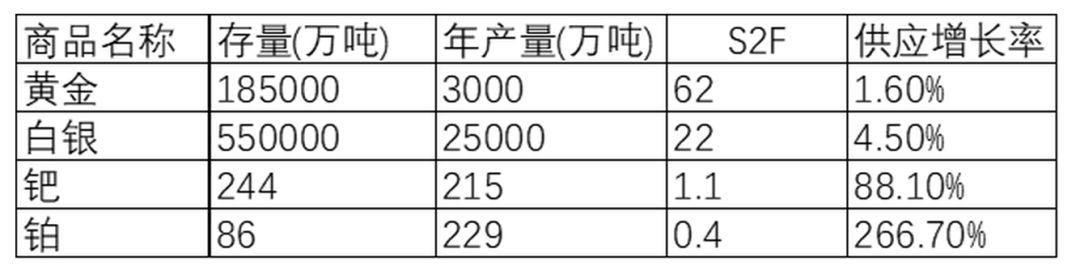
Scarcity is an attribute of asset value. Under the economic mechanism of supply and demand, generally speaking, the scarcer the commodity, the higher the price. BTC is the world's first scarce digital commodity, and at the same time, it can be transmitted via the Internet, radio, short message or even satellite. The S2F model is a good quantitative analysis model.
S2F Model: The reciprocal of the annual supply growth rate of Stock to Flow ( = 1 / inflation rate) , derived from the commodity market used to measure asset scarcity, or an indicator of "hardness". Economist Saipedean Ammous in The The In the book Bitcoin Standard, S2F, which was originally used for commodity market analysis, is used on BTC. S2F provides a simple quantitative framework for analyzing the price trend of BTC: this is an indicator with strong explanatory power, making BTC comparable to gold and its close relatives.
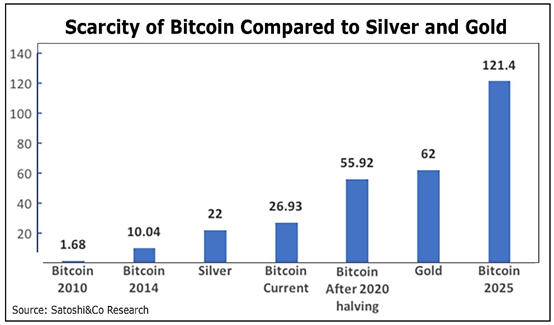
Figure: S2F indicators of several precious metals
The latest BTC's S2F is about 27 (= 18200000/1800 * 365), which is about 56 after halving in May 2020, which is almost close to the hardness of gold. After halving in 2024, the hardness (inflation rate) of BTC will reach 110, fully surpassing gold, and becoming the most "hard" and scarce asset.
Analyst PlanB (@ 100trillionUSD) extended this in his "Modeling Bitcoin's Value with Scarcity" article, he found that BTC market value has a strong correlation with S2F, and used this to predict future BTC prices. BTC is a "Super hard" assets. In his model, there is a complex power-law relationship between BTC price and S2F value, a power-law function, monthly data from October 2009 to February 2019, BTC price = 0.4 * S2F ^ 3 , If using annual data, BTC price = 0.18 * S2F ^ 3.3 .
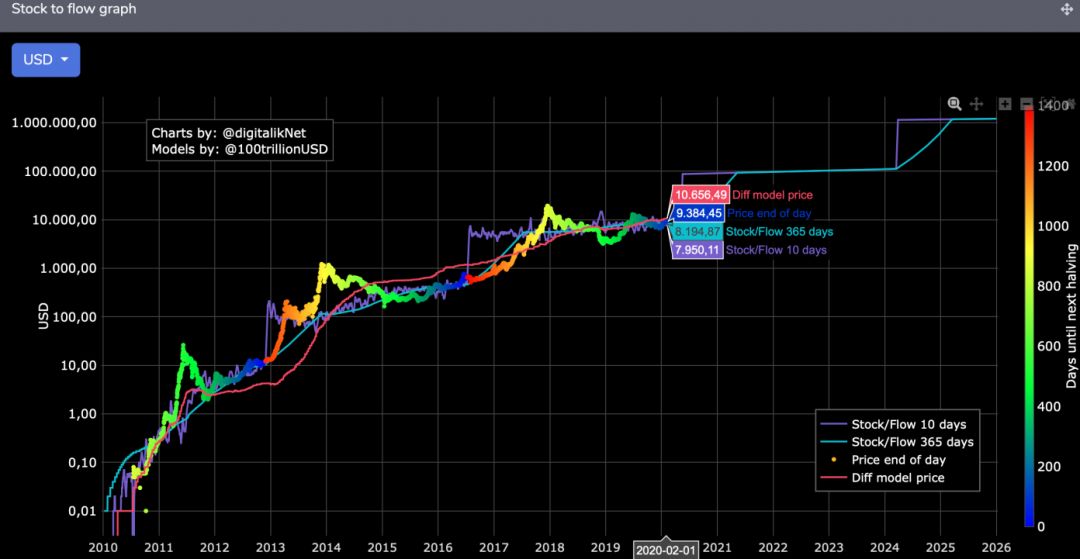
According to the monthly formula, the value of S2F 55 after halving is calculated. The price after halving should be about 66,550. According to the annual formula, the price after halving is higher, which can reach 99,648. But as shown in the previous figure, there will always be deviations between actual prices and theoretical values, but these deviations are basically within an acceptable range.

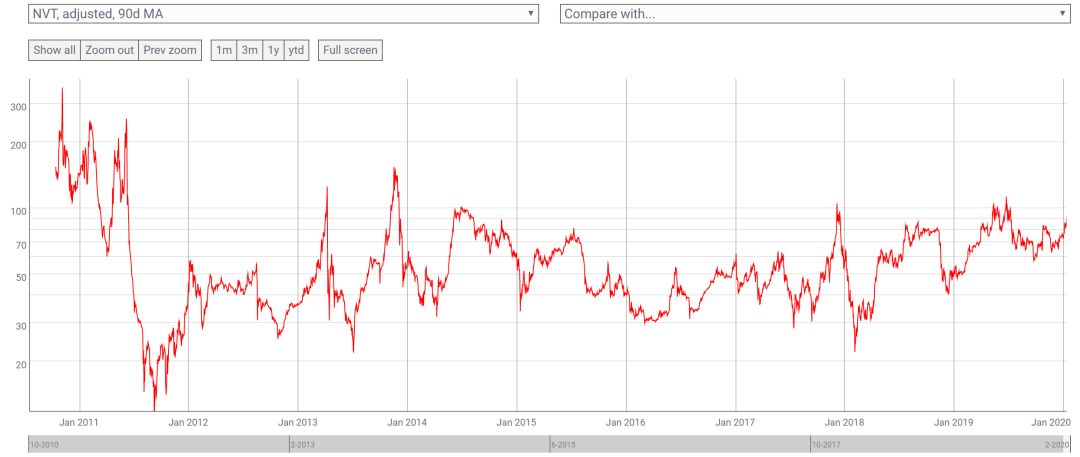
NVT Ratio
In the traditional stock market, PE price-earnings ratio is a good indicator of the company's performance and valuation. PE = stock price / earnings per share EPS. A high price-earnings ratio generally means that the valuation is too high or there is a high potential for performance growth.
However, in the crypto world, each project usually does not bring real gains or profits. PE indicators cannot be adapted to the valuation of crypto projects. Willy Woo proposed the concept of NVT (Network Value to Transactions), which flows through the network of funds ( Transaction funds) as a proxy indicator of the value of the network.
NVT = Market Cap / Day Transaction Amount.
Generally speaking, the interpretation of NVT has the following aspects:
- A high NVT ratio can indicate high speculative value. We see that in the early 2009-2011 period of BTC, NVTs were all above 100, indicating that the investment win rate was very high at this time.
- Foam can be detected using the NVT ratio. But predicting a bubble before the facts are quite difficult, because skyrocketing prices do not necessarily mean that assets are in a bubble. We can only determine this after the market re-evaluates the peak of the new valuation and we see if the price consolidates or collapses. For example, when we saw that the BTC price also reached ATH 20,000 in December 2017, and the NVT index reached 105, the market began to adjust, the bubble was burst, and the NVT index began to fall sharply. In 2018, the NVT index in the big bear market Has been corrected to the lowest point of 22.
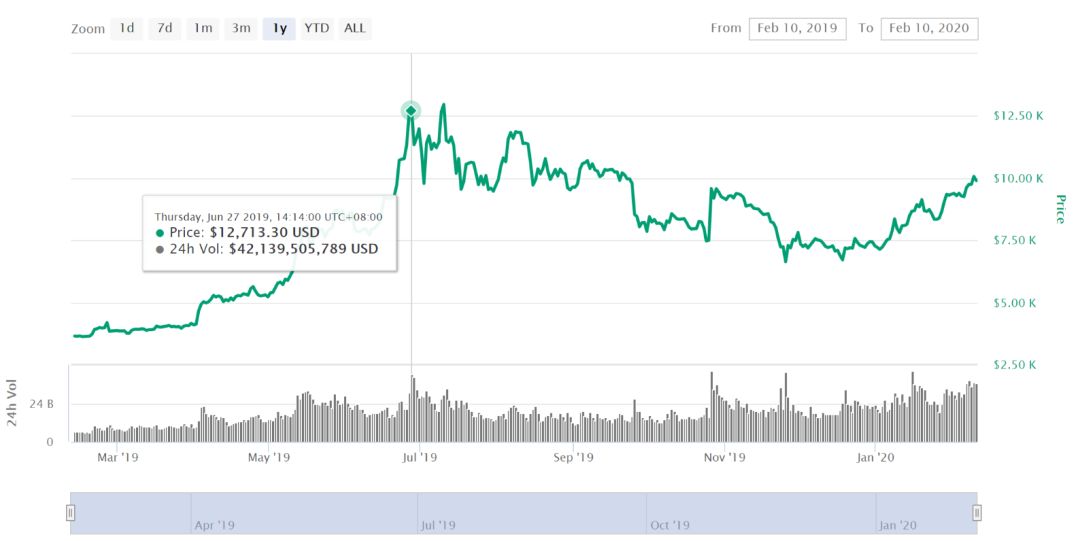
For example, when the BTC price approached the annual high of US $ 12,713 on June 26, 2019, the NVT index reached 113, indicating that the market has entered a stage of excessively rapid valuation. Since then, the market has undergone a repair process, and prices and NVTs have gradually Going down to 57.
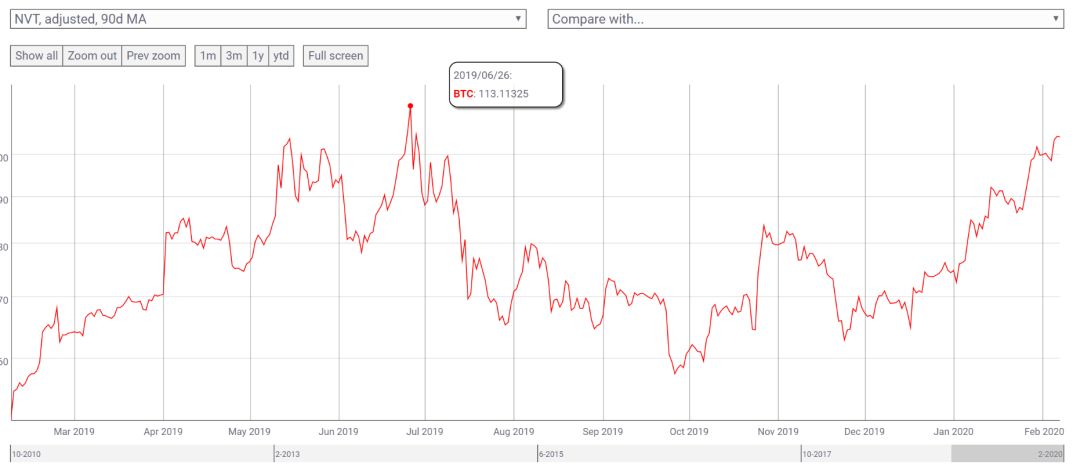
As of today, the indicator of NVT shows 104, which is also a recent high point. The market is in a state of "overbought", which is a bit overheated and may be pulled back later.

MVRV Ratio
In 2018, Nic Carter of Castle Island Ventures, who is also the founder of Coinmetrics, worked with Blockchain.info's Antoine Le Calvez to propose the MVRV indicator:
Market Value is the value of the exchange price and the number of coins in circulation, which is the market value in circulation.
Realized Value (Realized Value), calculate the total value of circulating coins based on the market price at the time of the last UTXO transaction to summarize the moves.
MVRV = MV / RV . When the value is low, it generally indicates that the market participants make little or no profit. The high value of MVRV generally indicates that the asset holders are profitable. On June 26, 2019, the MVRV value of BTC reached 2.57, after which it entered a descending channel. Until December 17, 2019, the MVRV value dropped to 1.18, and then began a slow recovery.
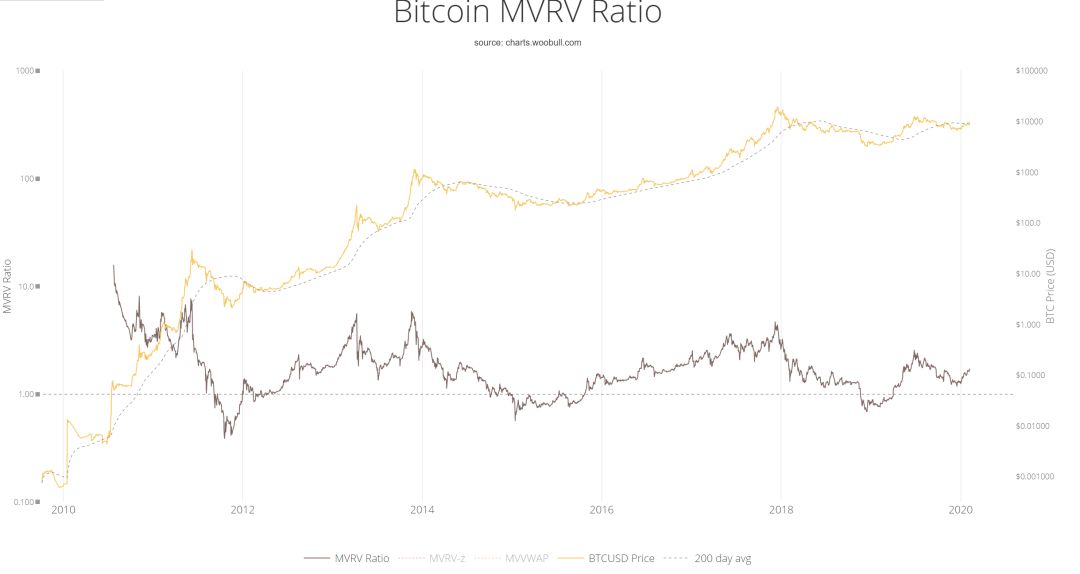
Generally speaking, BTC's MVRV value is lower than 1.5 means lower valuation, and higher than 3.5 means higher valuation. Historically, the MVRV value of BTC has been lower than 1 three times, which also means the historical bottom, which are respectively at the end of 2011, early 2015, and early 2019. After these three historical bottoms, BTC has started a rising cycle.
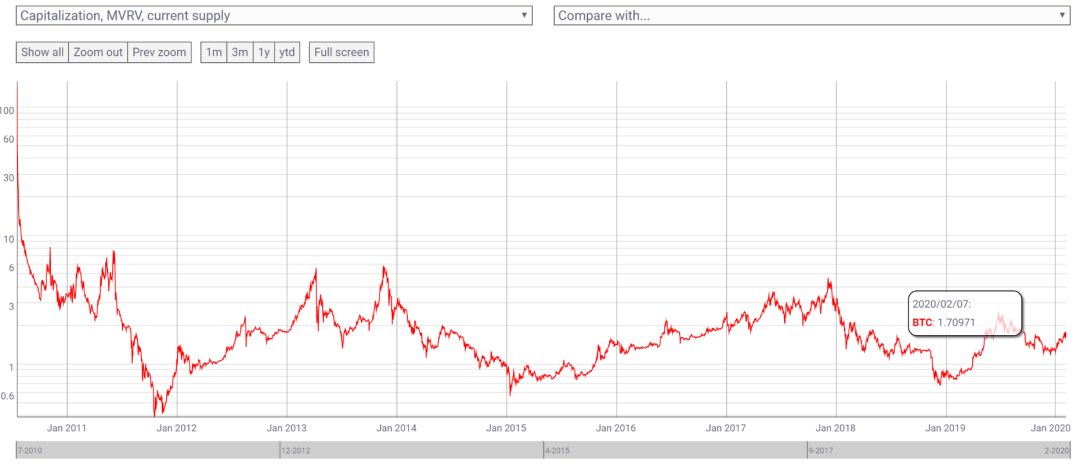
At present, the MVRV value of BTC is at a median of 1.71. In the long term, there is still room for growth in the market outlook.

Mayer Multilier
Mayer Multiplier (Mayer multiples) was created by the well-known investor and podcast host Trace Mayer. Mayer multiples are defined as " multiples of the current BTC price over a 200-day moving average." Equivalently gives a ratio relative to time and past transaction prices.
Mayer multiples = BTC market price / 200-day market value.
When using Mayer multiples, there are two key specific values that are 1 and 2.4.
The meaning of a multiple of 1 is simple: any value above 1 means that the price of BTC has risen to the lowest level for 200 days, and any value below 1 means that the price has fallen to the lowest level.
Secondly, in history, any multiple that is higher than the threshold of 2.4 indicates the beginning of a speculative bubble: for example, when BTC reached its highest point in historical price in December 2017, the Mayer multiple also reached an abnormally high 3.65. When the annual high was reached, the Mayer multiple also reached 2.48. Through simulation based on historical data, Mayer concluded that when the Mayer multiple is less than 2.4, the best long-term investment income can be obtained by hoarding BTC.
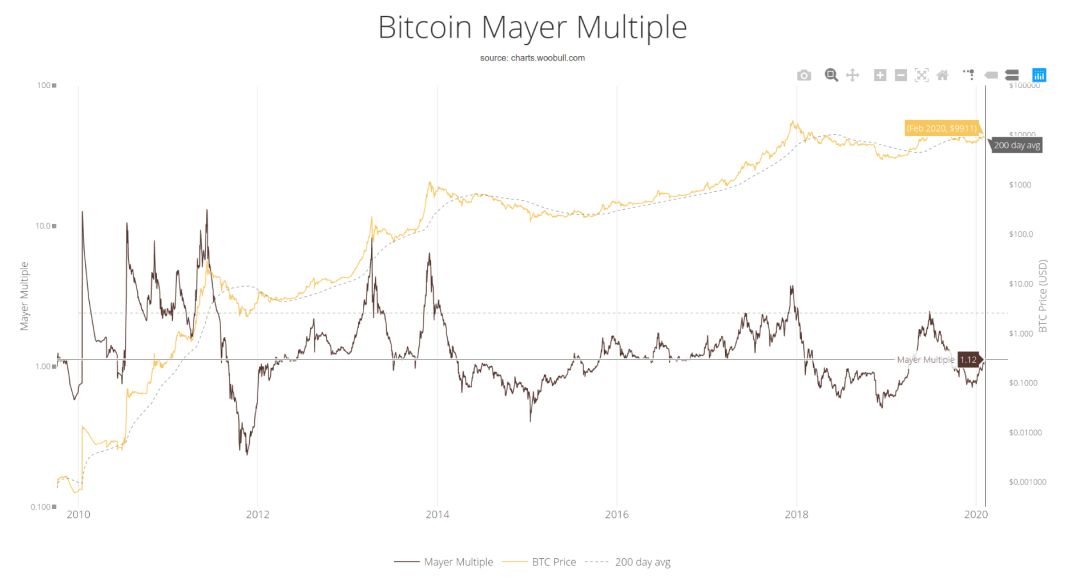
At present, the Mayer multiple is 1.12. In the long run, it is still in a relatively healthy rising channel.

BTC Difficulty Ribbon
The Bitcoin Difficulty Ribbon refers to the mining difficulty zone index of the BTC network. It was first proposed by Vinny Lingham. Vinny is also the founder of the Civic project. In April 2014, he published an article on "Finding Equilibrium: Searching for the true value of a Bitcoin article, detailing this theory:
The difficulty zone consists of a simple moving average of the BTC network difficulty, showing the impact of miner selling pressure on the BTC price trend. Generally, as new coins are mined, miners sell a portion of the mined coins to pay for production costs such as electricity bills. This behavior will cause downward pressure on prices. In order to maintain the operation of the mining machine, the worst miners have to sell more tokens. When selling out all the tokens is still not enough to cover the mining costs, most miners are already shut down, and the hashing power and network difficulty will be reduced (the difficulty band will be reduced). When the climbing slope of the entire network difficulty zone decreases and overlaps, only strong miners can continue to mine. These powerful miners only need to sell a small percentage of BTC to maintain operations, which will reduce the BTC selling pressure on the market and provide more room for price increases.
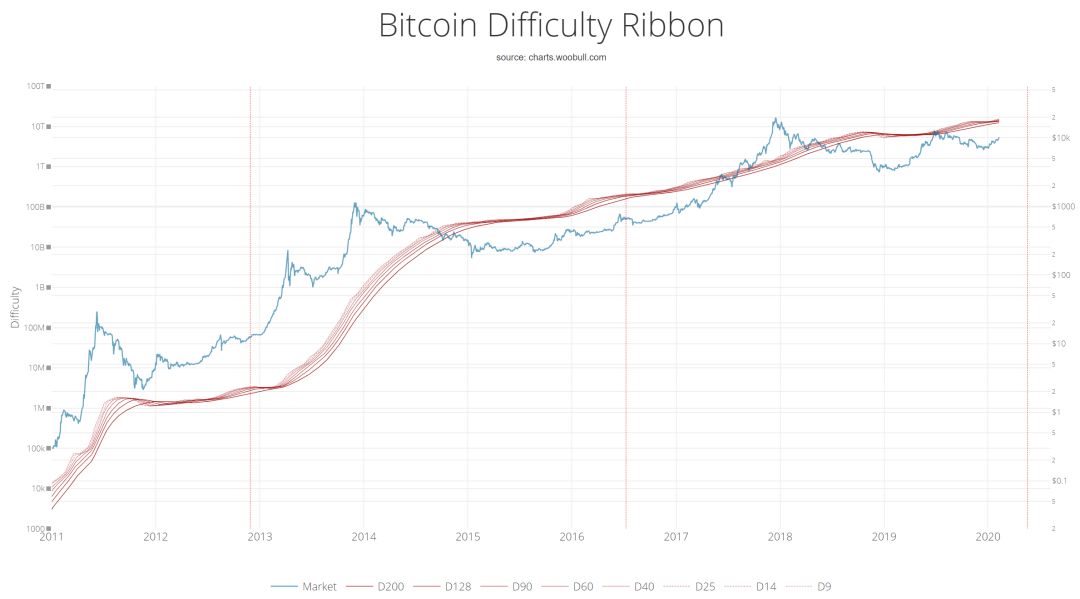
According to the index, areas where the mining difficulty zone shrinks or even overlaps will be the best time for BTC to open positions. In the event of a mining disaster, most miners have stopped and the time has entered the end of the mining disaster / bear market. Bottom rebound. From 2019 to the present, the mining difficulty zone has been negative, or it implies that it is more appropriate to store coins and enter.

Fear & Greed Index
The BTC market is an emotional market. When the market goes up, people tend to be greedy, which leads to FOMO (Fear of Missing). At the same time, when the market fell sharply, people began to become frightened again and continued to cause sell-offs. The fear & greed index range is 0-100. 0 means "extremely horrified" and 100 means "extremely greedy".
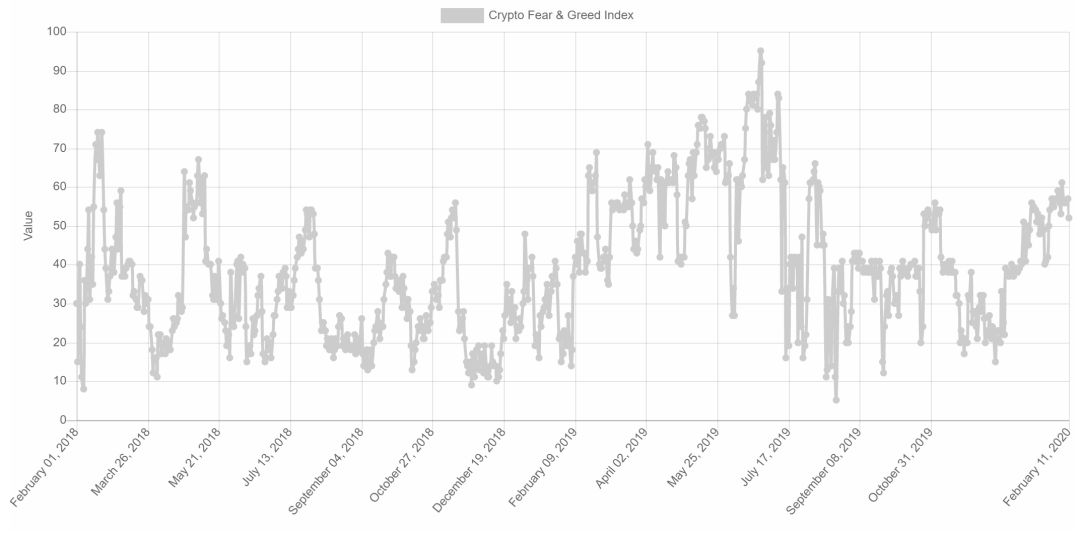
0-30 , extreme fear-fear may indicate that investors are too worried, but it may also be a better investment opportunity.
70-100 , when the investor becomes too greedy, it means that the investor is already FOMO, and the market is crazy, but this may enter the time of adjustment, and the investor can consider leaving the market temporarily. For example, on June 26, 2019, this index reached a stage high of 94. Then we saw the market start to downgrade.
According to this index, we can not give an opinion on the price point of BTC, but it can help us measure the basic sentiment of the market for BTC. At present, the index is 52. The market has picked up, but it is not crazy yet.

Halving Effect
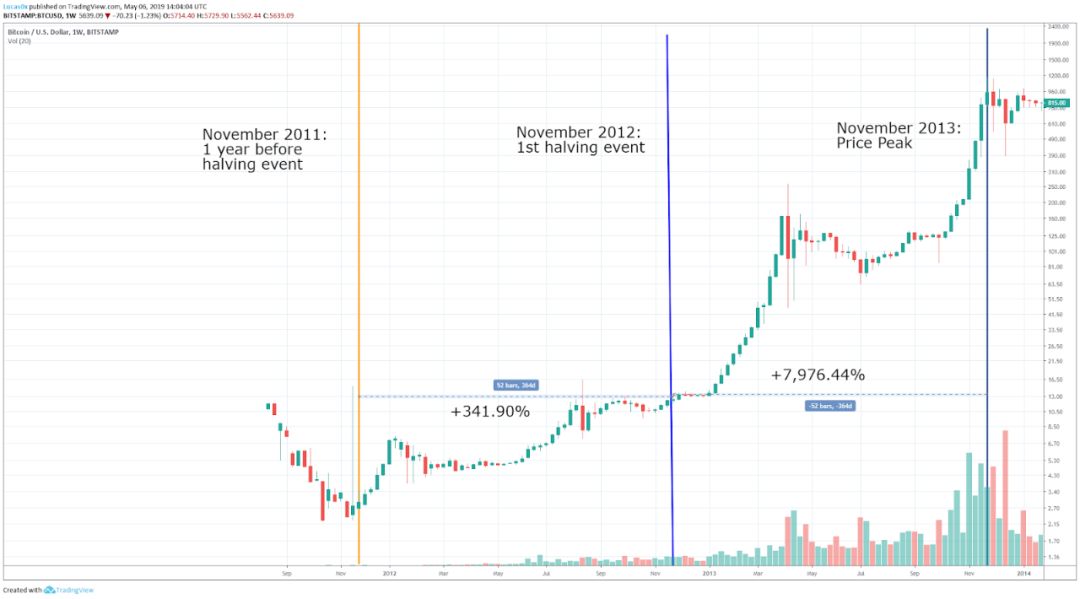
After reviewing these fundamental quantitative indicators, we still need to unveil the biggest suspense of BTC in 2020-the third halving every four years, we can review the price trend of the first two halving times (halving the halving) effect).
The first halving occurred in November 2012, and the daily production of BTC decreased from about 7,200 BTC per day to about 3,600 BTC per day. BTC achieved a 341.9% increase before halving, and a 7,976.44% increase after halving, and reached a peak of about $ 1,000 in late November 2013.
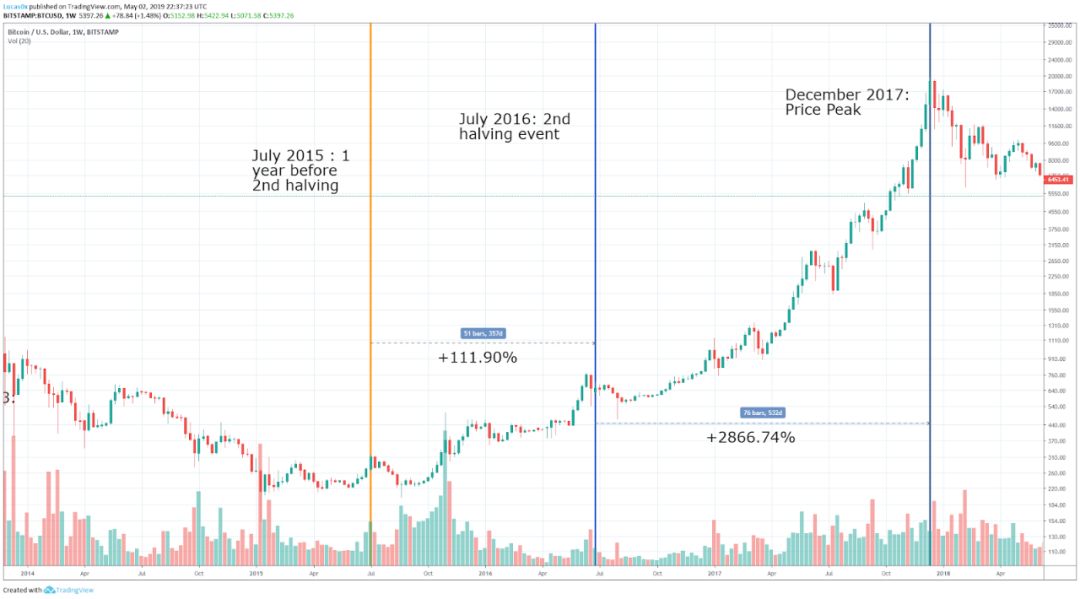
The second halving occurred in July 2016, reducing the daily production of BTC from approximately 3600 BTC to the current approximately 1800 BTC per day. Before halving, BTC gained an increase of 111.9% , and after halving, it gained a gain of 2866.74% , and in December 2017, it closed at an all-time high of nearly 20,000 US dollars.
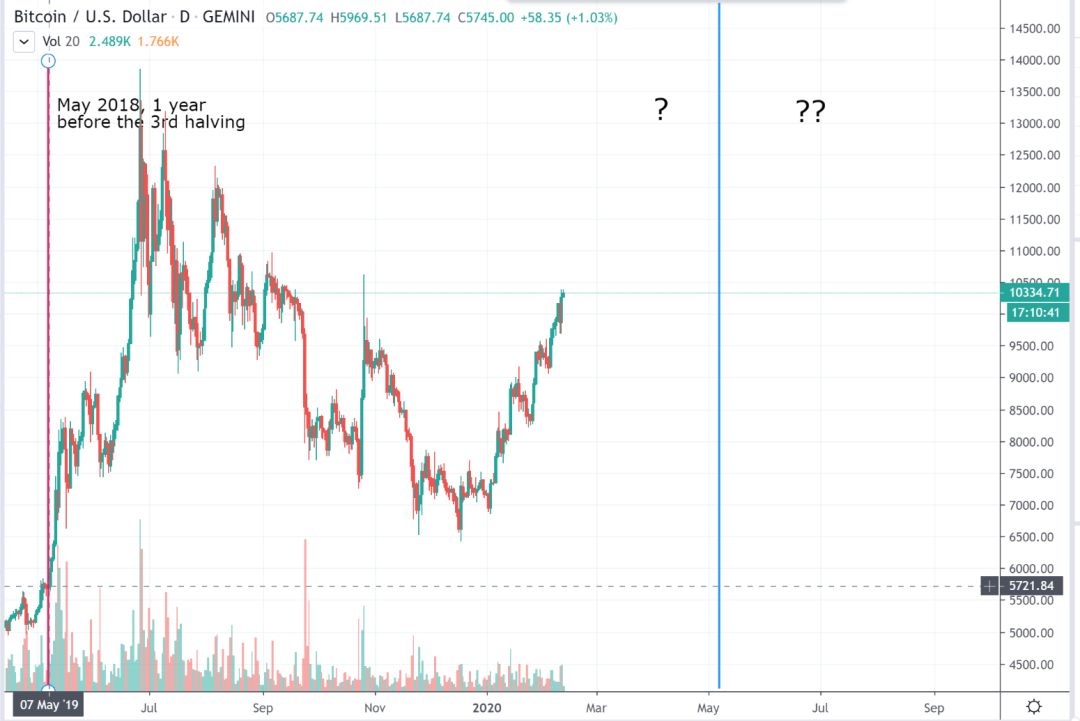
The third halving is expected to occur around May 7, 2020, and the daily output of BTC will be halved again to 900. As of today, starting from May 2019 before the halving, BTC has harvested an 80.63% increase. How much increase can BTC gain from two and a half months before the halving? How much gain can I expect after halving? We cannot predict accurately, but it is clear that from the current trend, the halving effect of the first two halves is still evident in this halving event.
Conclusion
We noticed that after several rounds of bull and bear cycles, BTC's trading applications and users are booming, and BTC as an emerging alternative asset class is increasingly reflecting its value attributes. This article has selected seven ratios or indicators in the core framework of BTC's fundamental analysis. The first two ratios, Sharpe ratio and S2F index, are mainly used to evaluate the overall assets of BTC, and they tend to make more long-term value investment decisions. The next five indicators (NVT, MVRV, Mayer multiples, Difficulty Ribbon, Fear & Greed Index) focus more on dynamic and short-to-medium-term investment direction decisions. Finally, we also considered the price trend of BTC in each halving of output and the future The three halvings may indicate something.
As of the writing of this article, the BTC price has risen strongly through several key resistance levels and has steadily crossed the $ 10,000 round mark, which indicates the end of a winter and the start of a new bull market cycle. In this continuous cycle, it is important to use relevant indicators based on fundamental analysis as the most sensitive indicators of cycle time, which can help us make more informed investment decisions.
We will continue to update Blocking; if you have any questions or suggestions, please contact us!
Was this article helpful?
93 out of 132 found this helpful
Related articles
- Views | Gao Bin, China Communications Industry Association: After the epidemic, blockchain enables business
- Opinion | Defi's most noteworthy in 2020, Bitcoin price may reach $ 20,000
- Cryptocurrency narrative notes: what are the interesting slogans of the crypto community?
- Continue to streamline the structure and Circle sells two more business lines. Can his stablecoin dream come true?
- French central bank: ECB digital currency issuance depends on two key options
- 11 years later, Bitcoin is still hard to use
- Perspective | Zhao Wei, Tsinghua Internet Industry Research Institute: Construction of a New Blockchain Commercial Organization under the Impact of the Epidemic


