How does the hedge fund in the crypto asset industry work?
Overview of investment in encrypted assets
Encrypted asset investments have unique investment opportunities characterized by highly volatile trading markets and volatility in value. However, these violent price volatility provide an excellent opportunity for savvy investors to identify key drivers in the crypto market and how to translate these regular metrics into profitable investment decisions. Last year, bitcoin prices lost 72%, and the basic group and man-made trading strategy hedge funds also suffered bleak losses. In contrast, the quantitative trading strategy in the bear market hedge funds through the technical analysis of long and short positions to trade but got an average return of 8%. Quantitative trading funds use the analysis of key rule indicators in the encryption market as investment decision information to implement various strategies.
Comparison of crypto-asset market and stock market
Because the crypto-asset market is completely different from the traditional stock market underlying assets, its manifestations are different. Stocks represent a part of the company that reflects the company's assets, revenues, and business models. They can also be used for intrinsic valuation using methods such as discounted cash flow analysis.
Encrypted assets have no fixed or tangible value, so it is difficult to determine their value. Since they have no real value, the market is currently difficult to generalize, so the crypto-asset market is much smaller than the stock market (Figure 1), which makes it more vulnerable to price volatility.
Many institutional investors avoid investing in crypto assets because of high price volatility, so the encryption market is dominated by many novice investors and encryption enthusiasts.
- Babbitt Depth | Above 5G, cloud games will become mainstream, blockchain is indispensable
- Li Lihui, former president of Bank of China: China should master the dominance of new technologies in the digital currency field
- Bitcoin fluctuates within a narrow range, waiting patiently for the market to restart
The encryption market does not have tangible intrinsic value, and its impact is currently mainly affected by emotions and emotions. Therefore, the quantitative strategy technique for implementing investment is more effective than fundamental analysis because it considers the trend of influential market sentiment and investment decisions.
Figure 1.
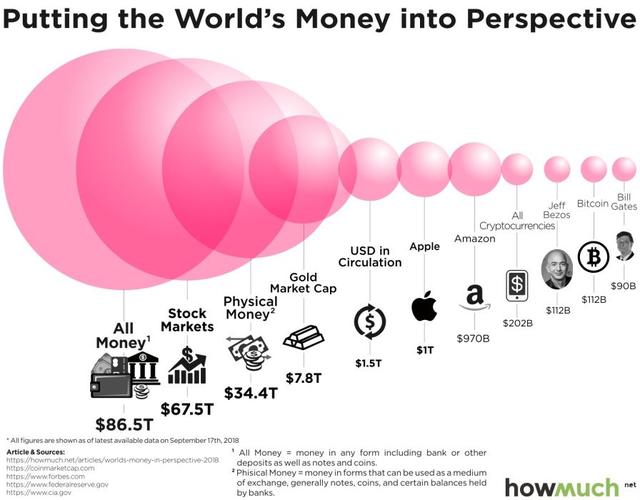
-HowMuch.net
Important quantitative analysis terminology
Before using a quantitative strategy, investors must be familiar with key indicators that predict future changes in the price of crypto assets. These technical analysis indicators are similar to the stock market, but they must conform to the encryption market.
- The moving average is the average price of a certain number of days in the past, calculated as the sum of all prices for a particular period divided by the number of days in that period, or
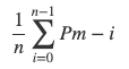
- Where n is the number of days and Pm is the price of the day. Moving averages help to clearly reflect a range of fluctuations and determine trends, with larger values of n reacting less to fluctuations in cryptographic assets, and smaller values of n will respond more.
- Stop Loss is a mechanism to protect investors from the market downturn by automatically selling encrypted assets when they reach a specific price. Many investors will choose a stop loss based on the percentage of the set purchase price. For example, an investor who purchases a $100 crypto asset can set a 5% stop loss and automatically sell if the value falls to $95. Short-term investors will choose a smaller percentage, while long-term investors are more tolerant of market declines. In addition, other investors using more sophisticated strategies may base their stop loss on market-based lows.
- The Japanese candlestick chart usually depicts each trading day as a candlestick. The body of the candle represents the opening and closing price, and the wick of the candle represents the high and low points of the day (Figure 2). On the day the price closes above the opening price, the candle is usually green, while at the time of the loss (the price opens above the closing price), the candle will be red. Quantitative traders perform trades based on trends in candlestick charts , such as continuous specific patterns or a certain number of green candles.
Figure 2.
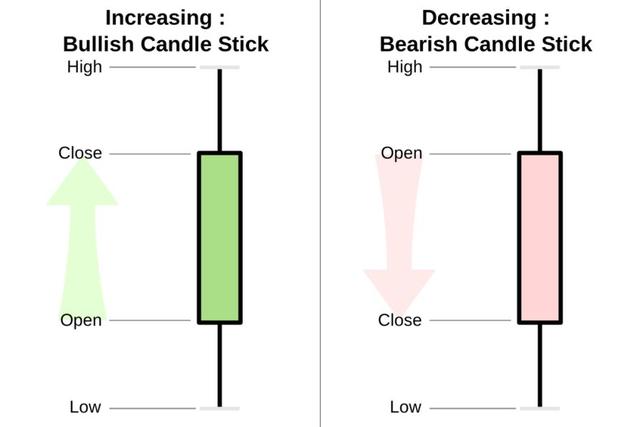
-BitcoinChaser
Quantitative Trading Strategy: Moving Average Crossing Strategy
The moving average crossing strategy is designed to identify the momentum of certain price movements by crossing fast and slow moving averages. The time range of the fast average is shorter (21 days in Figure 3), and the slow average draws a longer time range (55 days in Figure 3). When the fast average exceeds the slow average, it indicates that the market may rebound, leading to a buy decision . Conversely, when the fast average is below the slow average, the market is likely to fall, and investors should sell or sell shorts. It is worth noting that since the moving average crossing strategy depends on the trailing average, it is often a lagging indicator. But for now, it's still a valuable strategy, especially when used with other analytics.
Figure 3.
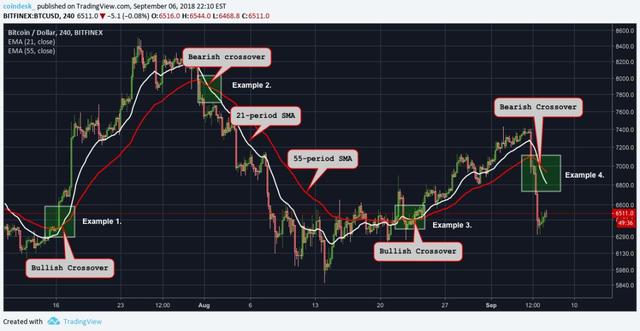
-CoinDesk
Quantitative trading strategy: 2 standard deviation strategy
2 The standard deviation strategy is to create a profitable trading strategy with the help of statistical concepts. 96% of the data points are between plus and minus two standard deviations, so the value shows that the probability of a true deviation below the mean within the range is less than 2%. Although cryptographic assets are not fully suitable for Gaussian distribution, if they are below the standard deviation threshold, they are likely to rebound to the average. Therefore, for many quantitative traders, buying and holding a price regression average below the standard deviation threshold has proven to be a successful strategy.
Quantitative Trading Strategies: Relative Strength Index (RSI) Analysis
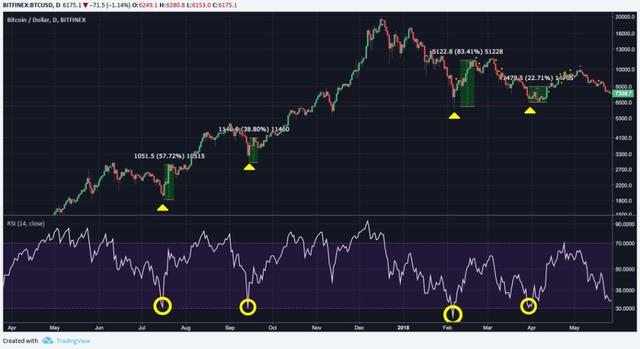
The Relative Strength Index (RSI) is an analytical indicator that identifies the position of an asset's price relative to its "true" value by assigning it a value of 0-100, where 50 is the true value. Therefore, when the RSI falls below 30, the assets are considered to be undervalued, and when the RSI rises above 70, the assets are overbought. When the RSI falls to a low level, traders can use this analysis to purchase undervalued crypto assets for price rebound (see Figure 4). When the RSI is at a higher level, the opposite is taken, and investors can short-sell the crypto assets to make a profit when the price falls.
A comparative analysis of RSI and price can help us to speculate more deeply on the future trends of cryptographic assets. When the RSI line moves to a relatively high low and the price is at a relatively low low, then the price is likely to be bullish. This is a very strong signal of price increases. Conversely, when the RSI line moves to a relatively low high point and the price is relatively high, there is a bearish divergence. This indicates that the price has reached a local peak and will likely decline in the near future.
In this regard, investors can analyze the RSI to understand the overbought/oversold situation of the encryption market and better predict the future trend of the encryption price.
Figure 4.
-CoinDesk
in conclusion
In today's emotionally driven encryption market, technical analysis of the indicators of the encryption market can provide investors with a more sensible investment decision. And those who are willing to rely on quantitative trading techniques are also getting good returns while predicting the market process. At present, although there is no single strategy to predict the market 100% effectively, multiple analysis methods combined with quantitative technical analysis will greatly enhance investors' chances of success in the encryption market.
Sources
- Forbes “ How is Trading Crypto Different From Stocks ”
- BitcoinChaser “ Bitcoin Charts and How to Read Them ”
- CoinDesk “ The Moving Average Crossover ”, “ Timing the Crypto Market with RSI ”
- Hackernoon “ Cracking Algo Trading ”
We will continue to update Blocking; if you have any questions or suggestions, please contact us!
Was this article helpful?
93 out of 132 found this helpful
Related articles
- Quote analysis: the shock market is nearing the end, waiting for more hair
- Dragon White: Libra is a skyscraper built on the beach
- Chinese Culture News: The “Testing Water” Blockchain in the Copyright Industry
- Bitcoin market analysis: shorts are coming again, shocks still exist
- Ethereum Fellow: ETH circulation may be reduced by 10 times in 2021.
- BTC premium of $1,000? Here is a detailed explanation of the South African cryptocurrency market.
- Nasdaq, one of the world's largest stock markets, article: "New Challenges, New Solutions – The Rise of Smart Cities"