Market Analysis Report: Bitcoin fell under pressure, halving the bull market gradually drifting away?

Previous review
BTC: BTC has a pressure drop, and the pressure is at the level of $8,300. There is a certain rebound demand in the short term. The BTC rebounded to a maximum of around $8,350 and is now under pressure again.
ETH: ETH If you can't regain the $180 line in the short term, you will look down again for the support zone. ETH failed to stand on $180 and is currently in the process of continuing to decline.
TRX: TRX's support line is around $0.015 and is currently consolidating around the neckline. If there is no significant increase in volume, the downside will open. The TRX volume fell below $0.015 and the downtrend channel opened.
- 5% of Bitcoin can double the value of the portfolio, hash cash founder Adam Back and then flag for Bitcoin
- EOS governance leads disputes, community denounces founding team
- These six points are the fundamental problems for the cryptocurrency market to be solved.
Highlights of this issue
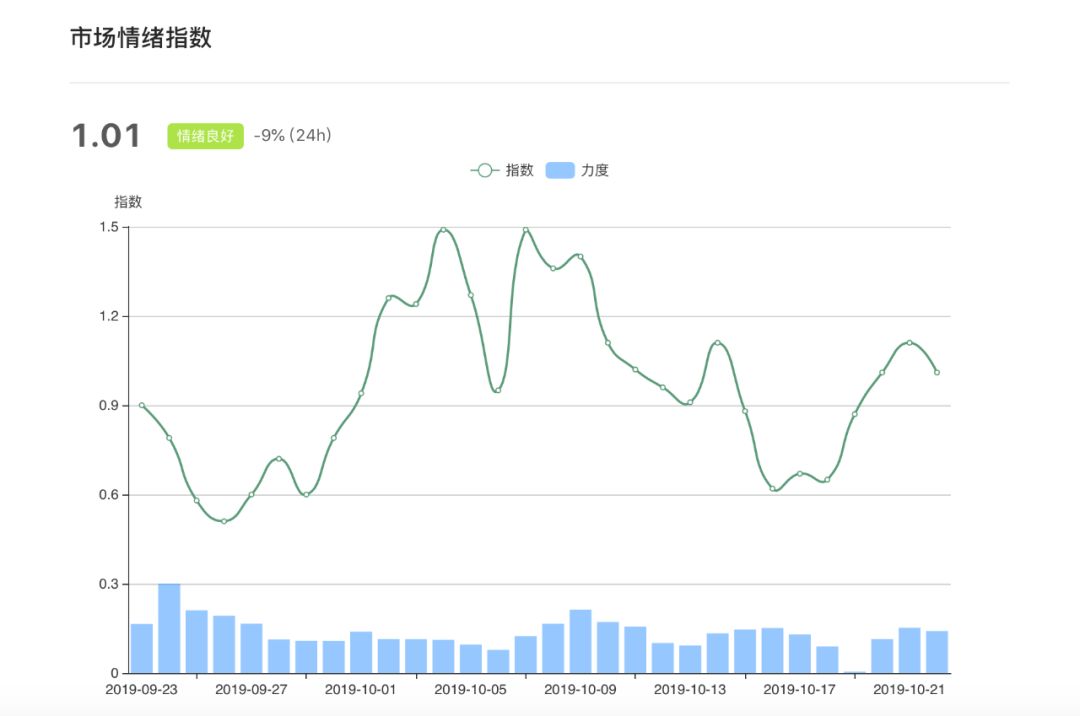
Summary: According to the standard consensus sentiment index, the current market sentiment is stable, the latest index is 1.01, the market enters the stage of decline, the short-term rebound has no significant amount of growth, and the market is not willing to do more.
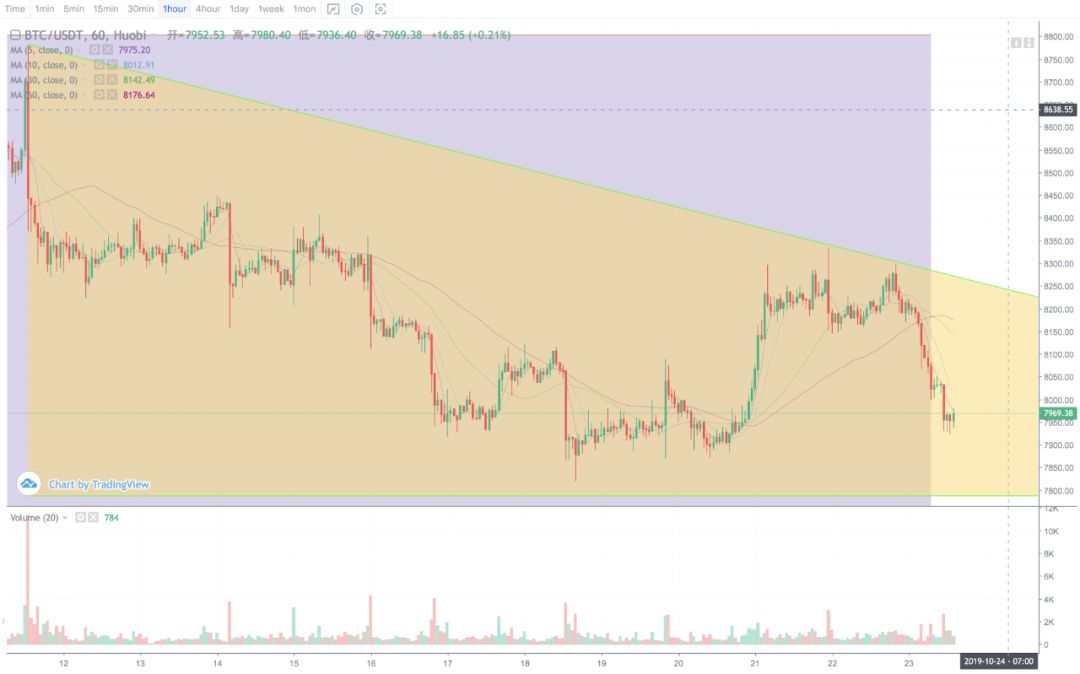
BTC: The pressure level remains at $8,300, and the pressure is falling. The support range is around $7,700, but if it is tested again, it will greatly increase the probability of break.
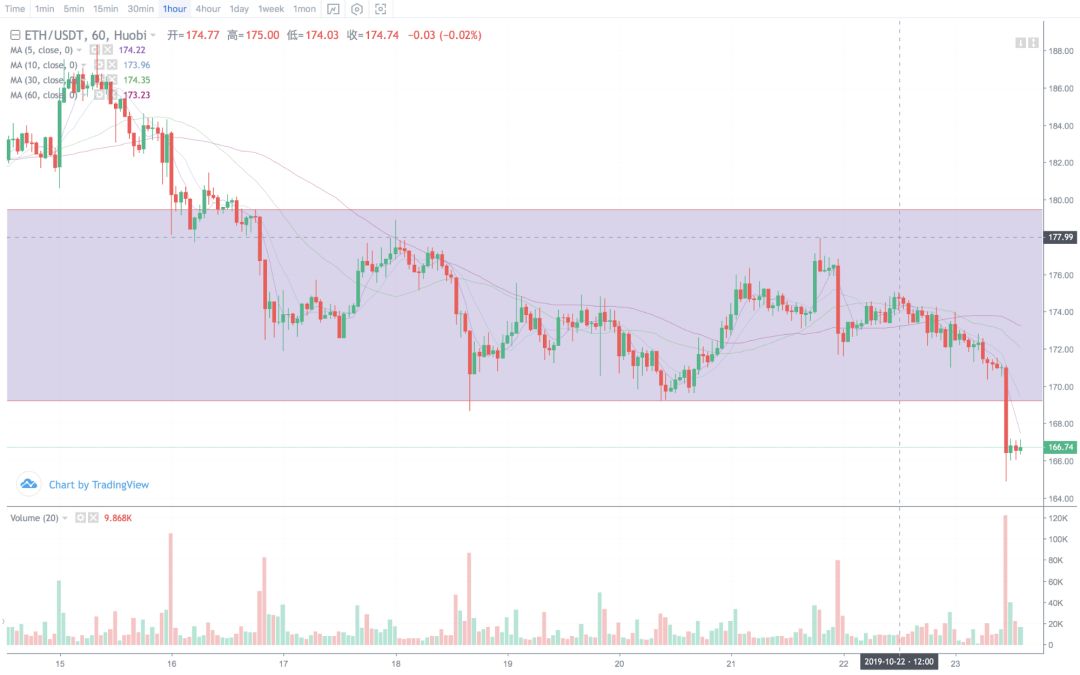
ETH: ETH has a certain demand to test the pressure of $170. After the test, it will continue to fall. ETH is mainly short.
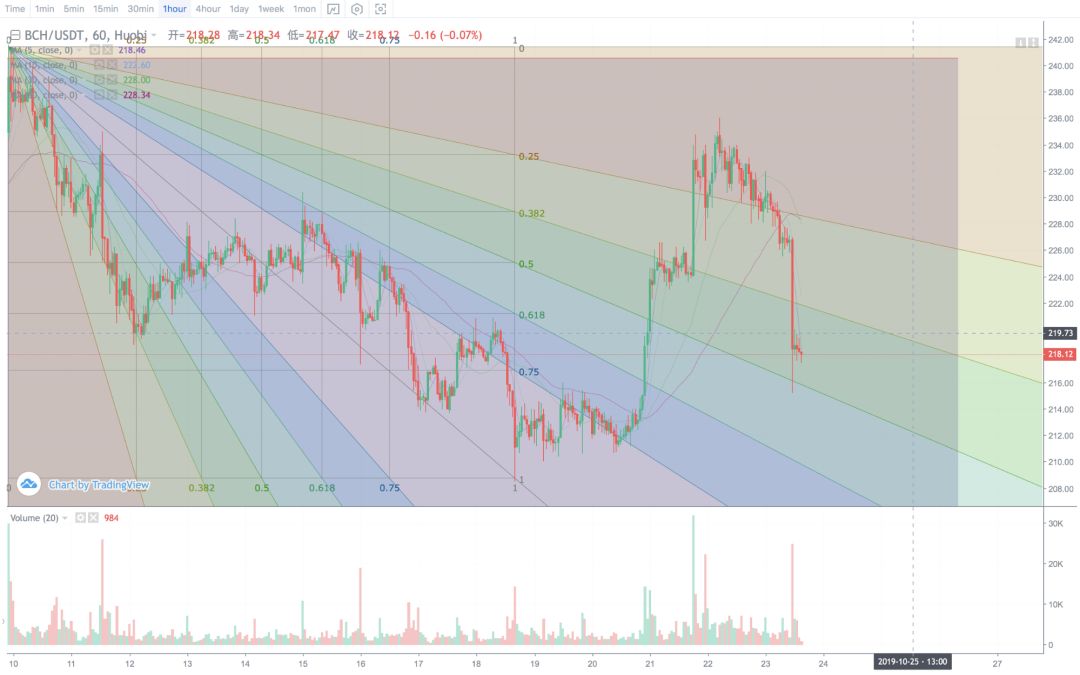
BCH: The BCH support range is at $210. If the volume falls below, it will open the downside.
Trading skills
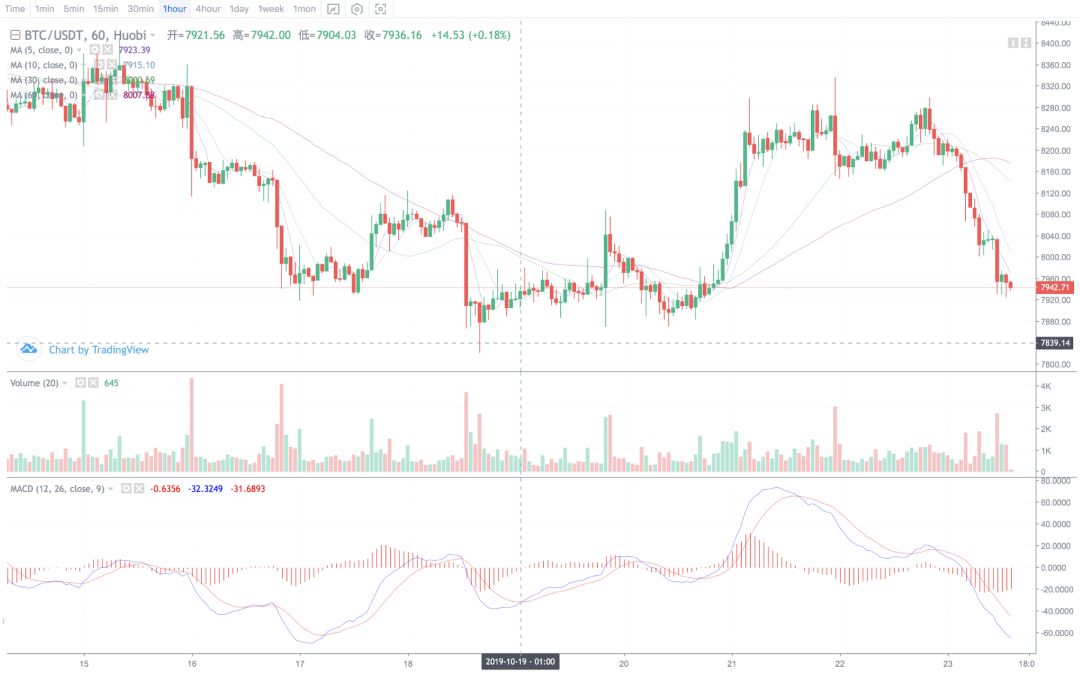
MACD bottom divergence: the bottom divergence generally appears in the low zone of the price. When the price trend on the K-line chart is still falling, the trend of the graph composed of the green column on the MACD indicator chart is that the bottom is smaller than the bottom, that is, when the low point of the price is lower than the previous low, and the indicator The low point is higher than the previous low, which is called the bottom deviation phenomenon. The bottom divergence is generally a signal that the price may reverse upwards at a low level, indicating that it may rebound upwards in the short term and is a short-term buy signal.
Take the BTC hourly line trend from October 16 to 18 as an example. At 14 o'clock on October 18, the BTC price fell below the previous low, but the MACD's bottomed off phenomenon, and once again fell, the volume was not heavy. At this point, the bottom deviation is basically confirmed. If you buy the trade at the 1st closing price of $19,940 on the 19th, the maximum profit can exceed 5%.
The MACD bottom deviation trend confirms the conditions are simple, the success rate is high, but the frequency of occurrence is low, need to wait patiently, and also need to constantly change the stop-loss stop-loss target, it is difficult to control in the direction of continuous space.
Current report
As of the publication of the report (October 23, 2019), the total market value of global digital currency assets on Wednesday was US$216.611 billion, down by US$5.928 billion year-on-year, down 2.67%. The 24-hour market turnover was US$59.921 billion, up US$4.467 billion year-on-year, up 8.06%. After the market's overall market value rose in an infinite amount, it stepped back again, and the daily decline was large. The short-term rebound demand was basically released and will continue to enter the downtrend channel .

Source: Standard Consensus, CoinMarketCap
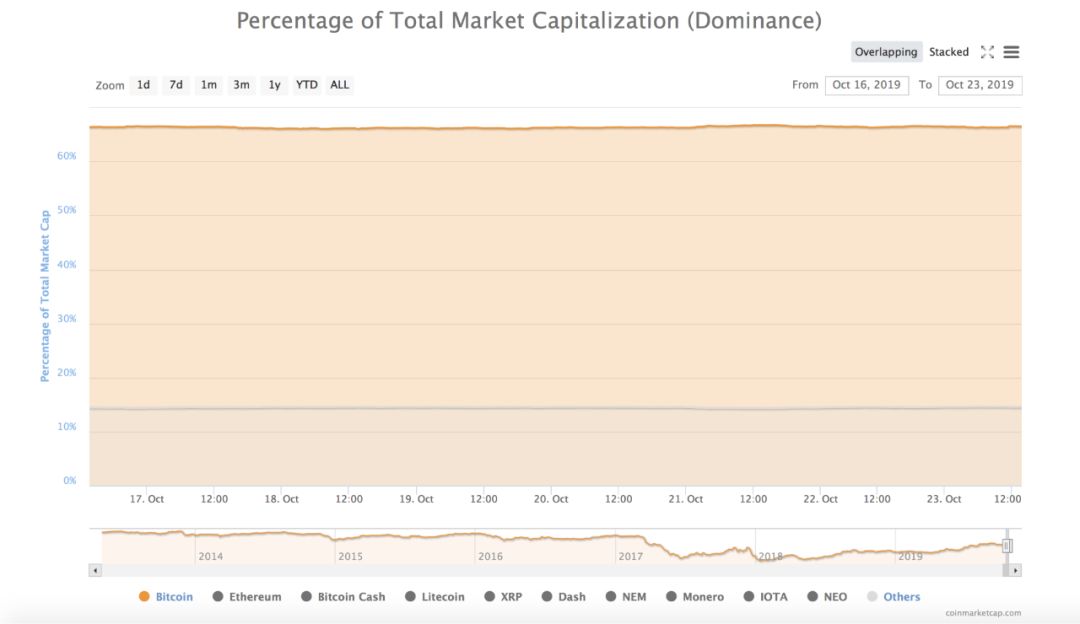
According to the standard consensus sentiment index, the current market sentiment is stable, the latest index is 1.01, the market enters the stage of decline, the short-term rebound has no significant amount of growth, and the market is not willing to do more. At the same time, according to the ratio of bitcoin to total market capitalization, the market value of bitcoin has not changed significantly, up 0.12% year-on-year, and the market value of bitcoin has been less than 70%, but still more than 65% in market control; and other currency market value The proportion did not change significantly, only up 0.13% year-on-year. BTC is still in the dominance of the market, and the rise and fall of BTC will continue to affect the market trend, and the market enters the downtrend channel.
Source: Standard Consensus, CoinMarketCap
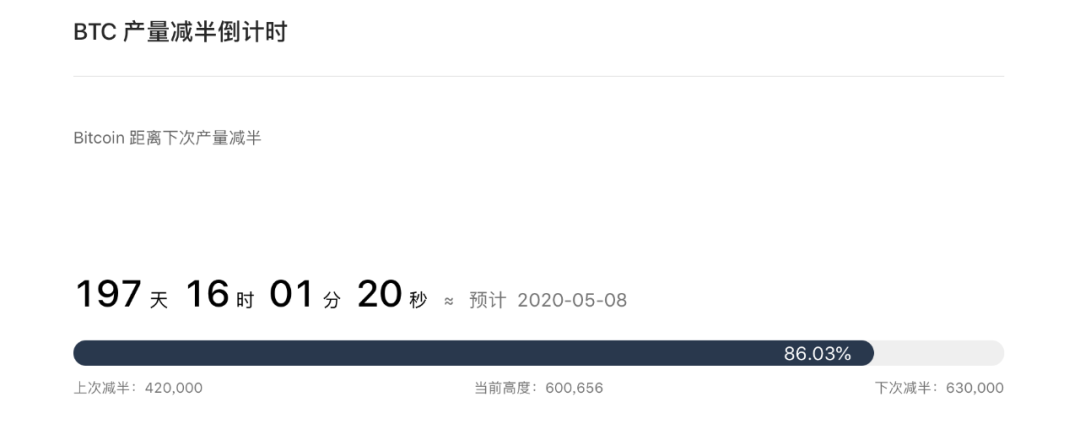
According to the standard consensus halving countdown index, BTC currently has a block height of 600,656, which is still 197 days from the next halving. It will take some time for BTC to achieve a halving of expectations. However, investors should pay attention to the halving of BTC. When the next halving approach, BTC prices will once again enter a fast-rising cycle. However, the efficiency of mining has declined recently, and the miners’ willingness to mine is reduced.
Review and analysis of the trend of BTC, ETH and BCH
According to CoinMarketCap data, BTC's average daily turnover rate was 10.59% on the 7th, which was 1.18% higher than the average daily turnover rate in three months, and 0.31% lower than the average daily turnover rate in the previous week. The BTC went out of a small rebound last week, but did not have a good amount of cooperation and failed to break the $8,300 pressure level. And BTC has a rapid up and down shock in a short period of time, and it is not obvious in terms of spot, but it has generated a lot of explosions in high leverage contracts. The pressure level remained at the $8,300 line, and the pressure fell, with the support range around $7,700, but if it was tested again, it would greatly increase the probability of break.
According to CoinMarketCap data, ETH's average daily turnover rate was 37.13% on the 7th, which was 3.11% higher than the average daily turnover rate in three months, and 2.59% lower than the average daily turnover rate in the previous week. ETH once again fell below the $170 volatility range and opened the downside. ETH has a certain need to test the pressure of $170. After the trial, it will continue to fall. ETH is mainly short-selling.
According to CoinMarketCap data, BCH's average daily turnover rate was 34.16% on the 7th, which was 5.27% higher than the average daily turnover rate in three months, and 1.64% lower than the average daily turnover rate in the previous week. BCH rebounded stronger than other mainstream currencies, rebounding from low to high, and rebounding more than 10%, but then BCH fell again. The BCH support range is at $210, and if the volume falls below, it will open the downside.
We will continue to update Blocking; if you have any questions or suggestions, please contact us!
Was this article helpful?
93 out of 132 found this helpful
Related articles
- Member of Parliament: For innovations such as Bitcoin, the United States should give "yes" by default.
- Mortgage digital currency lending, this DeFi model, can really revolutionize the life of traditional finance?
- Opinion: Why is IBM's blockchain not a true blockchain?
- What is the relationship between cutting and Libra? Da Yurui’s testimony of Zuckerberg’s hearing
- Conflux founder Long Fan confirmed attending the World Blockchain Conference · Wuzhen, he said to build a world computer beyond Ethereum
- Bloomberg: Bitcoin derivatives trading surged into speculators largest casino
- Jimmy Song: Bitcoin doesn't need marketing, too many experts are pushing for scams.


