Perspectives | Bitcoin is not dead, the cycle is immortal
In the early morning of the 4th, the US Federal Reserve cut interest rates by 50 basis points in the early morning.
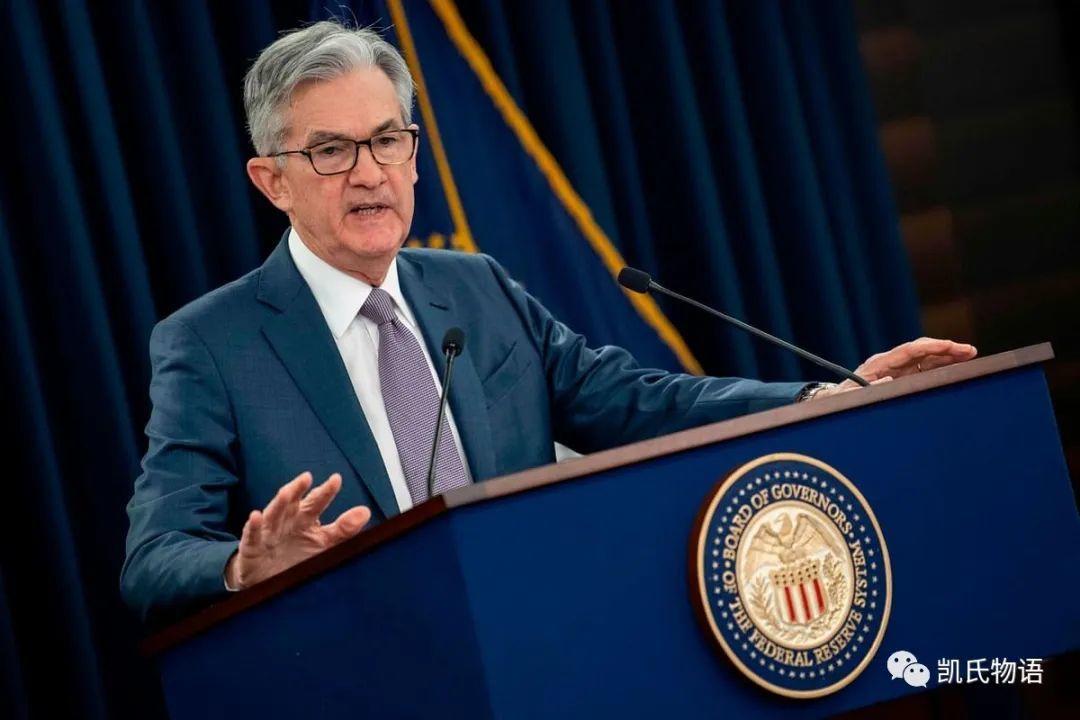
Powell said the rate cuts were designed to help the US economy remain strong during the crisis. And the appearance of Trump in a timely manner, further pressure on the Fed, requiring the Fed must be more accommodative, rather than squeeze a little bit like now.
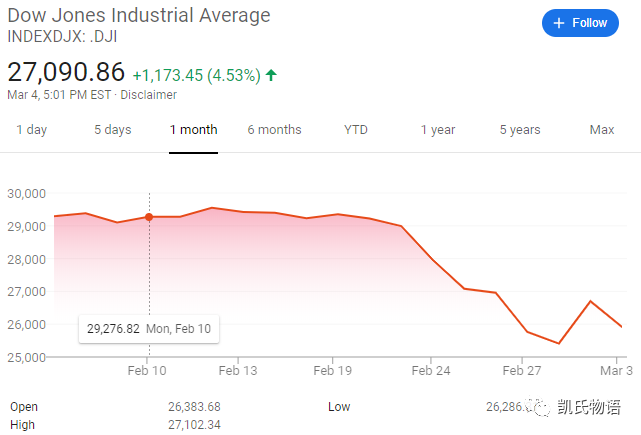
The market's response was very strange. Obviously, it was good news. The central bank released water. The water must have flowed into the stock market. In theory, the US stock market should skyrocket. However, in fact, the entire market ’s interpretation of the Fed in early March had already expected a rate cut of 100%, but this rate cut expectation appeared earlier than everyone expected, that is, March 3. The direct response of the US stocks was to rise by 1.24%, then plunge by 3.74%, and finally close at 2.94%.
The market has already prioritized this interest before the interest rate cut, which is already reflected in the market price.
- Wall Street capital forces palace, Silicon Valley elite trust crisis and crypto sweetness
- Perspective | Digital assets will establish a new order for the private equity market, which will become the standard investment market
- ProgPoW algorithm is leaked, Ethereum ASIC mining is unstoppable?
So on the 4th overnight, everyone saw the long, short and double explosion of all investment markets around the world, including Bitcoin. To put it in the simplest and straightforward words, it is good for cashing into shorts. But one thing is more certain, and that is to start a new round of global interest rate cuts.
The Bank of Canada is expected to cut interest rates by 50 basis points overnight instead of the 25 basis points previously expected. The European Central Bank and the Bank of Japan President issued an emergency statement. Almost synchronously, it said it would take the necessary actions to stabilize the market that was severely shaken by the new crown pneumonia epidemic. The RBA 3 has taken the lead in cutting interest rates by 25 basis points, reducing the benchmark interest rate to a historically low level of 0.5%. The Bank of Malaysia lowered its benchmark interest rate to its lowest level since 2010 in an effort to boost economic growth after the country's economic growth fell to its lowest level in 10 years.
In fact, the "unconventional" meeting of the Federal Reserve on the 3rd has cut interest rates for the ninth time since 1998. Previously: 25 points in October 1998; 50 points in January 2001; 50 points in April 2001 In September 2001, the interest rate was reduced by 50 points; in August 2007, the discount rate was reduced by 50 points; in January 2008, the interest rate was reduced by 75 points; in October 2008, the interest rate was reduced by 50 points.
We find that the previous several unconventional interest rate cuts have shown different characteristics. The 1997 Southeast Asian financial crisis was the turning point of the recovery cycle of the current economic cycle from 1982 to 1993, and the market response was delayed by 4 years. But the transition from recovery to prosperity is still an upward curve, so unconventional interest rate cuts occurred only once in 1998, after the crisis.
The bursting of the technology stock bubble in 2000 heralded an acceleration of the boom cycle from 1993 to 2000. After the bubble burst, the Fed cut interest rates three times unconventionally. 2004 was the peak of the current cycle. The market response was delayed for 4 years, so the subprime crisis broke out in 2008. But since this round of crisis is the turning point of prosperity to recession, it is clear that before the market peaked, the Fed has begun to cut interest rates unconventionally. Since then it has cut interest rates several times.
The current cycle is from recession to depression, and the global economy is accelerating downward, so unconventional interest rate cuts should occur before the outbreak of the economic crisis.
As I have always expressed in the previous article, US stocks may have peaked at 30,000 points, but this does not mean that double tops or even triple tops cannot be formed in 2020. Therefore, unconventional interest rate cuts indicate that the market will rebound at a certain position in the future, killing shorts first, then peaking again to kill longs, and finally completing long and short double kills. This theme will surely run throughout the year 2020.
So why at this time, we found that on the one hand, the market has calculated the results of interest rate cuts, and on the other hand, continued to fall, in order to prepare for bottoming out and short selling.
In the previous article "Talking about My Opinion on Digital Currency Investment", I mentioned the time cycle of the top experts in the investment field. Many people were puzzled and thought that such an investment concept would miss many opportunities. So I want to take this opportunity to reorganize with you the ideas about cycles.
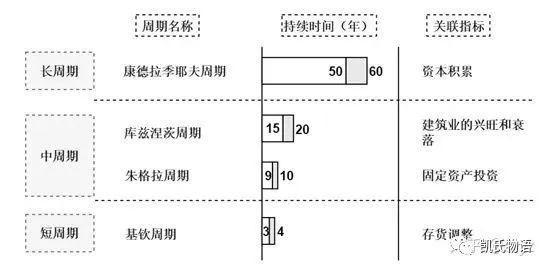
The Kangbo cycle is the longest economic cycle, with a length between 45 and 60 years. Divided into four stages of recovery, prosperity, recession and depression. In general, from the beginning of the industrialization era, we have experienced the steam engine era, the railway era, the electrical and automotive era, and the automation era. We are now at the turning point of the fifth round of the Kangbo cycle information and communication era.
This is very easy to understand. Any new technological revolution will lead to social change, and it will also bring about a new population increase. In the early budding stage, the concentrated expression of innovation is to gradually trial and error, and then run quickly. At the mature stage, when it is gradually adapted and used by a wide population, it is easy to bring overheated funds to the industry, and a series of overdevelopment stages have emerged, ignoring that the population has reached its peak. dividend. Then the industry contracted and the bubble burst, until the prelude to the technology appeared a new technology prelude or infrastructure.
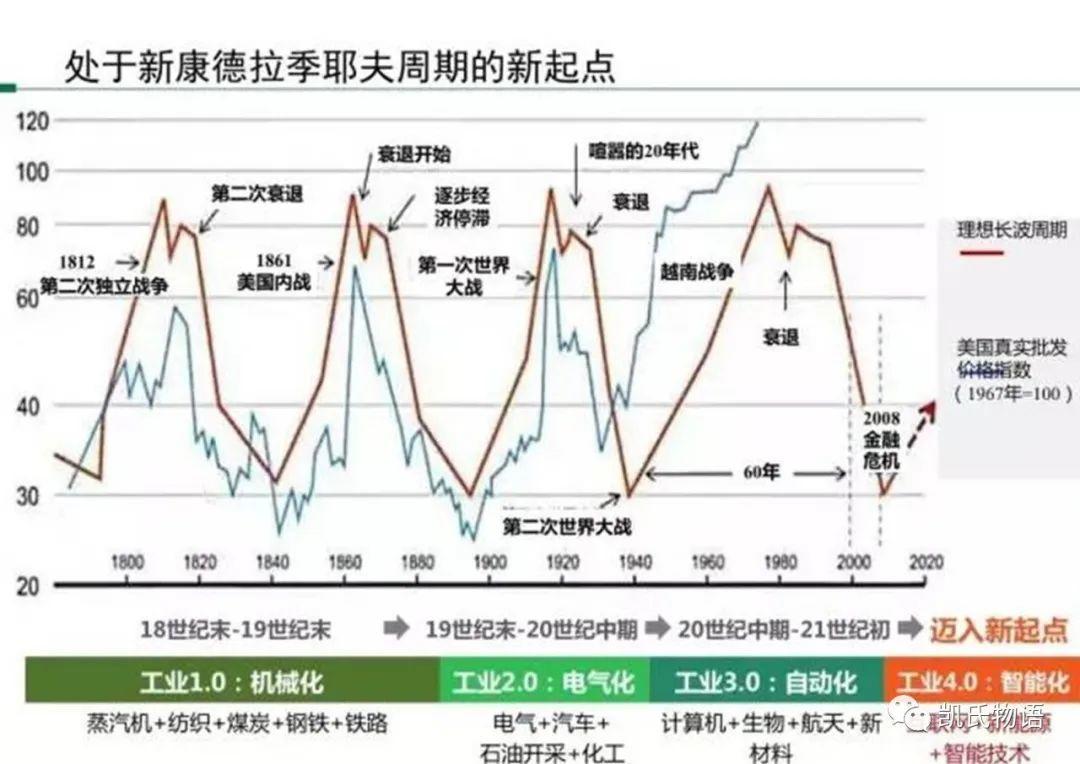
In essence, human society is the economic development brought about by the population transition led by the technological revolution, and finally forms a cycle. Repeatedly, endlessly.
Further down, the Kuznets cycle, which is mainly represented by the prosperity and decline of the construction industry, is also known as the real estate cycle. In this cycle, two factors are mainly reflected, one is the desire of the people's property to purchase real estate, and the other is the population migration. Because as long as there is an increase in population, there will be demand for housing. Thinking from another angle, this also reflects the phased rise and fall of population flow from the side. In general, the Kuznets cycle is a cycle of 20-22 years, of which 14-15 years are rising cycles and 6-7 years are falling cycles.
In general, China's real estate cycle began in 2001, so the overall upward phase has been completed by 2016, and the downward phase will bottom out in 2021. And because 2020 is the inflection point of China's demographic dividend, the historical peak of China's real estate appeared two years earlier in 2018. In the coming decades, real estate will be in a long-term downward channel. In other words, 15 years after bottoming out in 2021 will be a high level shock for China's real estate, and then it will plummet and continue to fall.
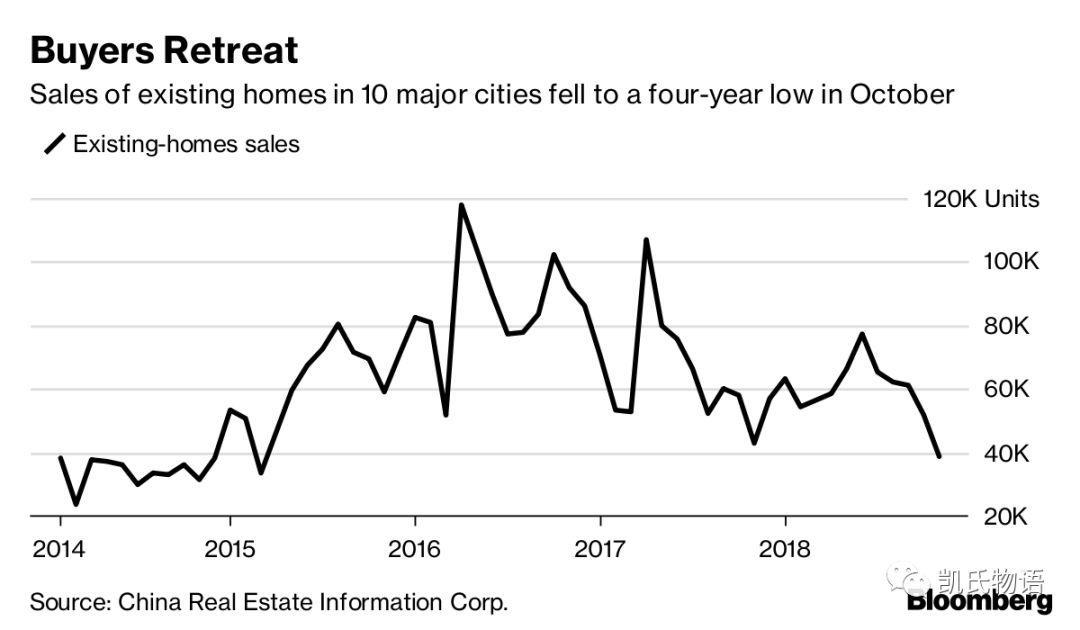
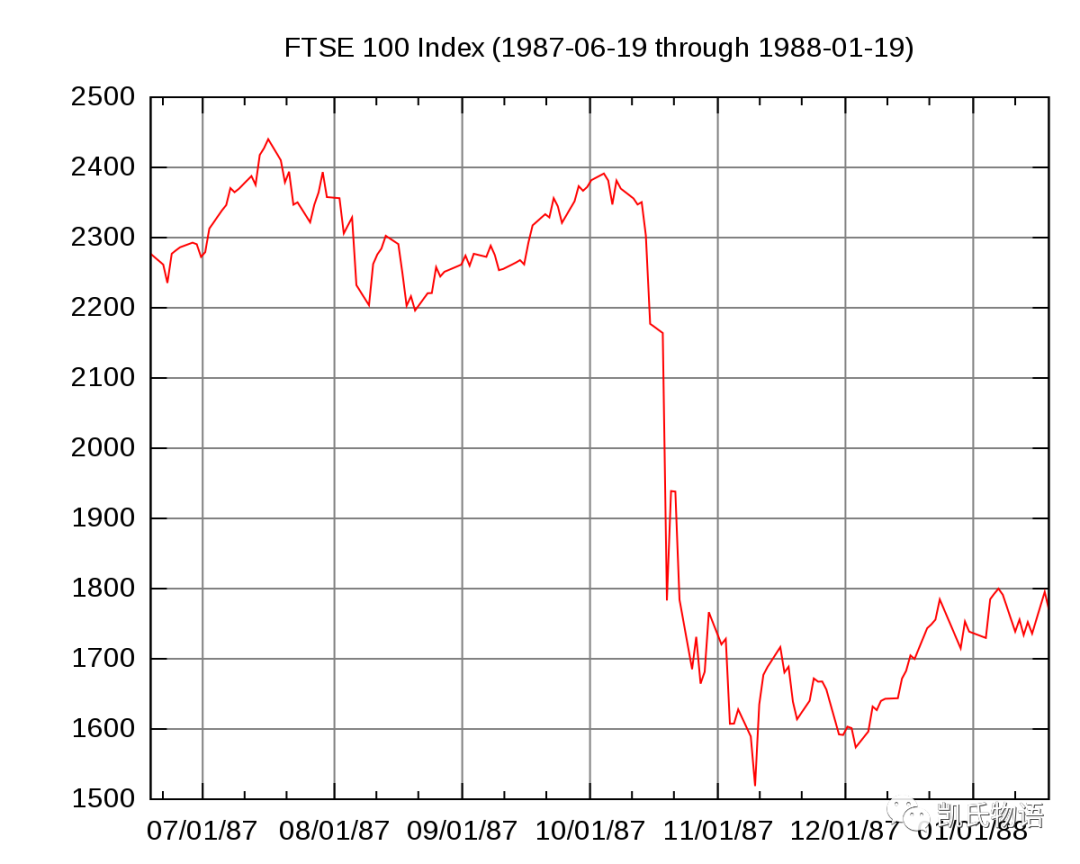
This process is no different from the United States after 1973. In the United States in 1987, due to the "Black Monday" of the US stock market, the real estate collapse caused a big rise of about 15 years. At the beginning of the economic recovery from 1982 to 1987, people began to flood into the city, and real estate rose rapidly until the bubble burst. Historically, after deducting inflation, the historical peak of U.S. real estate was from 1971 to 1972, and the second peak was in 1987. After that, U.S. real estate plummeted. Even in the subprime crisis crisis, the real estate bubble peaked in 2008 and did not reach 1973. The previous 70%.
The real estate population logic of Beishangguangshen will be different from the past. After all, the grand and magnificent situation of the Kangxian Dynasty and the IWC will require foreigners to participate. Just like today ’s New York, California, London, and Tokyo, housing prices in core areas It will be determined by the global purchasing power of real estate. This is the premise of the discussion on the long-term residence policy for foreigners who have been discussing the green card in these two days.
A Kangbo cycle contains 2-3 Kuznets cycles, which essentially depends on the speed of iterative technological development.
In the process of technological development, feedback will be provided through the market and products. From the early test of the water, the small scale of the trial to the emergence of profit, expansion of production, and finally overinvestment, which in turn affects the profit of the enterprise and finally shrinks the enterprise. This process is called the Jugla Cycle.
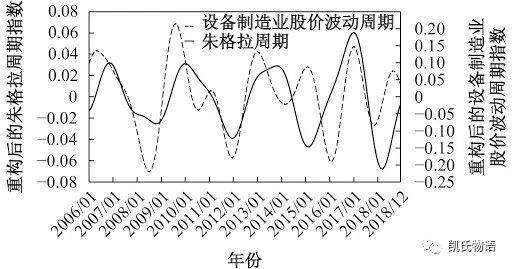
The Jugra cycle is also called the middle cycle or investment cycle. It mainly reflects the different stages of the above-mentioned corporate investment and operation cycle. A Jugla cycle is roughly 10.5 years, that is, a Kuznets cycle contains 2 Jugla cycles, and a Compo cycle contains 4-6. Jugla cycles.
The global financial crisis that occurs every 10 years or so is a reflection of the Jugla cycle.
But how to judge the integrity of a Jugla cycle? This depends on the process in which the enterprise will produce products, and the asymmetry between the product and the market will lead to rapid liquidation of the product and insufficient production capacity, or the backlog of excess products will reduce the production willingness. This process is the Kitchen cycle, also called short cycle, or inventory cycle.
If the supply and demand of goods are dismantled and combined with inventory, it will be divided into four stages: active destocking, passive destocking, active plus inventory, and passive plus inventory. An inventory cycle is about 40-42 months, which is 3.5 years. This is basically the smallest unit of the business cycle. There are three Kitchin cycles in a Jugla cycle.
The Kitchin cycle will give investors a very good inspiration from the actual investment. As a whole, the secondary market should be a reflection of the fundamentals of the business cycle, so the trend of the market will, to a certain extent, show the periodic characteristics of the business cycle.
Then we can simply test, because the stock market is not open during weekends and vacations, so on average, there are about 20.2 trading days in a month, then it is 3.5 years * 12 months * 20.2 trading days = 848.4 trading days. , About 850 days. In other words, in the stock market, the 850-day moving average of the daily chart should be an important long-term trend line that can reflect the Kitchin cycle.
If we take a closer look at the major crises that have occurred in the US stock market for nearly 50 years since 1973. As long as an economic crash occurs, US stocks will fall sharply below the 850-day moving average. In times of non-major crisis, the 850-day moving average has become a strong support for the market. Basically, there is a large breakdown every ten years or so, which coincides with the Jugla cycle. The major breaks were in the oil crisis of 1974, the real estate crash caused by Black Monday in 1987, the bursting of the technology stock bubble in 2001, and the 2008 subprime mortgage crisis.
If you use the 850-day moving average to observe A shares, you will find the same reason. The inflection point of the 850-day moving average rose in 2010, and then it began to decline all the way. My understanding is that it has been the result of China's economic leverage since China's accession to the WTO in 2001. The added leverage in the early stage cannot be sustained in the later period. From 2010, it gradually began to show a reduction in the return on leverage. The market took precedence over the real economy. The real estate cycle lagged behind the market response. China began to deleverage in 2015 and after August 2016. Making it clear that real estate is no longer supported as a pillar industry is actually a process of economic deleveraging.
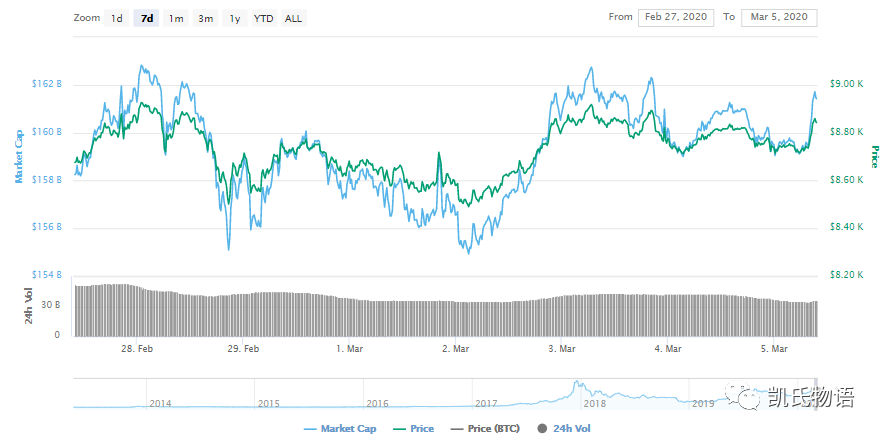
So the question is, will there be the same economic cycle reflection on Bitcoin?
In the Bitcoin bull and bear market before 2015, there was no linkage with the global economy at all, and it can be understood as a completely independent single-point market, so the rise and fall cannot be expressed 100% through the law. However, this round of bull and bear markets after 2015 is clearly related to the global economy, and the correlation has increased year by year. Therefore, we can use the latest Bitcoin bull and bear market as a reference indicator, and continue to verify it in subsequent development.
Because Bitcoin's transaction time is a state of 24-hour uninterrupted transactions around the world, then 3.5 years * 365 days = 1277.5 days, which exceeds the duration of the daily chart. The average line converted into a weekly chart is 182.5 moving average.
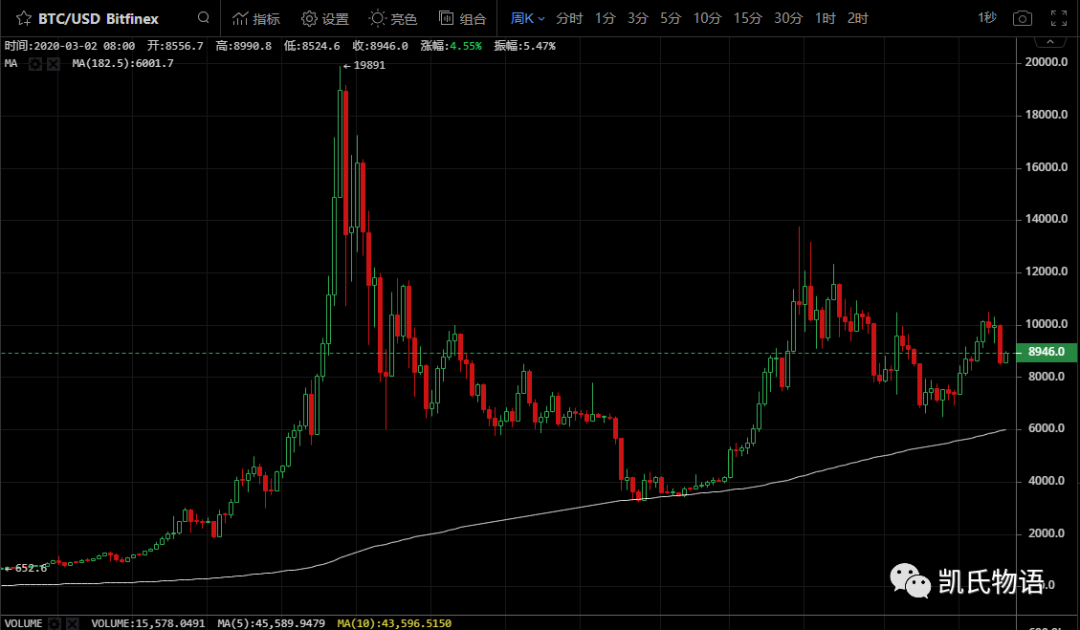
At this time, we will find that the phased bottom of Bitcoin that appeared in December 2018 was almost sliding up along the weekly 182.5 moving average, and finally broke away to start the upward trend. At this point in time, August 2015, the bottom of the last bear market, was exactly 3.5 years, a complete Kitchin cycle. The error of this number is so small that even the 183 moving average or 182 moving average cannot reflect the correlation of the bottom of the Bitcoin bear market. To re-understand Bitcoin from this perspective, I think that Bitcoin has actually moved out of the 4-year model of the halving cycle and is closer to a new economic cycle model.
3.5 years may have become a complete Bitcoin economic cycle, and its important watershed is the 182.5 weekly moving average.
This is also the important reason why this round of the Bitcoin business cycle is different from the past, and it also explains why December 18 was the bottom of the current round of rises, not the time point of August-September 18. Then we can understand that this round of the Bitcoin economic cycle started to bottom out in December 18 and may reach the top in June 2021, instead of the end of December that was previously thought, and then it will decline all the way. Reaching a new bottom until mid-2022.
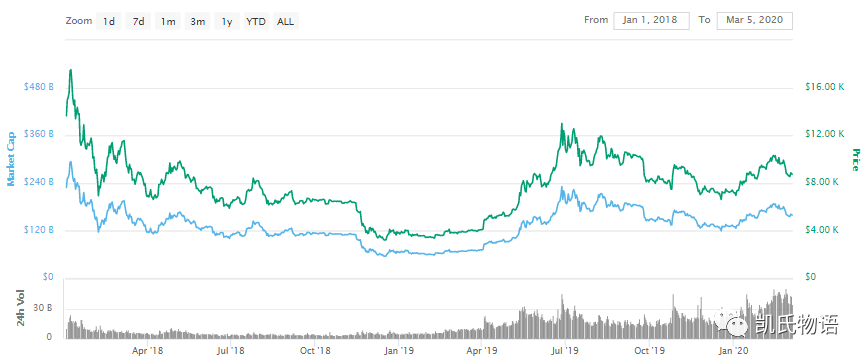
Observing from this perspective, the position of Bitcoin at this moment is very similar to that of September 2016. Of course, the rate of increase after that will certainly not reach the state of 16-17 at the end, but based on the judgment of the entire Bitcoin economic cycle, Look, the starting point of the core FOMO stage should be mid-December 2020, and then a surge similar to the 9.4 event of 17 years, and reached its peak in June 2021, this price may be close to about 60,000 US dollars. This number needs to be adjusted and re-evaluated according to the later data, but in general, I tend to reflect the price of Bitcoin at that time.
Then the back-to-back price of Bitcoin in 2020 may be very consistent with the views expressed in my previous article. With the long and short double kills, double tops and double bottoms are formed. And this has formed a strong correlation with the global stock market crash and the tempo of the central bank to release water.
It is precisely this correlation that in turn confirms that the Kitchin cycle formed a unique Bitcoin economic cycle in the Bitcoin market. The asynchrony comes from the fact that Bitcoin is essentially the initial state of blockchain technology innovation in the next round of economic cycles.
In general, I tend to think that the epidemic has brought the global economic market, especially the top of the US stock market, ahead of time, but it has not changed its critical point in time, so it may not be accompanied by a long-short double-kill but a long-short 3-kill. This can capture subtle signals from the side from the characteristics of the current Bitcoin business cycle and the periodic price of Bitcoin.
Back to U.S. stock interest rate cuts, unconventional interest rate cuts have verified the market's expectations for a 100% interest rate cut in March, but why did the global market not start bottoming out but continue to plummet? Because they are waiting for the next signal, which is the upcoming Fed meeting on interest rates on March 18.
No matter what the result is, it may be guided by the market to rise. If the market starts to calculate in advance whether the Fed continues to cut interest rates, it should start ahead of the meeting. And such a time point is the same for Bitcoin. The phased bottoming may be completed next week, after which it will start to rise, ushering in a 9-month long and short double kill.
Bitcoin does not die, and the cycle lives forever.
We will continue to update Blocking; if you have any questions or suggestions, please contact us!
Was this article helpful?
93 out of 132 found this helpful
Related articles
- Bitcoin's biggest loyal fan, Twitter CEO Jack Dorsey again funding Bitcoin developers
- Market analysis: BTC stabilizes and rebounds, is expected to build a curved bottom
- Bitcoin Secret History: What did Satoshi Nakamoto and BM chat in Bitcointalk
- Grayscale GBTC fund premium suggests institutional investors hoarded bitcoin in February
- U.S. SEC proposes amendments to securities issue exemption rules involving token issuance
- Strong alliance, EY, Microsoft and ConsenSys build Ethereum middleware Baseline Protocol
- "If you can be the president for a day, let BTC become the national currency." Why is investment boss Tim Draper so obsessed with Bitcoin?