Data tells you how the DEX ecosystem evolved in 2019
Now let's review its evolution over the past year with data and images.
Data and methods
In this review, we include 20 DEXes throughout the year in the sample:
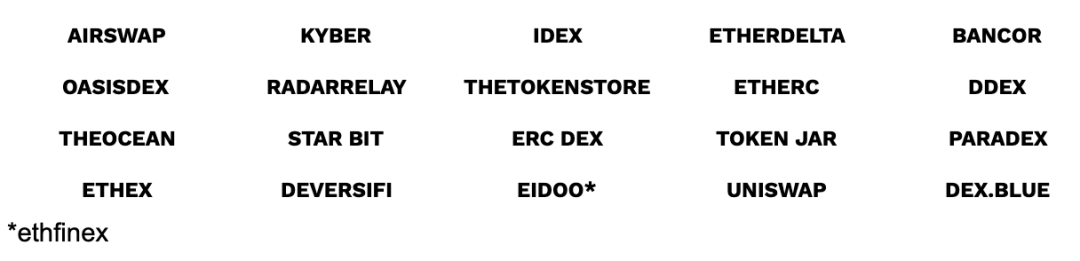
20 decentralized exchanges with centralized data monitoring
- Viewpoint | In 2020, blockchain is a thing to do if you lose money
- 2019 bitcoin chain data review: nearly 4 trillion US dollars of "giant whale" on the chain during the year are in a dormant period
- Inventory of "dead" blockchain projects in 2019: the peak of funds running in March
The chart in this article only reflects the value collected from these 20 decentralized exchanges. In addition, irreplaceable tokens (NFTs, ERC-721s) are not included in this data set.
Because the DEXes protocol mechanism has different unique attributes, some indicators may have different meanings in different situations. We will pay attention in due course.
DEX platform analysis
Daily transaction count across DEXes
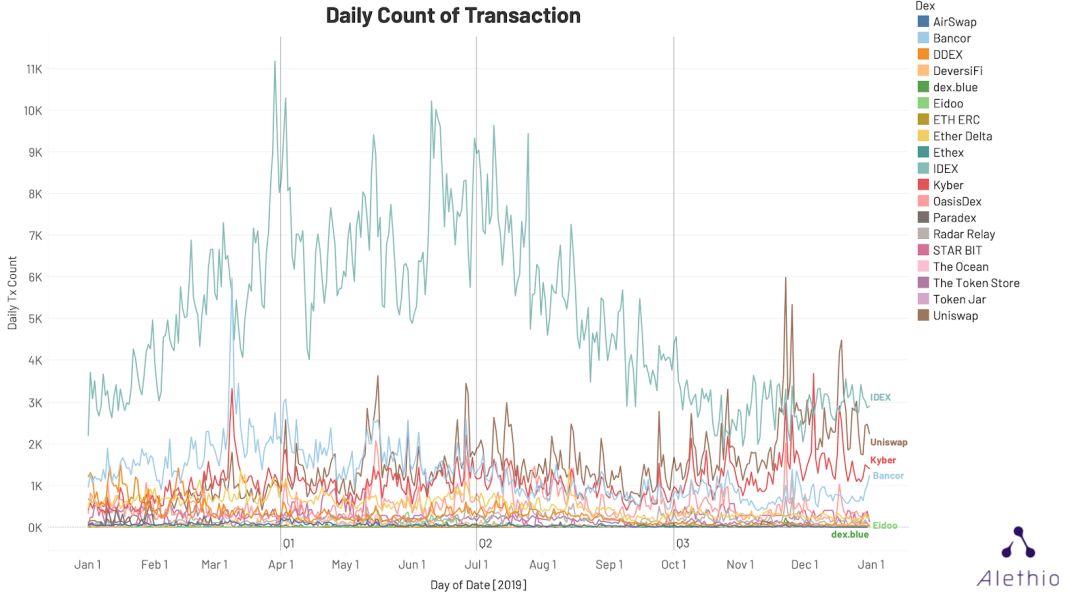
EtherDelta and IDEX gained significant adoption in 2017 and 2018. Until 2019, these two companies are still the two with the largest total trade. Beginning in mid-2018, more protocols and repeaters have appeared. By the end of 2018, Uniswap had flourished due to its superior availability, and by the end of 2019, it had become the second place in daily transactions.
In the timeline below, we can see that IDEX is still the market leader when it comes to the number of transactions in the past year, and Uniswap, Kyber and Bancor have surpassed EtherDelta.
The number of transactions on IDEX peaked in the second quarter (about 7,000 transactions per day on average), and then returned to about 3,000 transactions per day in the fourth quarter. Uniswap, Kyber, and Bancor take turns occupying the following 3 positions, and the average daily count fluctuates within the range of ~ 1k-2k.
Please note that a single trade order can be matched and counted twice across DEXes. Moreover, the number of transactions here does not equal the transaction volume, because the transaction volume of each transaction is different. We will discuss volume later in this article.
Number of transactions per day
Monthly trading volume of ETH in a decentralized exchange
Most DEXes do not provide fiat currency entry, so DEX traders either trade tokens on Ethereum (ETH) or trade local tokens. In order to exchange the same amount of ETH, some packaged tokens act as bridges on some DEXes (for example: ETH on 0x, ETHW on DeversiFi, ETHtoken on Bancor), they represent the same value and price.
We can divide the DEX industry into two categories:
- transactions between tokenX and tokenY,
- Or tokenX to ETH (ETH to tokenX).
In order to estimate the transaction volume of all tokens, we found it difficult to match the accurate real-time token value in U.S. dollars, because the U.S. dollar price of all tokens is difficult to collect, and they are also collected from centralized exchanges. We decided to measure the transaction volume of ETH and only consider transactions for ETH (including packaged tokens), because the converter price of the direct token to token transaction is either incomplete (difficult to collect all) or lagging (Estimated from recent past transactions).
Therefore, our data does not reflect the transaction volume of direct token-to-token transactions. However, for most major decentralized exchanges, protocols usually divide token-to-token transactions into two categories: tokenX to ETH, and ETH to tokenY.
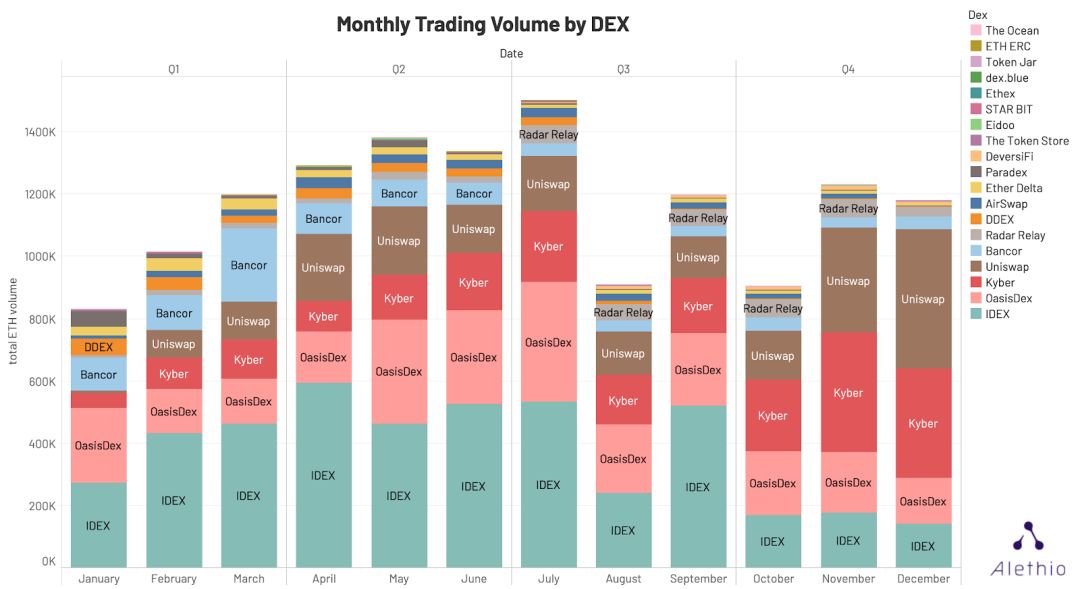
Monthly ETH Trading Volume in DEX
The figure above shows the ETH transaction volume for each DEX. We see that DEXes' total ETH ranking is consistent with the transaction count chart. The number one IDEX produced an average of 400k ETH per month in the first 3 quarters, and an average reduction of 200k ETH per month in the fourth quarter. OasisDex, Kyber, Bancor and Uniswap are close behind.
TOKEN performance
Monthly trading volume of tokens to ETH
In the list of 20 monitored DEXes alone, about 43,000 different tokens were traded last year. Here is the timeline of the token transaction volume for ETH:
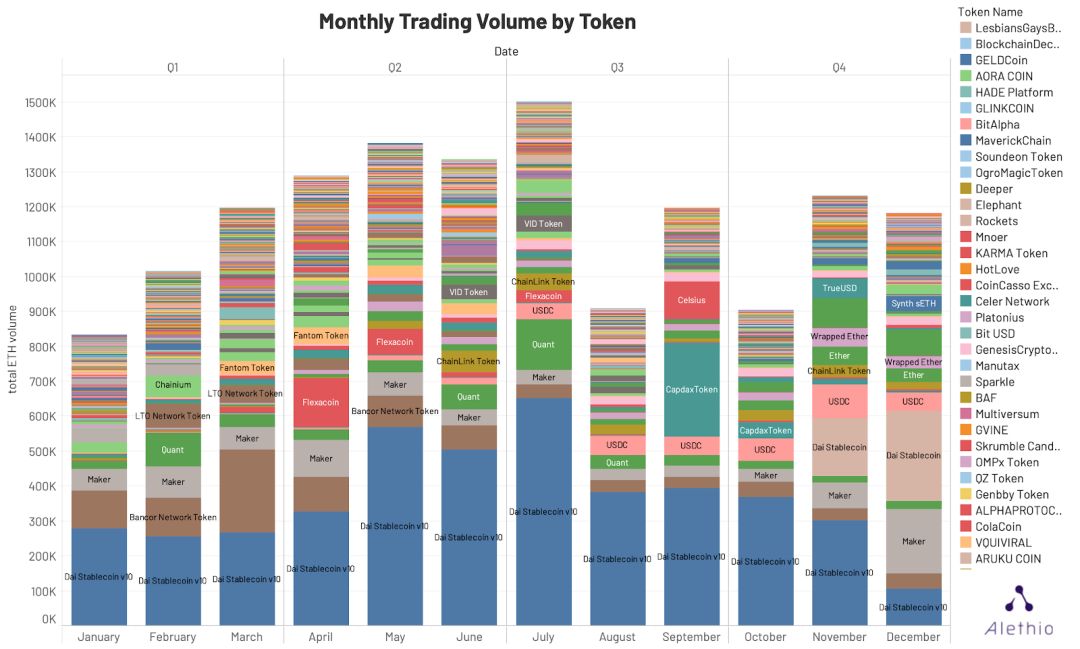
Monthly trading volume of all DEX tokens (to ETH)
With the rise of DeFi, we have seen Dai stablecoin v1.0 (the blue part, now renamed SAI) as the most traded coin this year. Other stable currencies, including the US dollar and TrueUSD, maintain high trading volumes throughout the year. New tokens (DAI) appeared in the fourth quarter of 2019 and quickly gained market share to become the second generation tokens.
In June and July, the transaction volume of ChainLink tokens soared. At the same time, the ChainLink project connected dapps with the real world, and the market was excited about it.
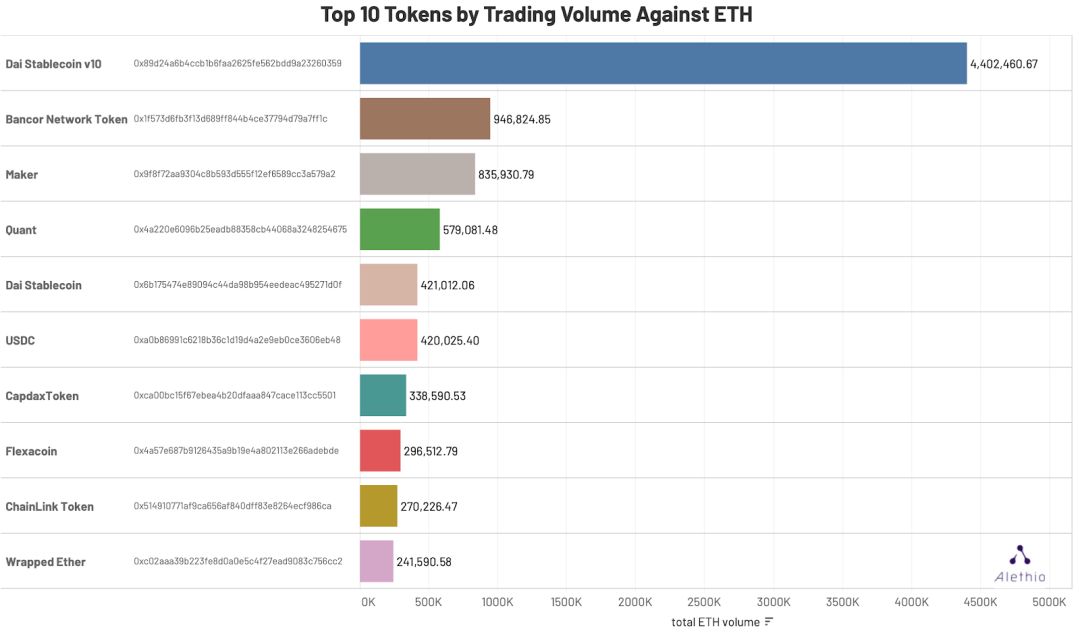
Top 10 tokens vs. ETH trading volume comparison
Based on the overall annual trading volume, the turnover of SAI (labeled Dai Stablecoin v10 in the picture) exceeds 4.4 million ETH, which is about 4.6 times higher than the second-ranked BNT. The above picture also highlights some of the most popular projects last year, including MakerDAO, Quant, Capdex, Flexacoin.
In addition, we have created the word "WordCloud" below to understand which DEX platforms provide liquidity for these top coins. Each word has a corresponding color, and the size indicates the transaction volume of a particular token.
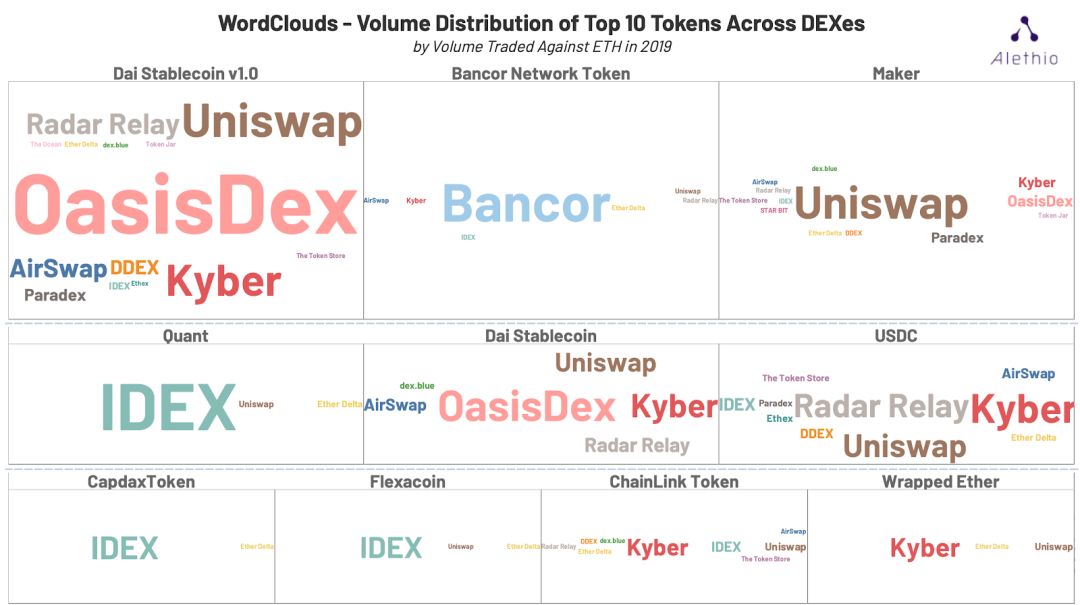
Wordcloud for the first 10 tokens across DEXes
OasisDex, a market trading platform derived from MakerDAO, contributed the most to SAI (approximately 2.42 million ETH). Not only that, SAItoken also circulates on Uniswap, Kyber, RadarRelay, AirSwap, DDEX and Paradex.
Interestingly, Maker tokens are traded more frequently on Uniswap than OasisDex.
BNTtoken (Bancor network token) is mainly traded on Bancor, but the number of transactions elsewhere is much less. Similarly, Quant, CapdaxToken and Flexacoin are almost exclusive on IDEX, while ChainLink and Wrapped Ether are exclusive on Kyber. In contrast, for Dai Stablecoin (Dai) and USDC-the two major stablecoins, the circulation distribution of each platform is more evenly distributed.
Diversity of liquid tokens
Classified by DEX, we can see the number of different tokens in circulation in 2019. Although EtherDelta is not the top in terms of transaction or transaction volume, it still provides the most types of transaction tokens, with 3190 different tokens trading on it.
Note that the "liquidity token" is not the same as the "available token" on DEXes. Some available tokens may not have a market bid or ask price, so the number calculated here may be less than what is actually listed.
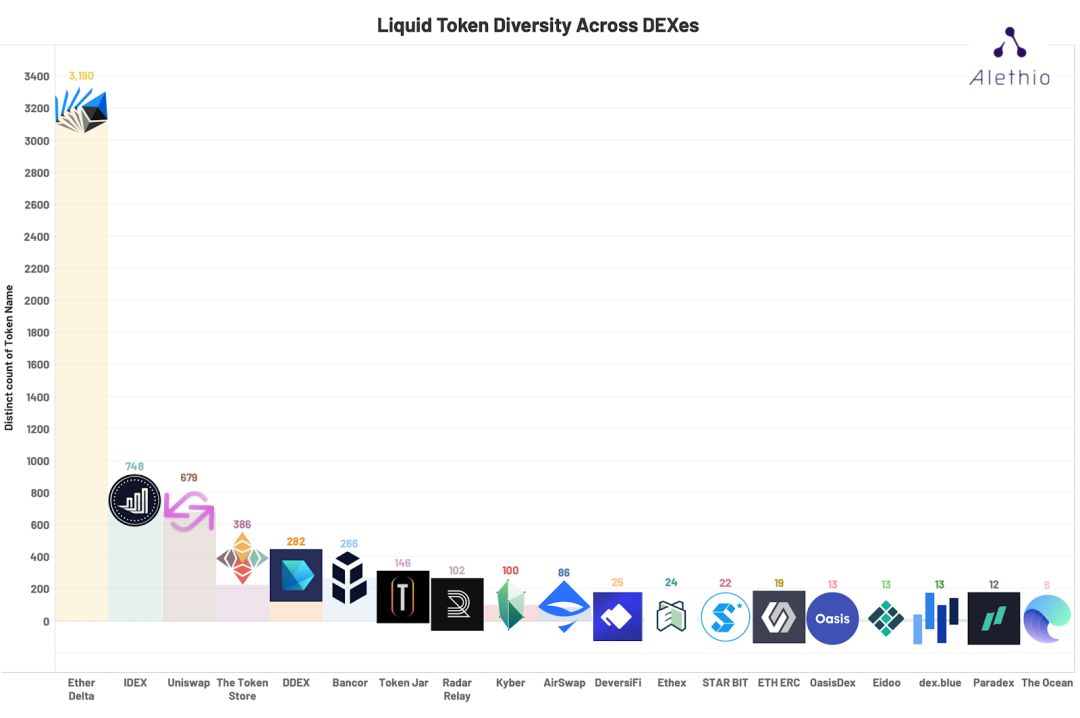
Diversity of liquidity tokens across DEXes
user group
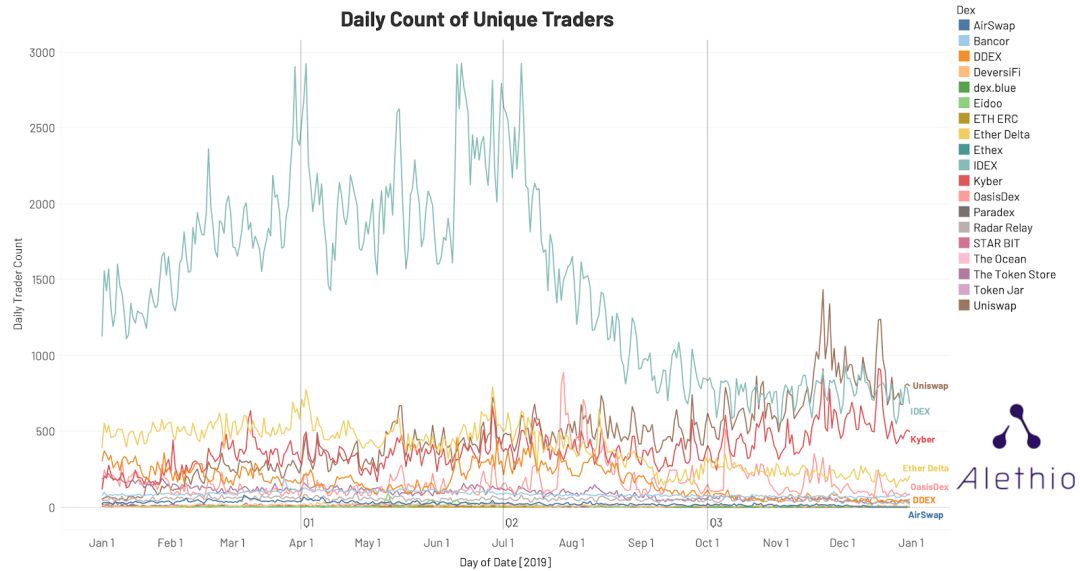
Daily unique transaction address count
For IDEX, the daily count of unique traders follows a similar pattern of transaction counts and volumes. Uniswap ’s active users have grown steadily throughout the year, reaching about 1300 active users per day when it peaked in early December. In late July, OasisDex's daily traffic spiked to about 900 people, which may be due to SAI's CDP rewards activity.
There is a significant correlation between Kyber and Uniswap. Over time, the number of traders on these two platforms share very similar values, which may be a signal that they share a common user group. The network diagram below validates this assumption
Network diagram : user overlap between DEXes
By collecting unique addresses that act as creators or recipients in transactions, we are able to map a user-based network of DEXes, including user overlap between different DEXes.
Because transaction information is not recorded for trade execution, we cannot collect data for users. For these network diagrams, it should be noted that the number of addresses here cannot be assumed to be directly related to the number of users. One person may use multiple unique addresses, so it is safe to determine that the actual user size is smaller than the number of addresses shown in Figure x.
In addition, some protocols may show a "shrinked" size that is smaller than the actual user size (eg, Bancor). This is because in their agreement, the recorded dealer address is actually a collection of freight forwarder or converter contracts that operate the actual transaction.
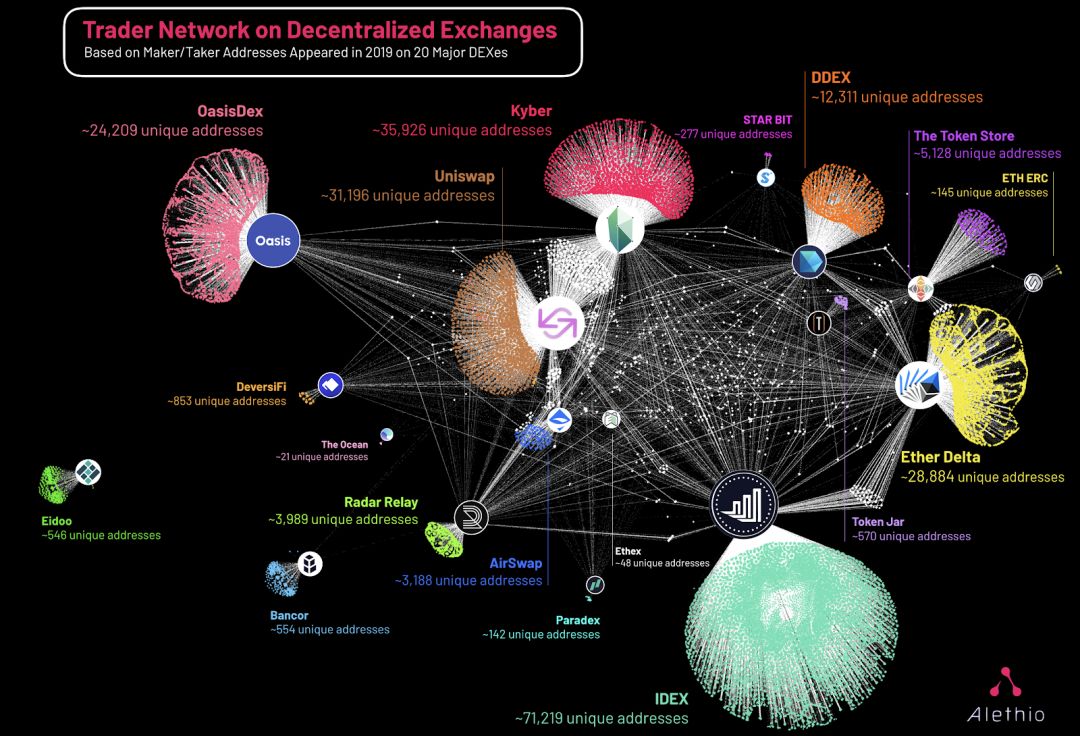
Dealer Network for DEX 2019
In the chart, colored dots ("exclusive traders") are addresses that only trade on those separate platforms. The white ("shared trader") is a shared point on multiple DEXes, and the total number of addresses found by each DEX is marked next to it. Note that this number is not exclusive to the size of the cluster, but contains white shared nodes.
It is worth noting that the largest sharing group is the sharing group between Uniswap and Kyber, which proves our previous hypothesis from the time series correlation of their active users.
As can be seen from the cluster size, IDEX has the largest exclusive trader base, followed by OasisDex and EtherDelta. In the picture, Bancor and Eidoo seem to be separated from the cloud, although this may be due to the converter system we mentioned earlier.
Author: Alethio
Compilation: Share Finance Neo
We will continue to update Blocking; if you have any questions or suggestions, please contact us!
Was this article helpful?
93 out of 132 found this helpful
Related articles
- The number of banks applying for blockchain patents has increased 38 times in 4 years. Weizhong Bank wins the championship with 288 patents.
- CME Group's option products based on Bitcoin futures officially launched
- Blockchain + Medical Research Report: The biggest pain point of data and traceability, blockchain technology may save more than 100 billion US dollars in costs each year
- Blockchain 2B company is hot: the company takes orders madly, employees 996, year-end awards have increased significantly
- BTC block reward is about to be halved, will its security rate be halved?
- Industry Blockchain Weekly 丨 Blockchain writes 7 provincial government work reports, Baidu and Tencent enter A shares
- Babbitt weekly election 丨 Do you panic when 2020 starts like this?