QKL123 market analysis | Crypto assets are highly correlated, and Ethereum wants to go independent? (0311)
Abstract: The market is still in extreme panic, and there is no obvious sign of inflow of OTC funds, and the shock adjustment continues for a short time. At present, the price correlation between Bitcoin and most mainstream crypto assets is more than 90%, and it is significantly lower than Ethereum. With the launch of Ethereum 2.0, the market may diverge this year.
")
At 16:00 today, the 8BTCCI broad market index was reported at 11,693.22 points, with a 24-hour rise or fall of + 0.27%, reflecting a slight rebound in the broad market; total turnover was 955.826 billion yuan, a 24-hour change of 9.68%, and market activity declined. Bitcoin strength index was reported at 89.43 points, with 24-hour fluctuations of -0.58%. The relative performance of Bitcoin in the entire market has weakened; the Alternative sentiment index is 17 (previous value 16), and market sentiment is expressed as extreme fear; The over-the-counter discount premium index was reported at 101.74, with a 24-hour rise or fall of -0.27%, and the intensity of over-the-counter fund inflows slightly weakened.
Analyst perspective:
- Why doesn't Bitcoin look like a bull market?
- What is the reason for the Bitcoin crash? The decline in the traditional market, or the sale of PlusToken
- YouTube cryptocurrency ban strikes again, this time they deleted two videos
Compared with risk assets such as stocks, the price correlation between crypto assets is high, showing a strong correlation similar to precious metals such as gold. This is mainly because most mainstream crypto asset projects are still in the relatively early stage of development. In particular, the performance (or few practical applications) of public blockchains at present is not much different and relatively homogeneous.
Historically, the large inflow of funds in the crypto asset market was mainly driven by investment or speculative demand, with less pull from actual application demand. In addition, the continuous increase of trading pairs such as Bitcoin and Ethereum on the trading platform has accelerated the liquidity of the funds on the floor and further increased the correlation between the prices of crypto assets.
Most of the listed below are mainstream crypto assets based on POW. Most of the indicators with high price correlation are mining-related indicators (mining difficulty, network computing power, mining revenue), and reflect the demand on the chain. The correlation of the indicators (number of transactions, number of transfers, amount of transfers, number of active addresses) with the price is significantly lower (except for Ethereum).
Crypto asset prices and indicators, price-price correlations (last three months)
")
Note: The correlation here refers to the correlation coefficient in the statistical sense and does not indicate causality; the data comes from bitinfocharts.
In the past three months, the correlation between the price of Bitcoin and most mainstream crypto assets has been as high as 90%, and the correlation with the price of Ethereum is 86%, which is significantly lower. In the same period last year, the correlation between Ethereum and other crypto assets as "altcoin" was stronger than the correlation between Bitcoin and other crypto assets. What makes this market change? This may be related to Ethereum itself. This year, Ethereum 2.0 will completely abandon POW and move to POS, or it will be an important differentiation in the crypto asset market.
First, the spot BTC market
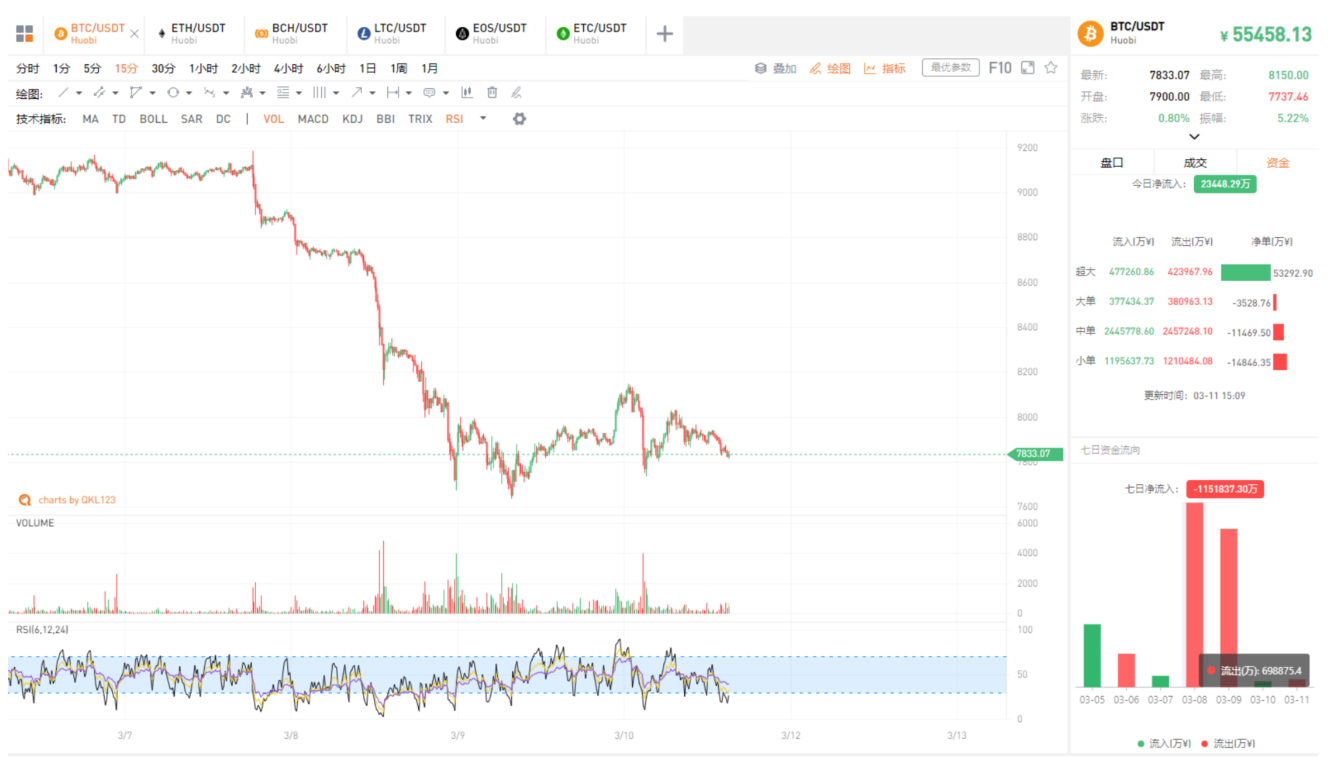
Yesterday, BTC rebounded slightly, reaching a maximum of $ 8,150, but under strong pressure, it was quickly counterattacked by the Air Force for a short time, reaching a minimum of $ 7,750. However, for a short period of time, many troops did not show weakness, obviously after heavy volume did not fall below the previous low, the intention of the main force to participate in this position is relatively obvious, and the net inflow of oversized singles is obvious, and the possibility of shock and stabilization is increased.
Second, the spot ETH market
")
ETH continues to engage in long and short battles around 200 dollars, but the amount can shrink. The 200-dollar chip distribution is relatively concentrated. I am afraid that longs and shorts will have to remain deadlocked, and Bitcoin will still have to be chosen in the subsequent direction.
Third, the spot BCH market
")
The performance of BCH is similar to that of ETH, and it has fluctuated in recent days. The price is currently hovering in the position of heavy volume in January. Today, the main and retail funds are consistently bullish, and the market has begun to turn more, but the short-term inflow is not obvious, and it continues to link the Bitcoin shock.
Fourth, the spot LTC market
")
LTC's inflow of funds has also begun to turn long, but it has not stood at $ 53. The amount of energy is also shrinking, and many military forces have not significantly intervened, and they have adjusted for short-term shocks.
V. Spot EOS Quotes
")
EOS contracted and fluctuated. At present, it is basically on the 3.1-dollar chip concentration area. Retail funds are starting to look long, waiting for the intervention of the main force.
Six, spot ETC market
")
ETC is also showing a contraction shock, short-term oversold has been reduced, and retail funds have obviously intervened, but the main force is still hovering. Although ETC will reduce production within a week, the positive will not change the overall market trend, and it is difficult to get out of the independent market. In the near future, it is still linked to Bitcoin.
Analyst strategy
1. Long line (1-3 years)
The long-term trend of BTC is still in the next one to two years, and it is expected to usher in the crazy bull market. It is now a good time to vote. The smart contract platform leader ETH, altcoin leader LTC, DPoS leader EOS, BTC fork currency leader BCH, and ETH fork currency leader ETC can be configured on dips.
2. Midline (January to March)
BTC fell to the 200-day moving average, and the halving is good, and there is room for further release. The relative prices of other assets are relatively low, and they are involved in batches.
3. Short-term (1-3 days)
Shock adjustments, small positions attract low and sell high, stop losses.
Appendix: Interpretation of Indicators
1. 8BTCCI broad market index
The 8BTCCI broad market index is composed of the most representative tokens with large scale and good liquidity in the existing global market of the blockchain to comprehensively reflect the price performance of the entire blockchain token market.
2.Bitcoin Strength Index
The Bitcoin Strength Index (BTCX) reflects the exchange rate of Bitcoin in the entire Token market, and then reflects the strength of Bitcoin in the market. The larger the BTCX index, the stronger the performance of Bitcoin in the Token market.
3.Alternative mood index
The Fear & Greed Index reflects changes in market sentiment. 0 means "extremely fearful" and 100 means "extremely greedy." The components of this indicator include: volatility (25%), transaction volume (25%), social media (15%), online questionnaire (15%), market share (10%), and trend (10%).
4.USDT OTC Premium Index
The ChaiNext USDT OTC INDEX index is obtained by dividing the USDT / CNY OTC price by the offshore RMB exchange rate and multiplying by 100. When the index is 100, it means the USDT parity, when the index is greater than 100, it means the USDT premium, and when it is less than 100, it means the USDT discount.
5.Net Funds Inflow (Out)
This indicator reflects the inflow and outflow of funds in the secondary market. By calculating the difference between the inflow and outflow of funds from global trading platforms (excluding false transactions), a positive value indicates a net inflow of funds, and a negative value indicates a net outflow of funds. Among them, the turnover is counted as inflow capital when rising, and the turnover is counted as outflow capital when falling.
6.BTC-coin hoarding indicator
The coin hoarding indicator was created by Weibo user ahr999 to assist bitcoin scheduled investment users to make investment decisions in conjunction with the opportunity selection strategy. This indicator consists of the product of two parts. The former is the ratio of Bitcoin price to the 200-day fixed investment cost of Bitcoin; the latter is the ratio of Bitcoin price to Bitcoin fitting price. In general, when the indicator is less than 0.45, it is more suitable to increase the investment amount (bottom-sweeping), and the time interval accounts for about 21%; when the indicator is between 0.45 and 1.2, the fixed investment strategy is suitable, and the time interval accounts for about 39 %.
Note: Crypto assets are high-risk assets. This article is for decision-making reference only and does not constitute investment advice.
We will continue to update Blocking; if you have any questions or suggestions, please contact us!
Was this article helpful?
93 out of 132 found this helpful
Related articles
- Tracking Plus Token: Bitcoin dropped 20% in 2 days, is it the smashed disk?
- There are investment bosses who bless and do not resist. Why is the DeFi project Paradigm Labs "dead"?
- Research Report: Can Bitcoin Be a Safe-Haven Asset?
- Research Report | 2020 Notable Disruptive Innovations Including Bitcoin: Bitcoin's Market Cap Results Will Be in Trillion
- Perspective | The era of Ethereum is coming: in the next 10 years, the rise in ETH prices will be driven by these 5 factors
- Behind the 20 billion monthly positions in the crypto market: who left?
- Babbitt Column | A Guide to the Application of Blockchain in Healthcare


