Token Terminal: In-depth analysis of the operating principles and economic models of common Layer1s
Token Terminal: In-depth analysis of the economic models of Layer1s.Author: Tokenterminal
Compiled by: DeepTechFlow
We often intuitively feel the costs and benefits of using different blockchains, namely gas fees and incentives.
But do you really understand their complete economic models? Where do gas fees and incentives come from, and where will they flow? How do market performances differ under different economic model designs?
- Rollups as a service solution: Eclipse technology principle analysis
- Origin Protocol: Dual-token model, a new player in the DeFi track
- Why does Vitalik believe that zk-SNARK technology will be as important as blockchain in the next 10 years?
Token Terminal explores the economic models of major L1s and L2s based on PoW and PoS, as well as emerging models such as liquidity staking protocols. It breaks down and gives examples of the economic models of each blockchain in a very easy-to-understand way.
At the same time, by visualizing the daily fee changes of blockchains, it also provides insight into the market performance of mainstream blockchains, for investors to use the framework in the article to compare the economic performance, potential, and sustainability of blockchains.
Introduction
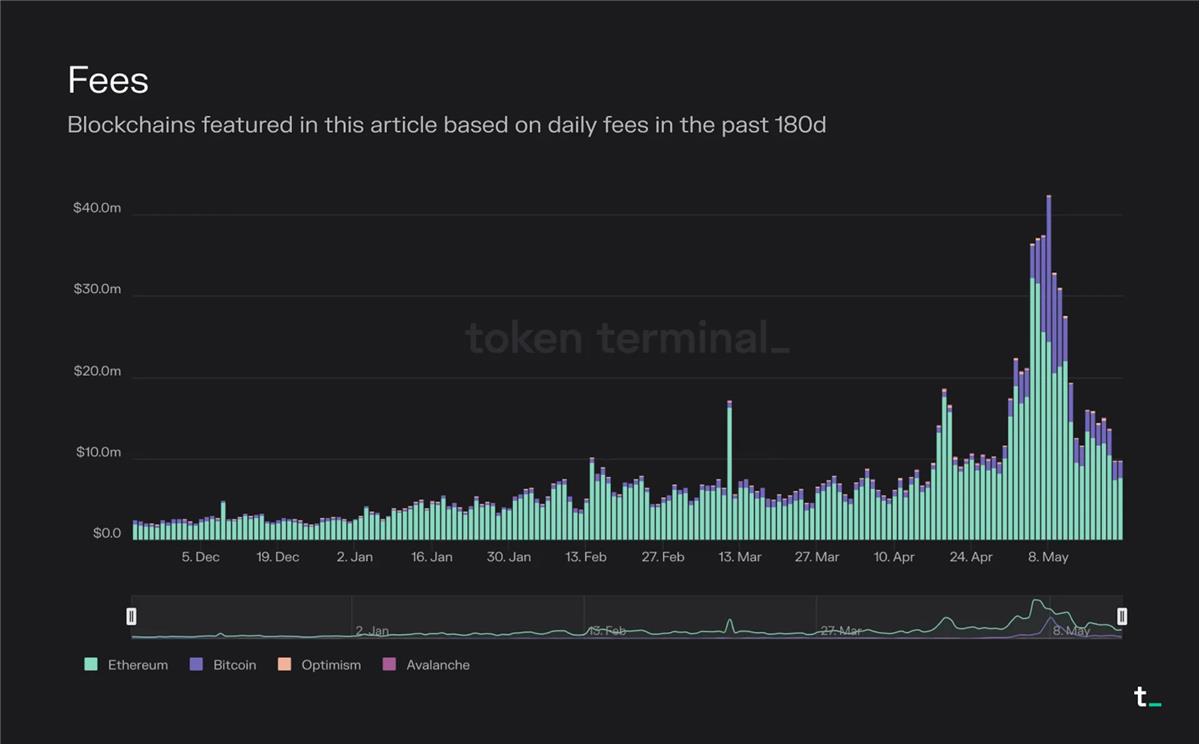
The following chart visualizes the daily fees of the blockchains mentioned in this article over the past 180 days.
DeepTechFlow note: It can be seen that the total transaction fees of Ethereum and Bitcoin are still far ahead.
The key components that typically make up the economic structure of a blockchain are transaction fees, inflationary block rewards (incentives), and fee burning.
Transaction fees represent the market price of block space.
Incentives are economic rewards that encourage people to take action, such as validating transactions.
Fee burning is a mechanism that removes a portion of each transaction fee from circulation.
Given the limited capacity of individual blockchains, we will see a world with multiple different blockchains – each optimized for different use cases – that interoperate with each other. The blockchain market was initially dominated by Bitcoin, an extremely simple and limited contract execution environment. With the launch of Ethereum, it became theoretically possible to deploy arbitrary complex contracts or programs on a blockchain. Now, with the rise of scaling solutions, application-specific blockchain, and cross-chain bridges, it is also possible in practice to deploy arbitrarily complex contracts (scalability is no longer a limiting factor). In this article, we will break down the economic models of the most common types of blockchains.
L1 based on PoW
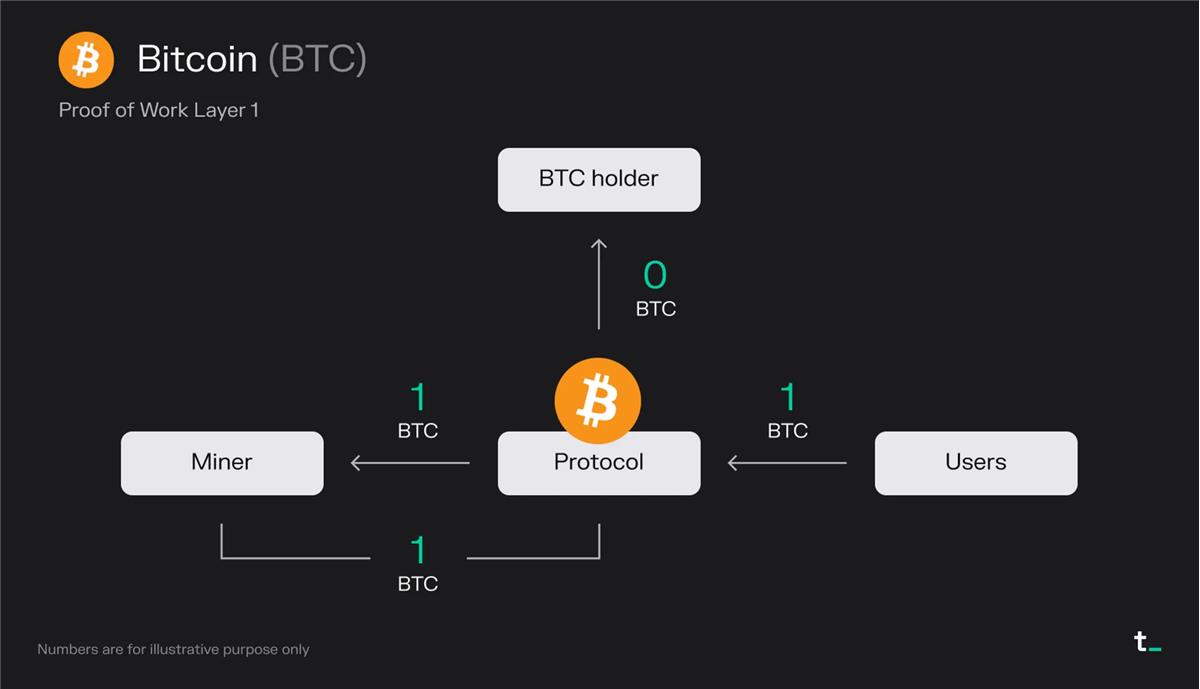
Principle Explanation:
- Users pay 1 BTC transaction fee for a block.
- Miners receive all fees (1 BTC)
- Miners gain 1 BTC (newly issued BTC) from block rewards.
Final Result:
- Miners receive 2 BTC
Points:
- The demand for submitting a transaction on Bitcoin creates a market for block space. Users pay miners for block space. Bulk subsidies further incentivize miners. The bulk subsidy is newly minted Bitcoin, which increases the total supply of money. Currently, all fees and block subsidies in Bitcoin are owned by miners.
- Bitcoin provides security through CPU power. The value proposition of Bitcoin is to create a secure, transparent, and immutable global ledger that allows for value transfer without trust and irrevocability. These values are maintained by the security originating from CPU usage. Each block requires a large amount of CPU power to be validated on the network. Essentially, 1 CPU corresponds to 1 vote on the network. Therefore, as long as the majority of CPU is in the hands of honest miners, the network is secure.
- Bitcoin’s economy is determined by two variables: transaction fees and block subsidies. Transaction fees are determined by the supply and demand of network block space. Block subsidies are inflationary rewards that increase the circulation supply of BTC. Currently, a miner of one block receives a reward of 6.25 BTC, which halves every four years. Eventually, Bitcoin will reach a maximum supply of 21 million (expected to happen around 2140), and block rewards will be composed solely of transaction fees. This means that users adopting economic sustainability for the network is crucial.
L1 based on PoS
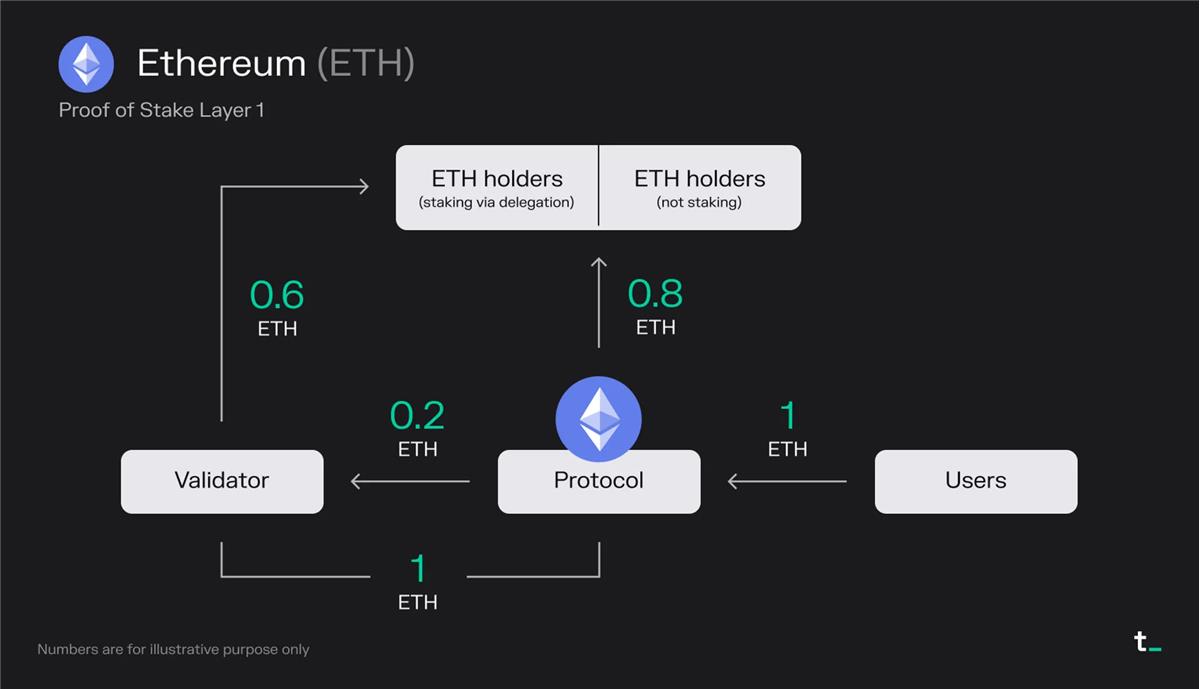
Principle Explanation:
- Users pay 1 ETH in transaction fees (including MEV) for a block.
- 0.8 ETH is burned, benefiting all ETH holders equally through a “stock buyback.”
- Validators earn 0.2 ETH from the fees.
- Validators receive 1 ETH from the block reward (newly issued ETH).
- As validators have already received half the shares from the delegators, they must share 50% of their income with these ETH holders.
Final result:
- 0.8 ETH is burned.
- Validators receive 0.6 ETH.
- ETH holders who delegated receive 0.6 ETH.
Points to note:
- On Ethereum, approximately 85% of the total transaction fees are burned, effectively acting as a “stock buyback” that benefits all ETH holders equally. Validators earn the remaining fees and an additional staking reward, i.e., newly minted ETH. In the past 30 days, Ethereum has averaged about $15 million in fees per day.
- The fee-burning mechanism implemented through EIP-1559 in August 2021 turned ETH into a productive asset. Additionally, the transition from PoW to PoS reduces the rate of new ETH issuance. Since the Merge in September 2022, Ethereum no longer distributes block rewards to miners. This change has reduced the issuance of new ETH by around 90% (about 14k ETH/day in block rewards replaced by about 1.7k ETH/day in staking rewards). This has led to a supply crunch for ETH during periods of high usage.
- Ethereum’s economic structure consists of three key components: total transaction fees, burned transaction fee portion, and staking rewards. Transaction fees are determined based on the supply and demand of network block space. Staking rewards are an inflationary reward that increases the total supply of ETH. Fee burning puts deflationary pressure on ETH, while the reduction in circulating supply could potentially increase the token’s value over time.
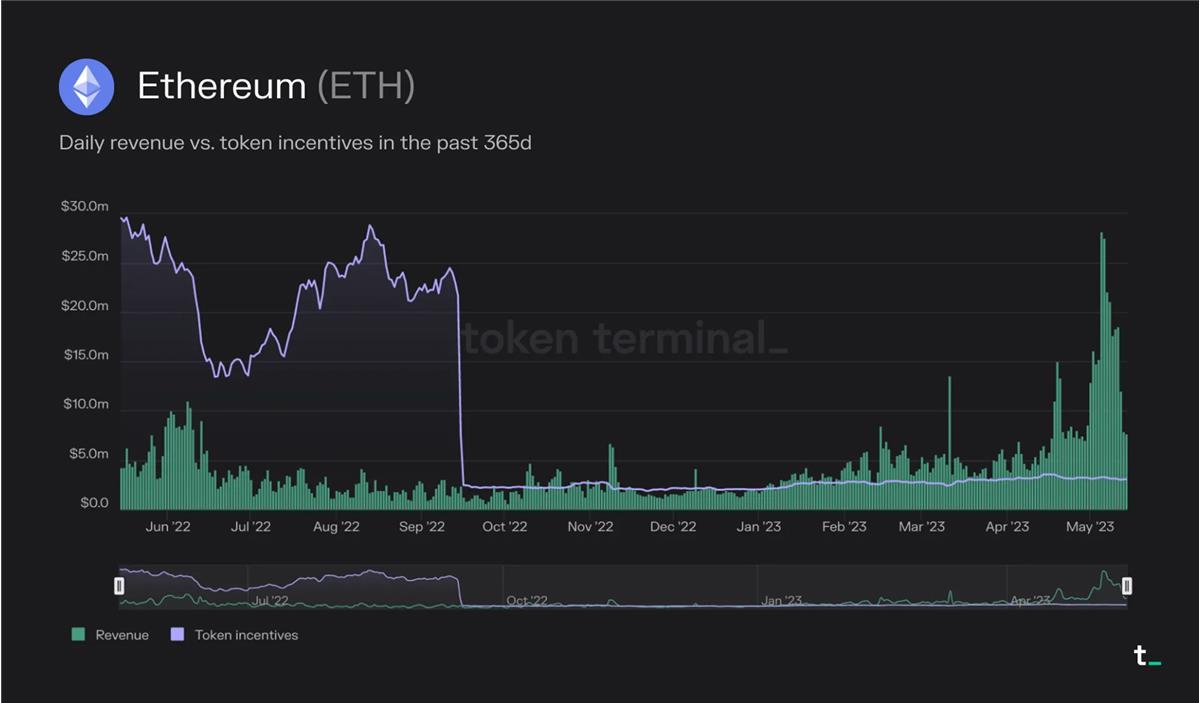
After the merger, ETH’s supply has been in a state of deflation during periods of high usage. For example, in May of this year, the amount of ETH destroyed (revenue) was consistently greater than the amount of ETH minted as staking rewards (token incentives).
The liquidity staking project allows users to stake their assets and maintain liquidity through derivative tokens that represent the underlying asset (liquid staking derivative, LSD).
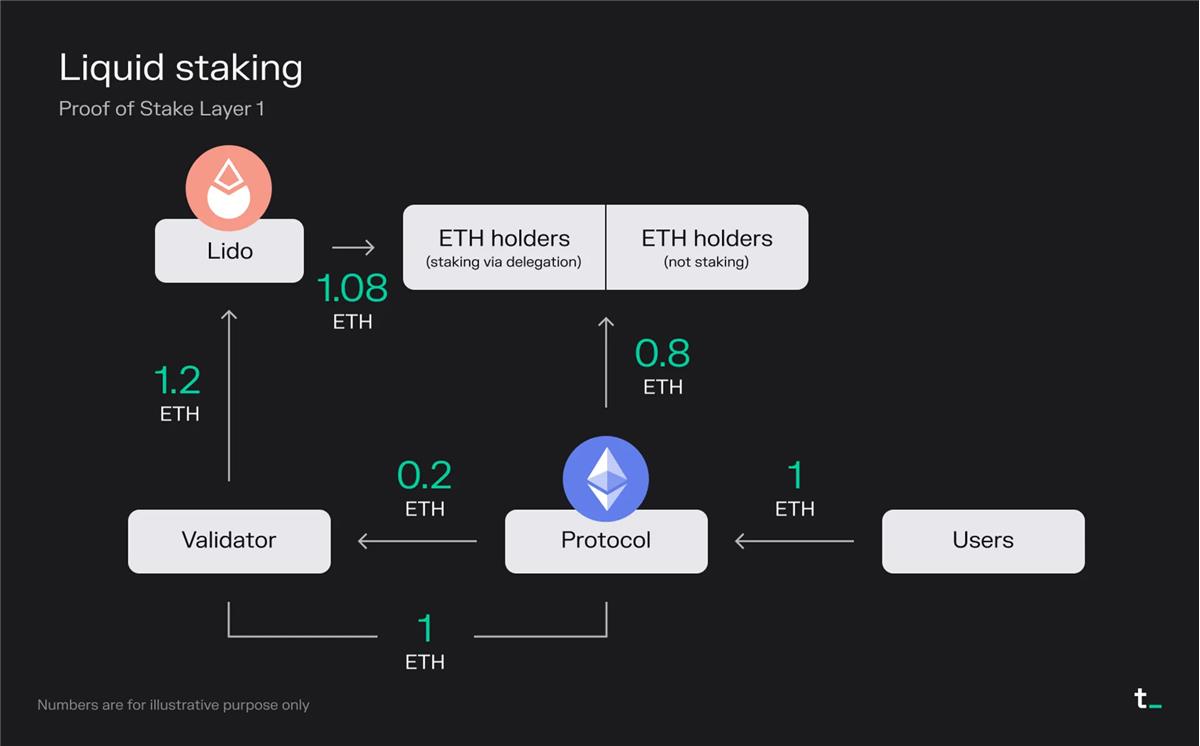
Principle Explanation:
- Users pay 1 ETH in transaction fees (including MEV) for a block
- 0.8 ETH is burned -> “stock buyback” lets all ETH holders benefit equally
- Validators earn 0.2 ETH from fees
- Validators receive 1 ETH (newly minted ETH) from block rewards
- Validators have full ownership from users who deposited ETH via the Lido liquidity collateral protocol, so it shares 100% of revenue with these ETH holders
- Lido takes 10% (0.12 ETH) from the total staking reward for providing its service and distributes the remaining 90% (1.08 ETH) to ETH holders who staked via Lido
Final Result:
- 0.8 ETH is burned
- Validators receive 0 ETH
- Lido receives 0.12 ETH (with 50% used to pay node operating costs)
- ETH holders who staked via delegation will receive 1.08 ETH
Key Points:
- The Liquid Staking protocol enhances the user experience. Staking, which is essentially a technical and high-maintenance process, has been simplified by protocols such as Lido. By allowing users to lock their ETH and receive transferable utility tokens (stETH), Lido facilitates seamless staking while allowing users to earn rewards associated with validation activity. To provide this service, Lido charges a fee of 10% of total revenue. This fee is split evenly between node operators and the Lido DAO.
- The technical and capital-intensive nature of staking opens up opportunities for liquidity staking protocols. Traditional Ethereum staking requires users to maintain a node, invest a substantial amount of capital (32 ETH), and sacrifice token liquidity. In contrast, Lido allocates users’ tokens in batches to validators, thus eliminating the barrier of 32 ETH. By simplifying the user experience, providing liquidity, and democratizing staking, Lido and similar protocols are opening up a rapidly growing market space.
- The democratization of staking allows for broader investor participation. Outside of the blockchain (L2), the liquidity staking market segment is one of the fastest growing market segments. The successful execution of the Shapella upgrade (April 12th) arguably lowered the risks associated with ETH as an investment and risks associated with ETH as a revenue asset. As a result, the ETH staking ratio (staking assets/circulating market cap) is expected to increase and be on par with other PoS chains. Currently, ETH’s staking ratio is around 15%, relatively low compared to other PoS chains. For example, Solana and Avalanche currently have over 60% staking ratios. Given ETH’s high market cap, which is currently around $220 billion at the time of writing, we can see staked assets growing by billions of dollars in the coming quarters.
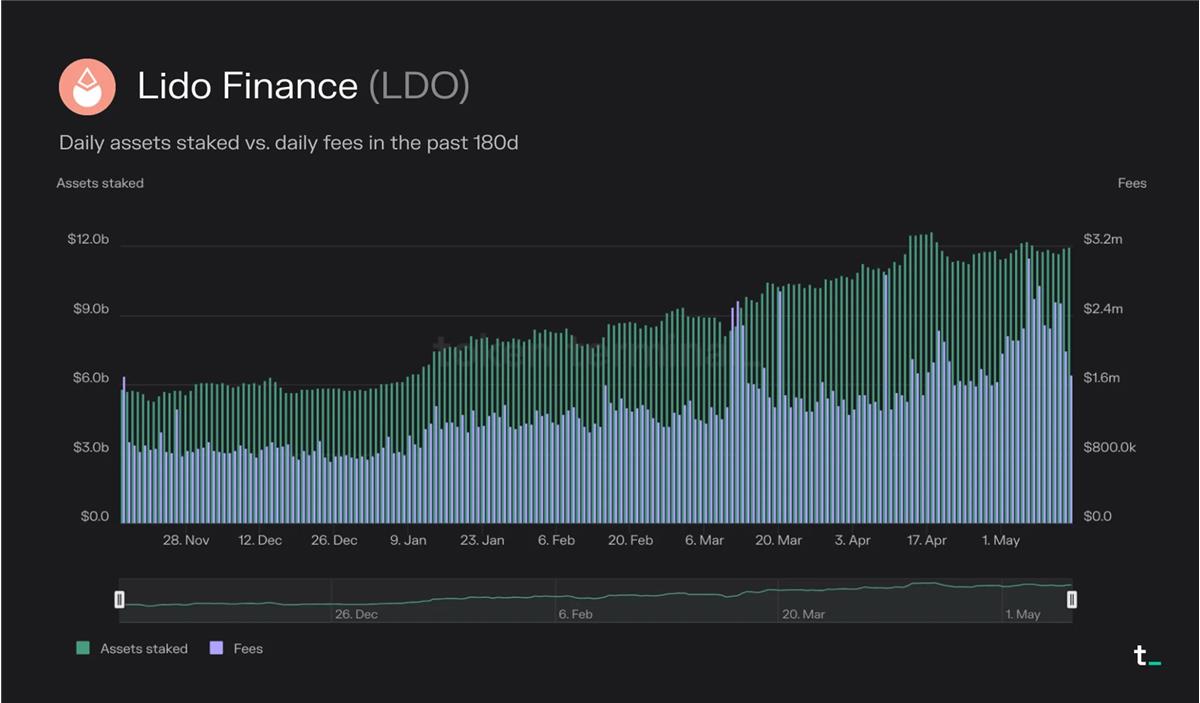
Lido has become the current market leader in the field of liquidity staking markets, with a total staked asset value of $12 billion. This number has increased by 38% year-on-year and by 105% over the past 180 days.
Over the past 30 days, Lido has generated $60.4 million in fees and earned 10% of that, or $6.04 million, in revenue. This revenue is split 50/50 between node operators and the Lido DAO.
Avalanche is a Layer 1 blockchain that competes with Ethereum by prioritizing scalability and faster transaction speeds. It uses a novel consensus algorithm that offers strong security, fast transaction finality, and high throughput while maintaining decentralization.
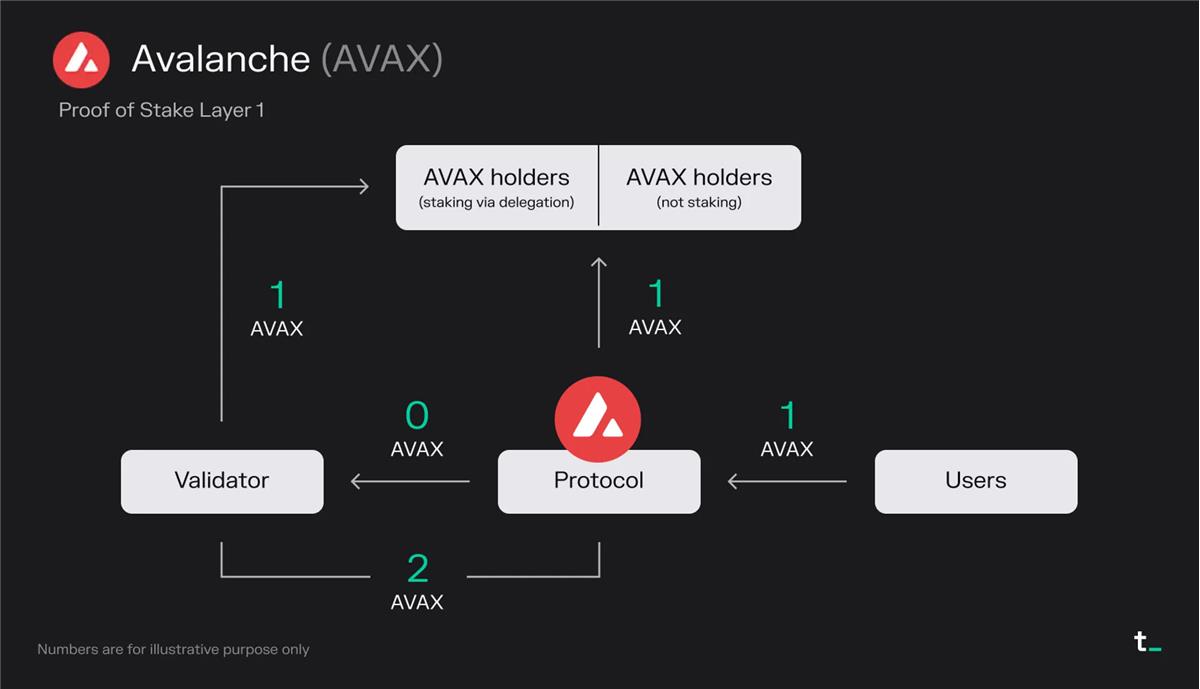
Principles:
- Users pay 1 AVAX in transaction fees for a block
- 1 AVAX is burned -> “stock buyback” that benefits all AVAX holders equally
- Validators earn 0 AVAX from fees
- Validators receive 2 AVAX (newly minted AVAX) from block rewards
- Since validators have already received partial ownership from delegators, they must share their earnings with those AVAX holders
Final result:
- 1 AVAX is burned
- Validators receive 1 AVAX
- AVAX holders who delegate stake receive 1 AVAX
Key points:
- On Avalanche, all transaction fees are burned, and validators’ only source of income is staking rewards. The burning mechanism, as a form of “stock buyback,” benefits all AVAX holders equally. Over the past 30 days, Avalanche’s average daily fees have been around $64,000.
- As a relatively new member of the blockchain space, Avalanche is issuing a large number of AVAX tokens to incentivize its validators. This approach is often used as a way to guide growth in the early stages of a platform. These incentives attract validators and stimulate growth and activity within the Avalanche ecosystem.
- Avalanche’s economic model may change in the future. Fee and reward structures are not set in stone and can be adjusted based on future governance decisions. Currently, 50% of the total supply of AVAX tokens is allocated as staking rewards for validators. This allocation plan is set to occur over a ten-year period from 2020 to 2030. As staking reward allocations eventually come to an end, we may see some portion of transaction fees redirected to validators in the future.
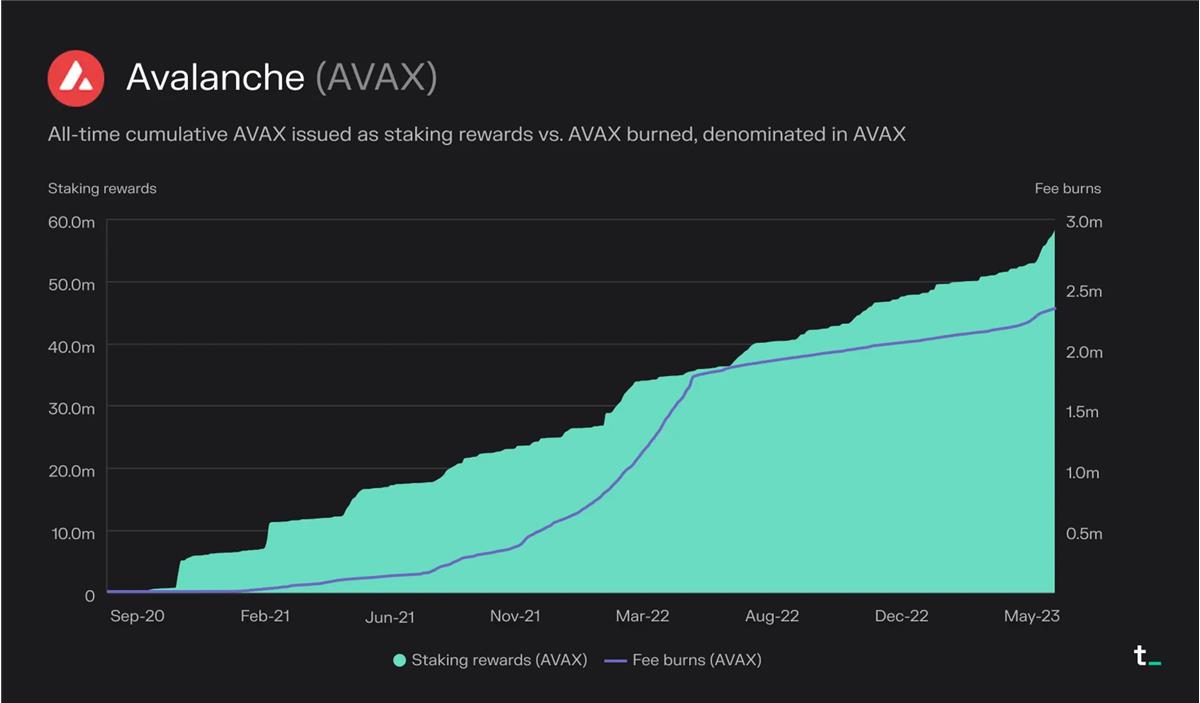
Since the network launched in September 2020, approximately 2.3 million AVAX have been burned and about 57 million AVAX have been distributed as staking rewards.
PoS-based L2
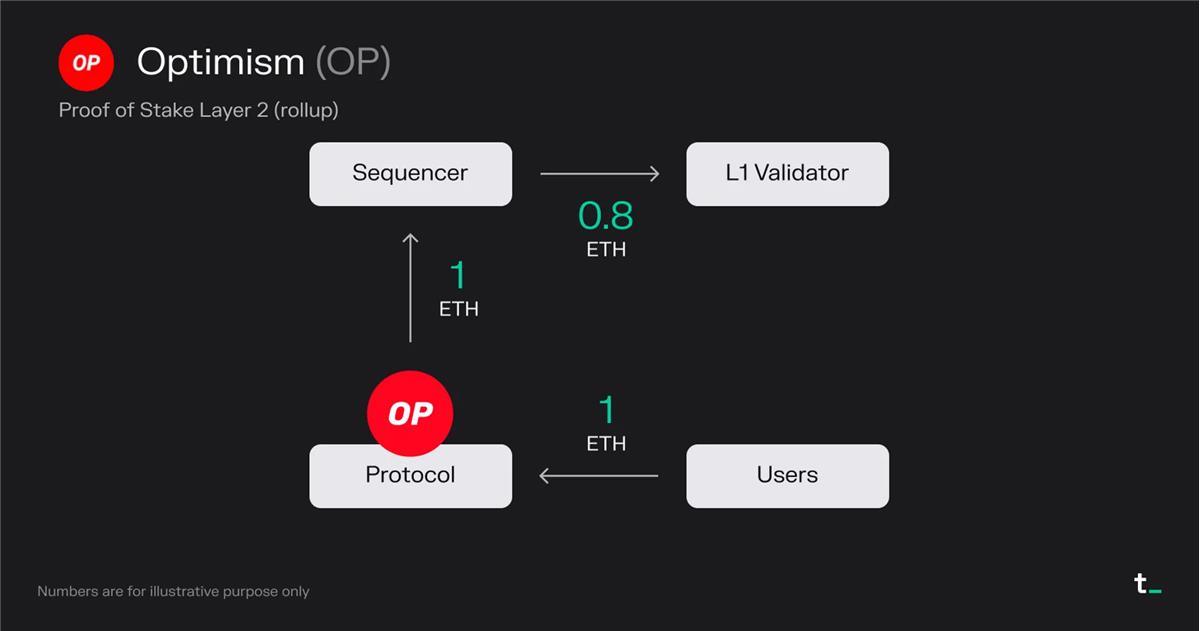
Optimism is an extension solution (Optimistic Rollup) that aims to make Ethereum better by improving its transaction speed and throughput. Optimism executes transactions on L2 and batches them to L1 for final settlement. Depending on the type of transaction, this results in approximately 5-20 times less gas used.
Principle explanation:
- Users pay a transaction fee of 1 ETH for a block
- All transaction fees (1 ETH) go to the sequencer running by the Optimism Foundation
- The sequencer pays a transaction fee of 0.8 ETH to submit the transaction to L1 (Ethereum)
- The sequencer (in this case, the Optimism Foundation) retains 0.2 ETH as profit
Final result:
- 0 ETH is destroyed (excluding destruction on Ethereum)
- The sequencer receives 0.2 ETH
- L1 validators receive 0.8 ETH
Key points:
- L2 blockchain is an extension of the application layer. L2 blockchains allow widely used L1 applications like Uniswap, Blur, OpenSea, etc. to move their transaction activity from L1 to a separate chain that periodically settles its transactions back to L1. Currently, more than 30% of Uniswap comes from L2.
- L2 blockchain supports a more optimized user experience. As an L2, the application can optimize the user experience (transaction fees/MEV collection and rebates, on-chain privacy, etc.) for its use case, such as transactions. These optimizations can be implemented while still maintaining transaction records on the more secure L1.
- The economics of L2 blockchains are driven by two variables: the fees charged by L2 and the cost of settling transactions to L1. The primary business model of L2 blockchains is to generate revenue by reducing the transaction fees paid by users. Profit margins are determined by the cost of settling transactions to L1. For example, users on Optimism have paid a total of $38.2 million in transaction fees since its launch. Of these fees, $28.5 million were used to pay gas fees to submit transactions to Ethereum. Thus, Optimism captures the difference, $9.7 million, as revenue. As competition intensifies, profit margins for L2 blockchains are expected to decline. L2 blockchains that are able to optimize their gas expenditures on Ethereum through data compression and other techniques to further reduce L2 costs may gain market share in the future.
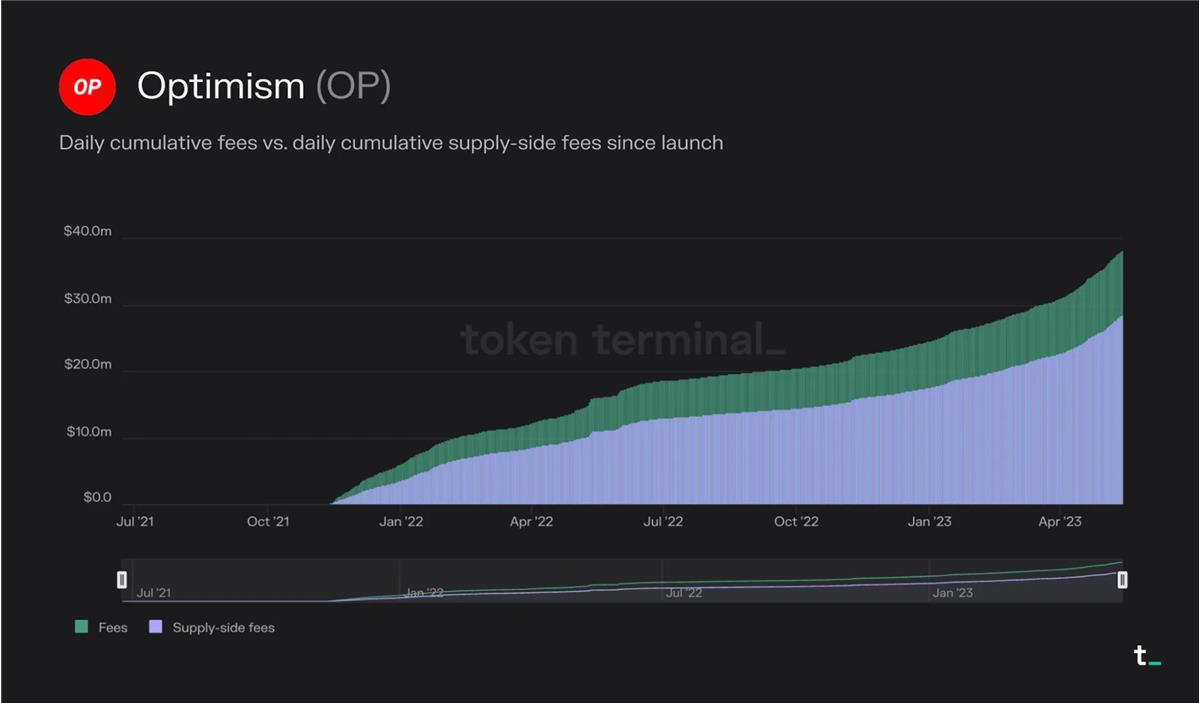
Since its launch on the network, users on Optimism have paid a total of $38.2 million in transaction fees. Of these fees, $28.5 million were used to pay gas fees for transactions submitted to Ethereum.
Conclusion
Blockchain is redefining the infrastructure of economic activity by providing a decentralized, secure, and transparent transaction processing architecture. In rapidly evolving industries like crypto, we see constant innovation in the economic models of these computing platforms. Despite the differences, investors can use the above framework to compare their economic performance, potential, and sustainability.
We will continue to update Blocking; if you have any questions or suggestions, please contact us!
Was this article helpful?
93 out of 132 found this helpful
Related articles
- Understanding SAFT and Web3 Token Financing from the Perspective of Three-Generation Token Models
- Relation Protocol announces its native token REL economic model
- With the rise of the APP Chains, what is its past life, present life and future?
- The ATOM 2.0 white paper is about to be released, can the value capture capability of Cosmos be improved?
- Technical Guide | Teach you how to build a commercial DAO without a bank
- LikeCoin wait 21 days to cancel the delegation? Talk about Cosmos's proof of bound equity BPoS
- Bitcoin Technology Weekly: Statechain, Schnorr signature and BIP322