Bitcoin only rises when 60% of people are losing money
Author: CoinMetrics team and Kevin Lu
Original: CoinMetrics
Compilation: Odaily Planet Daily Qin Xiaofeng
Key points:
- Bill Rothko, member of the Royal Academy of Engineering: Blockchain technology must be integrated with regulation
- Central Bank: Supports Pioneering Pilot Fintech Innovation Supervision Pilot in Beijing
- SheKnows 丨 self-evolution, how does the public chain lead technological innovation?
- After the bubble, only when the price drops to only about 40% of Bitcoin holders have "unrealized gains" will the holders feel the most pain and surrender, and the market can recover.
- The current distribution shows that over time, the concentration of holdings is getting lower and lower, and the costs are getting higher and higher.
The following is the original compilation:
In economic history, financial asset bubbles & collapses often occur, mainly due to deep-rooted cognitive biases in human psychology. In Bitcoin's ten-year history, at least three complete bubble & collapse cycles have been observed.
By estimating the cost-based distribution of investors, we studied the psychological state of investors at six key moments in Bitcoin's history, including its most recent state.
Estimated Cost Basis Distribution
Market value is the valuation of each token at the current price, but "realized capitalization" is different, the latter is the valuation of each token on its last chain transfer.
By hypothesizing, we further expand this concept: an on-chain transfer represents a transaction between a willing buyer and a willing seller, so that the price at the time of the transfer represents the buyer's cost basis.
Therefore, "capitalized" can be considered as the total cost basis for all token holders.
Of course, this assumption is not always true.
Because many times the transfer is not a transaction, such as wallet maintenance, hot and cold wallet transfers, or other reasons that cause the transfer (withdrawing money from the exchange to your own wallet).
Moreover, most transactions are conducted on centralized exchanges. The transactions in which users belong are accounting transactions. There is no need to register on-chain, and no on-chain transfer will occur.
Based on the above reasons, we remind readers to regard "capitalized" as the total cost basis for token holders. This assumption is actually an incomplete estimate of the true value of the token.
However, this assumption is valuable. By estimating the investor's cost basis, we observe two emotions in the asset bubble & collapse cycle-joy (unrealized gain) and pain (unrealized loss), and these two emotions will affect them Investment decisions.
(Odaily Planet Daily Note: "Unrealized gains" refers to investors who have made a profit but did not sell and continue to hold the currency; "Unrealized losses" refers to investors who have lost a book but have not sold and continue to hold currency.
Six key moments in Bitcoin history
By taking a snapshot of the "Estimated Cost Basis Distribution" in the previous market cycle and the current cycle, we study investor psychology.
For each market cycle, three points are selected: the peak of the bubble, the cycle low after the bubble has completely burst, and the adjustment of the middle of the cycle. The following icons highlight these six points:
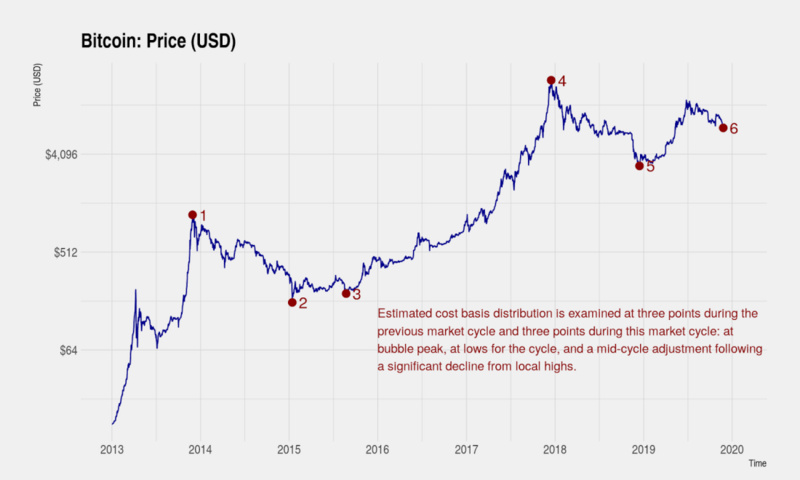
The following table gives a brief description of each moment, and the details will be described later in detail:
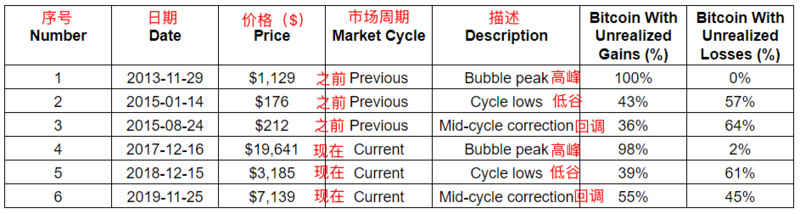
1. Peak of the previous cycle (2013.11.29)
Our first look at the estimated cost basis distribution on November 29, 2013, which was the peak of the previous cycle, and the price rose from approximately $ 100 to $ 1,100 in two months.
Below we introduce a visualization method that includes a snapshot of the estimated cost basis for each bitcoin.
For example, the cost base of nearly 5.5 million bitcoins is between $ 0 and $ 50 (some of which are thought to have been lost forever), nearly 400,000 bitcoins were bought during the peak of the bubble, and the cost basis was between $ 1,100 and Between $ 1,150.
In the snapshot below, the price of bitcoin hit a record high, and 100% of bitcoin holders have "unrealized gains".
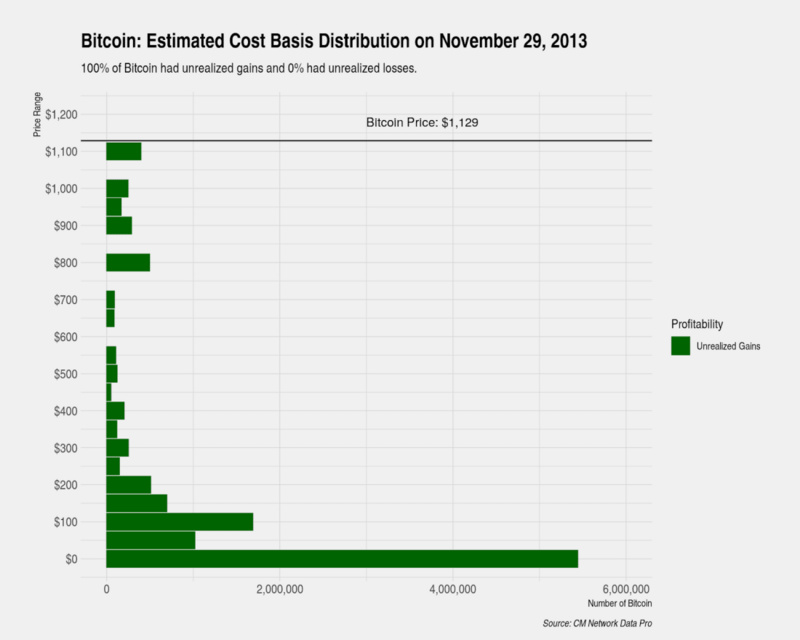
Although the price of Bitcoin has exploded at this stage, Bitcoin's holdings are still concentrated in the hands of early holders. At the time, there were 12 million bitcoins, and about 6.4 million bitcoins had a cost basis between $ 0 and $ 100.
As the price of bitcoin broke the all-time high of $ 200, 100% of the holders of the coin gained. Investor sentiment was very optimistic and did not sell the tokens in their hands. In the price range of US $ 200 to US $ 700, there are few net transfers, and holders continue to wait and see, which also results in limited circulation of Bitcoin.
However, when the price exceeded $ 800, some holders began to sell tokens because they received a 100% return in less than two months and wanted to keep their book proceeds. In the price range of $ 800 to $ 1150, more early holders began to sell their dormant bitcoins, and bitcoin was also transferred from miners to investors. A large number of selling pressures also led to a gradual decline in prices, and eventually this cycle of bubbles began to burst.
2. Low of the previous cycle (2015.1.14)
After peaking on November 29, 2013, Bitcoin fell by 84% in just over a year. In the chart below, we will show the estimated cost basis distribution when Bitcoin price was as low as $ 176 (January 14, 2015). At that time, only 43% of Bitcoin holders had unrealized gains, and 57% of Bitcoin holders had unrealized losses.
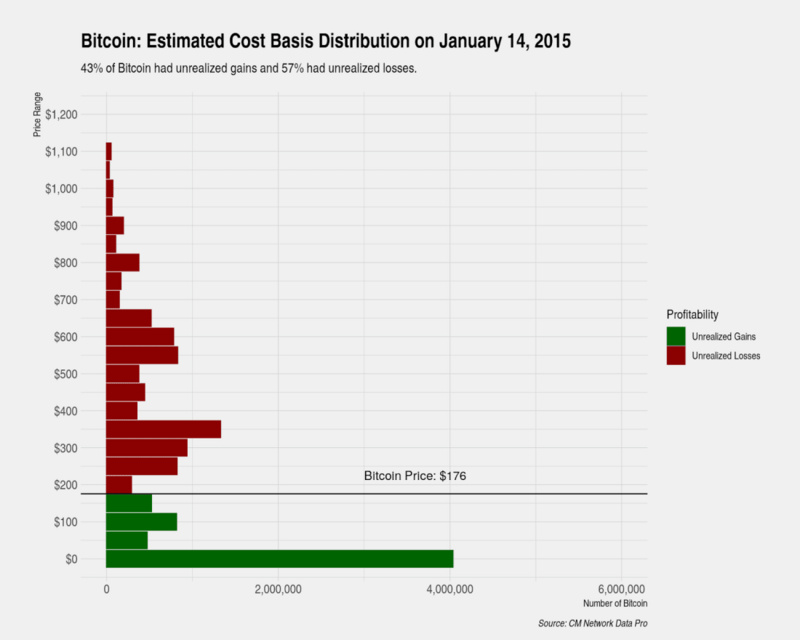
In a little over a year, the shape of the estimated cost base distribution has changed significantly. Contrary to the distribution at the peak of the bubble, holdings above $ 800 were small, and holdings by early holders were also significantly reduced.
Here we introduce another visualization method, which shows the change in cost distribution between two points in time, instead of a snapshot of the cost distribution at one point in time. For example, 1.5 million bitcoins were sold between November 29, 2013 and January 14, 2015. The original price range was between $ 0 and $ 50.
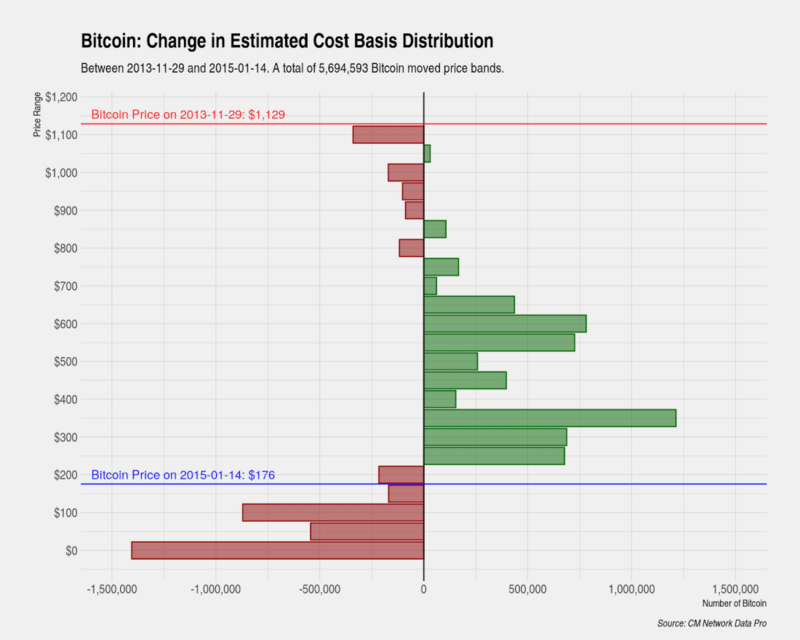
This change in distribution indicates that investors have completely surrendered psychologically, which is necessary for the price to bottom out.
As prices fell, both investors who bought at the peak of the bubble (above $ 800) and a large number of early adopters (under $ 150) reached the most painful level, and the strongest beliefs began. Shaky, at which point they will sell large amounts of existing assets to investors who bought during the downturn.
We also observed that of the 13.7 million bitcoins at that time, a total of 5.7 million bitcoins moved from one price range to another, and the cost of holding coins increased or decreased.
3. Adjustments in the previous cycle (2015.8.24)
Bitcoin price adjustments during the cycle are generally ignored, but we decided to study them. Especially the adjustment in the previous cycle-the price has fallen sharply from a high point, this situation is most similar to the current situation of bitcoin: at the end of November this year, the price of bitcoin dropped from a low of about $ 13,000 in the summer to a low of $ 6500 .
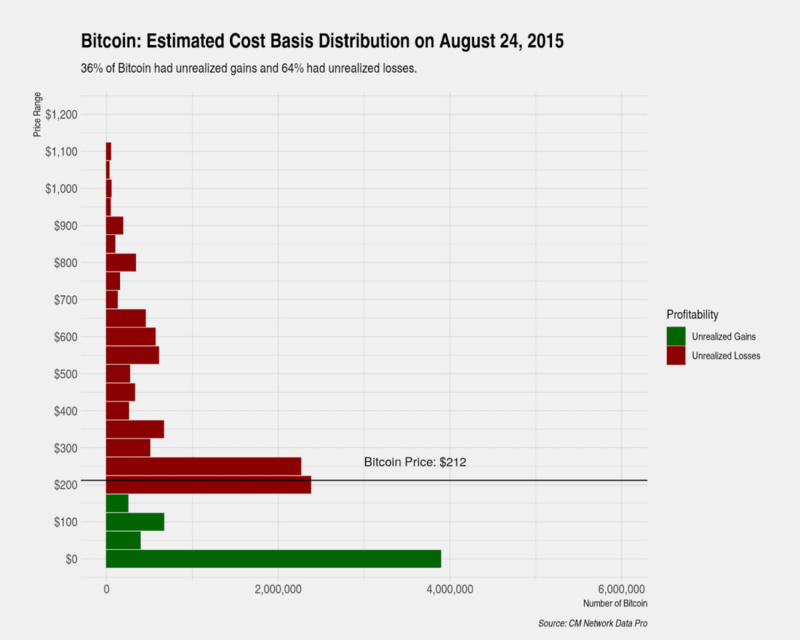
In the previous cycle (November 2013 to January 2015), after the bitcoin price hit a bottom of $ 176, it rose back to around $ 310 in the next few months; then the price was again in the next two months Lane pulled back 35% to $ 200. Here we show a snapshot of the estimated cost base distribution on August 24, 2015, at which point the price has retreated by 35%.
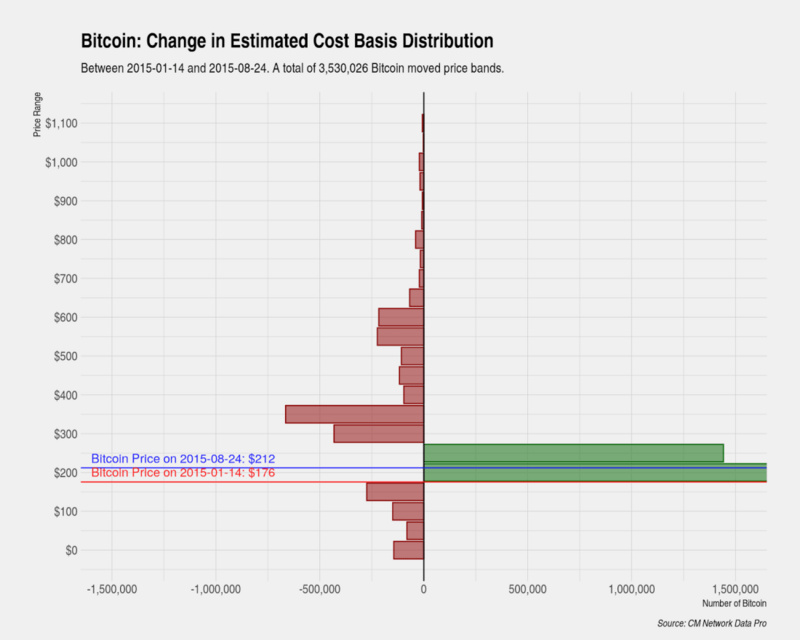
We also show the cycle lows and distribution changes after the adjustment. Over a period of 8 months, we observed a significant change in the distribution. We see that some early holders of less than $ 200 made a small sale, which was much smaller than the cycle low. This also shows that the early currency holders have basically surrendered, even down 35%, and the market's trading volume has not changed much.
Importantly, we see investors selling at the peak of the bubble (above $ 800) selling pressure is essentially zero, which indicates that these investors have also surrendered.
Instead, most of the selling pressure we see comes from investors who buy when prices fall, and investors who buy when prices rise from the bottom. These investors have not reached the most painful level before the price fell sharply.
A study of investor psychology has shown that prices can't really bottom out until all investors reach their point of maximum pain and give up altogether.
After the adjustment of the middle of the cycle was completed, as the psychological state of investors reached the level of "most investors who want to sell have already sold", there was no room for bitcoin prices to fall, and a rebound began.
4. The current cycle peak (2017.12.17)
Over the course of a year, the price of Bitcoin broke its previous high ($ 1100) and reached a peak of nearly $ 20,000 on December 17, 2017.
Below, we will again show a snapshot of the estimated cost base distribution, but unlike before, our interval has grown (from $ 50 to $ 500).
At the time, about 7.4 million of 16.75 million bitcoins were held by early holders and the estimated cost was between $ 0 and $ 100, at which time 98% of bitcoin holders had unrealized gains.
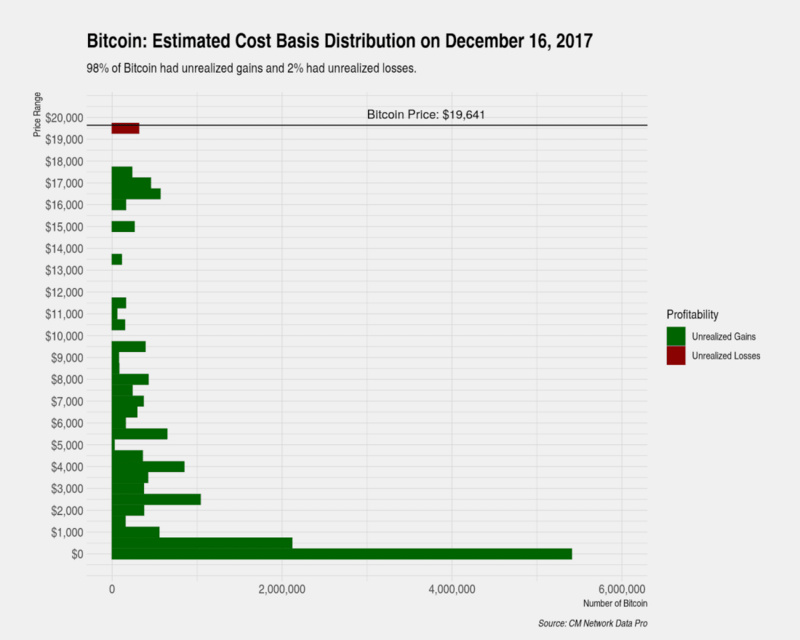
The distribution pattern of this week's peak is similar to that of the previous period, but there are important differences. We can observe that there are a large number of bitcoin transfers with prices between $ 1,000 and $ 7,000, compared to the transfers made at the intermediate price in the previous cycle, which are much lower. This has also led to a slowdown in the rate of price increases in about 8 months, during which several major adjustments occurred.
On the other hand, we see that Bitcoin has almost no transaction transfers in the price range of $ 8,000 to $ 16,000. This is not because of a lack of buying interest, but because the holder does not have a strong incentive to sell.
At the same time, the price of Bitcoin has continued to rise at an extremely rapid rate, rising by $ 8,000 in just two weeks. As the price exceeds $ 16,000, we see an increase in transfers, as high prices once again incentivize early coin holders to sell their long-held bitcoins.
5. Low point of the current cycle (2018.12.15)
The rate and magnitude of the decline in this round of the market cycle is very similar to the previous cycle—both experienced a decline of about 84% and it took about a year to completely eliminate the bubble.
At the low point of the current cycle, 39% of Bitcoin holders had unrealized gains, the size of which was equivalent to 43% of the unrealized gains of the previous cycle.
It also shows that after the bubble, only when the price drops to only about 40% of Bitcoin holders have unrealized gains, the holders will feel the most pain and surrender.
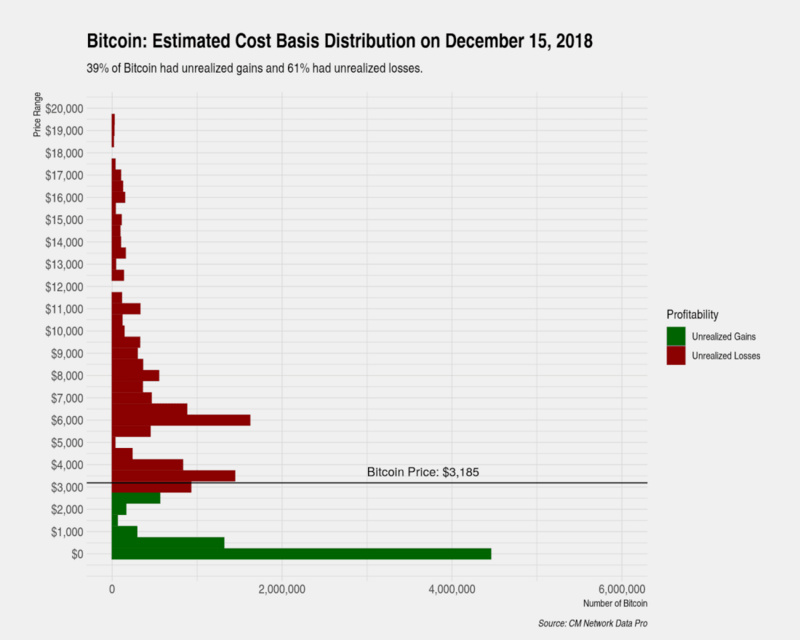
The estimated snapshot of the distribution of the cost basis and the changes in the distribution are also very similar to the previous cycle, which supports the assertion that "the bubble and collapse of Bitcoin (and other financial assets) is driven by deep-rooted cognitive biases" This kind of cognitive bias also causes the cycle to repeat.
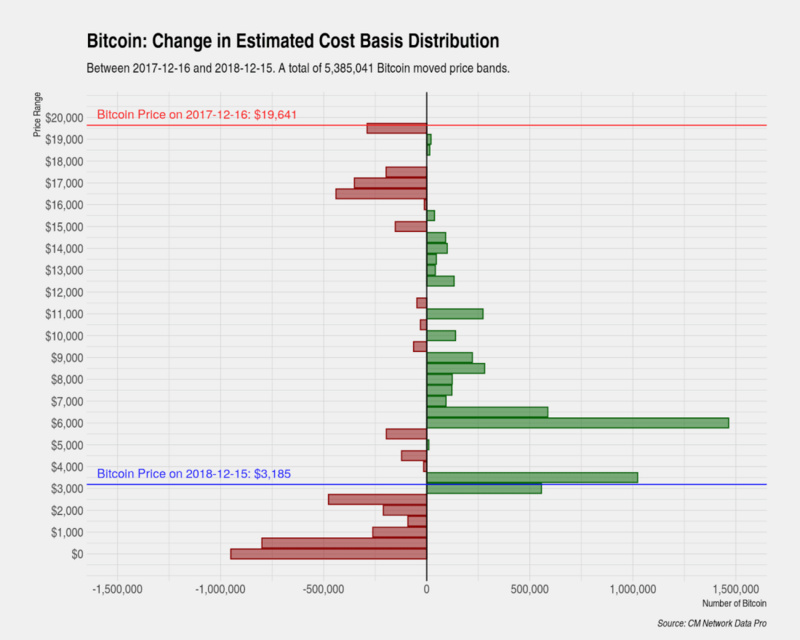
Here we show the distribution between the peak of the bubble and the trough of the current cycle. Similar to the previous cycle, we see that investors who bought near the bubble highs (with a cost base above $ 16,000) and early holders (with a cost base below $ 1,000) have both surrendered and sold off. Investors and early currency holders who bought near the peak of the bubble were the first investors to surrender.
In the last round of declines between $ 6,000 and $ 3,000, as prices fell, investors started to buy, which also meant that the last batch of early currency holders began to surrender.
We also observe that there are very few holders of coins with a cost base above $ 12,000, so it is unlikely that such investors will be a source of selling pressure in the future.
In 2018, a total of 5.4 million bitcoins (currently a total of 17.4 million) changed their holding costs. In addition, we should also consider the factor of interchange of Coinbase wallets-Coinbase transferred its assets to another set of "cold wallets" in early December 2018, with a total of nearly 900,000 bitcoins.
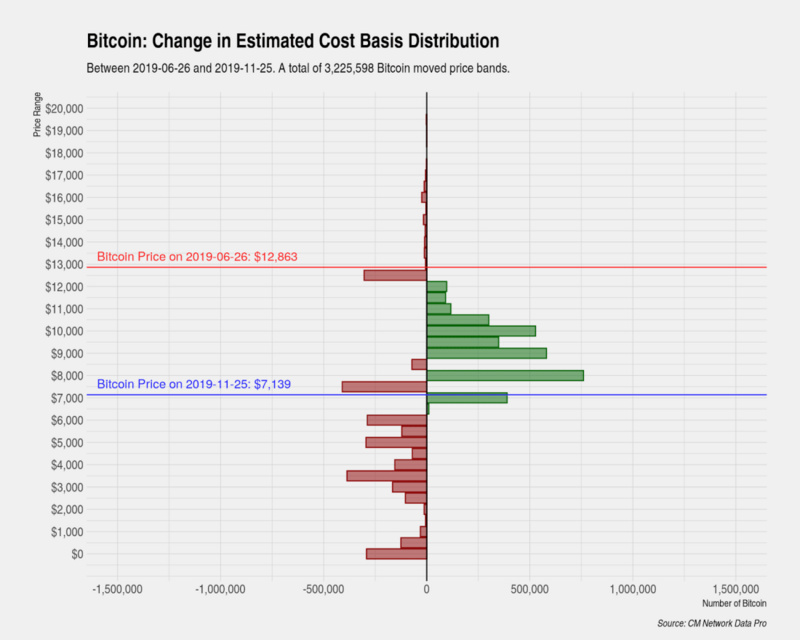
6. Mid-term revision of this cycle (2019.11.25)
The current distribution shows that over time, the concentration of holdings is getting lower and lower, and the costs are getting higher and higher.
At the peak of the bubble, early holders held 7.4 million bitcoins with a cost basis between $ 0 and $ 1,000, and today these holdings have gradually been reduced to 5 million bitcoins.
Regardless of the early holders, the current cost basis of Bitcoin is normally distributed around 8,000 USD, and a significant peak near 3500 USD also coincides with the low point of the current cycle. Consistent with the low point of the current cycle, holdings with cost bases above $ 12,000 are at a very low level, which indicates that this group of coin holders has completely surrendered.
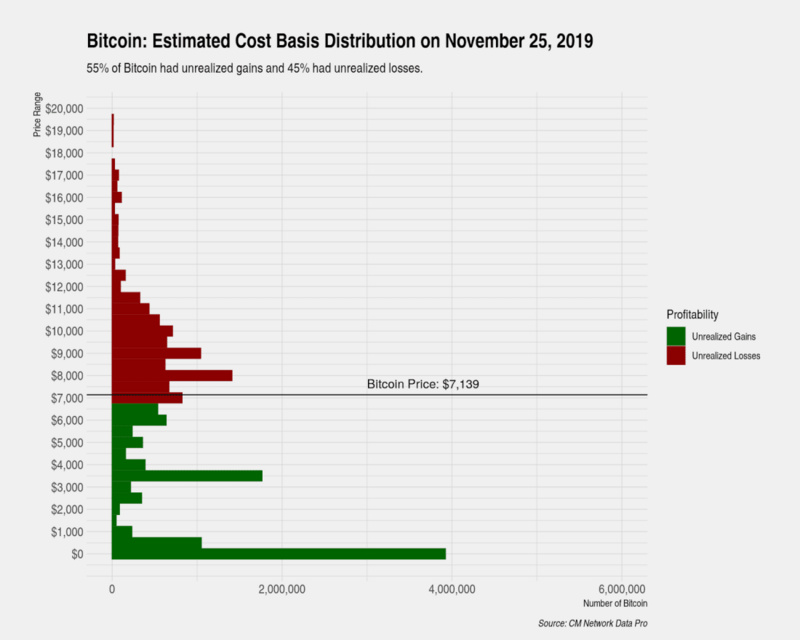
Below we show the distribution changes from June 26, 2019 (the peak of the cyclical pullback of $ 12,863) to November 25, 2019 (the price of the cyclical pullback drops to $ 7,139).
During this time, the decline from the peak to the bottom has been close to 50%. For a bull market, the decline is very large, which has led many observers to worry about the current market.
Analysis of the source of selling pressure shows that investor concerns are justified. Unlike the pullback in the previous cycle (August 2015), the selling pressure in this round of pullback is very high, mainly from the following types of investors:
- Investors who bought at the peak of the pullback and whose cost base is around $ 12,000-12,500 are always big sellers;
- Investors who bought on dips also started to sell a lot, and their cost was between 7500-8000 US dollars;
- Investors who have succeeded in selling the bottom have also sold off in large numbers, and they cost between $ 3,000 and $ 6,000.
Compared with the previous distribution change, the current distribution change is most similar to the cycle of price bottoming. The optimistic explanation is that most investors have surrendered and the selling pressure in the future has decreased.
However, in fact, those who have bottomed out near $ 3,000-6,000 are still profitable, and there will be a lot of selling pressure in the future. Surrenders and sell-offs originally thought to be completed when prices bottomed in December 2018 may actually take more time or the price to fall further.
The number of dormant Bitcoins regularly increases
After reaching an all-time high in May this year, the number of bitcoins in a one-year dormant period (without moving for one year) has been declining.
As of November 31, the number of bitcoins in the one-year dormant period was 3,174,760; in contrast, on May 18, 2019, this number was 4,500,526, a 41% decrease from the previous quarter.
The figure below shows the number of Bitcoins that haven't moved in year X. X varies from 1 month to 5 years.
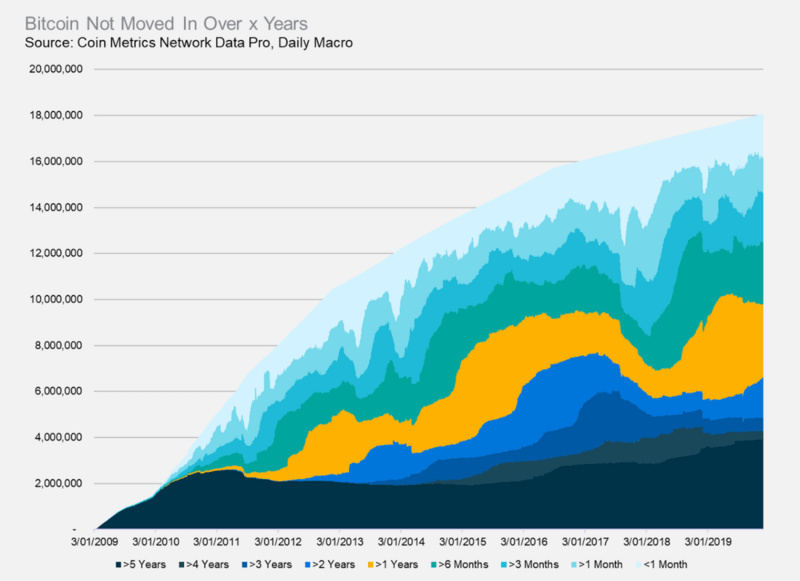
From the figure above, we can also find that those with a dormant period of more than five years and more than two years have been growing in the past year. In addition, those with a dormant period of more than three months and more than six months are also increasing. It shows that some investors are buying on dips and gradually opening positions.
We will continue to update Blocking; if you have any questions or suggestions, please contact us!
Was this article helpful?
93 out of 132 found this helpful
Related articles
- Gao Jian, former executive vice president of China Development Bank: Blockchain is hot, but contains many elements of a future bubble
- The "Internet of Things + Blockchain" market research report has been released. So many companies have already used it?
- Babbitt site 丨 When the “Belt and Road” meets the digital economy and blockchain, watch the representatives of all countries reveal the truth for you
- Ethereum difficulty bomb explodes and dismantles
- Li Lihui, Former President of Bank of China: China may become the first country in the world to launch fiat digital currency
- National University of Singapore Visiting Professor Bai Shihuan: How Singapore Regulates FinTech
- Ethereum Istanbul hard fork soon, major client node upgrade rate is less than 40%