Ethereum difficulty bomb explodes and dismantles
Author: Thomas Jay Rush
Translation & Proofreading: Zeng Yan & A Jian
Source: Ethereum enthusiasts
Whenever the time bomb of Ethereum explodes, there will always be two problems before us. The first question (which can be said to be the more important one) is: "When will the block production become slower, that is simply intolerable." The second question is, "How long should we delay the bomb this time?"
- Li Lihui, Former President of Bank of China: China may become the first country in the world to launch fiat digital currency
- National University of Singapore Visiting Professor Bai Shihuan: How Singapore Regulates FinTech
- Ethereum Istanbul hard fork soon, major client node upgrade rate is less than 40%
In this short article, I propose a trivial and simple answer to the second question. How long should the difficulty bomb be postponed? My suggestion is: "Given the need to perform a hard fork at block height N, postpone the difficulty bomb by N blocks (for added security, it can also be less)."
I do not intend to explain how the difficulty should be calculated in this article. The picture below has appeared in my previous article, which lists the formula for calculating the difficulty.
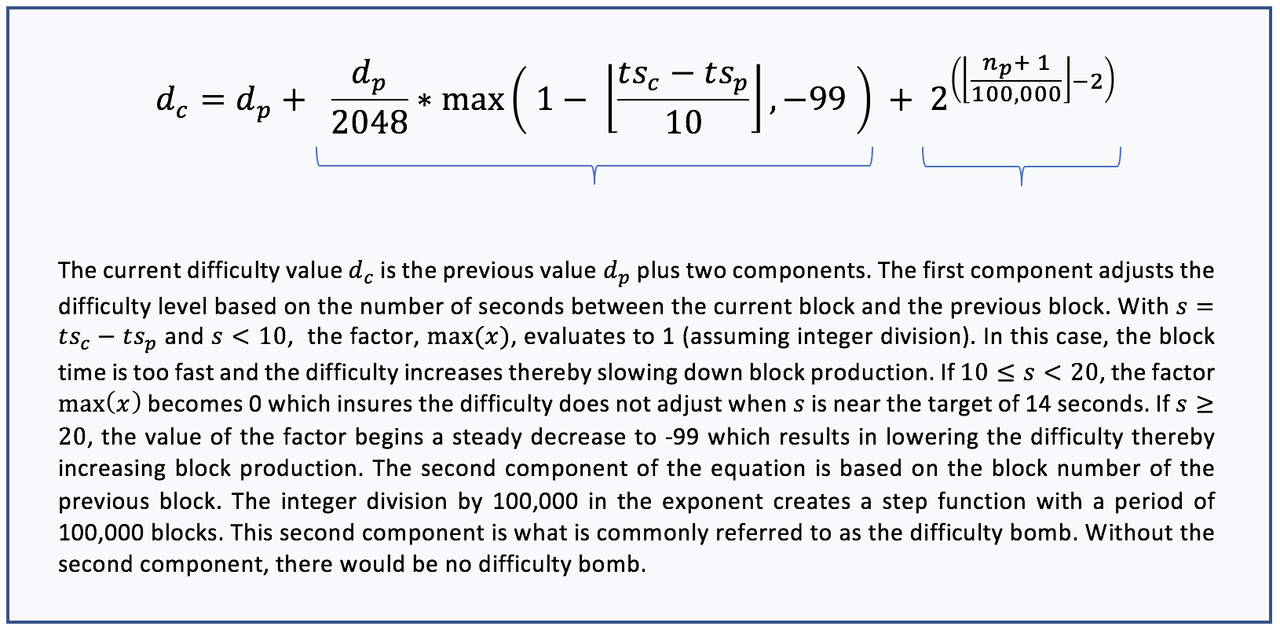
(The text in the figure: The current difficulty value dc is the sum of the previous difficulty value dp and the two parts. The first part adjusts the difficulty level based on the time interval between the current block and the previous block. Let s = tsc- ts, when s <10, the calculation result of the factor max (x) in the above formula is 1 (assuming the use of integer division). In this case, making the block too fast will increase the difficulty and reduce the speed of the block. If 10 <= s <20, the factor max (x) will become 0, ensuring that when s is close to the target time 14 seconds, the difficulty is no longer adjusted. If s> = 20, the value of the factor max (x) will change The stepwise reduction is reduced to -99, which will reduce the difficulty and increase the block production speed. The second part of the equation is based on the block number of the previous block. By dividing 100,000 in the index, a new block is created. 100,000 blocks are the step function of the cycle. The second part is what we often call the difficulty bomb. Without the second part, the difficulty bomb cannot be talked about.)
Look closely at this formula and note that it consists of two parts.
The first part of the formula I call "adjustment" (or part A). This part corrects the deviation of the block production time of the previous block by adjusting the difficulty of the current block. This adjustment either reduces the difficulty or increases the difficulty, depending on the time it took to generate the previous block. The first parenthesis in the image above highlights this part. Please take a moment to figure out how it works. The actual effect of Part A is exactly the same as the design goal. Its role is to calm the impact of the fluctuation of the hash rate on the operation of the network. . From the chart below you can clearly see that the effect of Part A in the calculation formula is exactly as expected.
Because the normal operation of Part A has been designed to eliminate the impact of the hash rate, I don't think it is necessary to consider the actual size of the computing power when thinking about how to delay the time bomb. In other words, too low computing power will not make the difficulty bomb explode longer, and too high computing power will not alleviate the effect of the difficulty bomb. In light of the above analysis, my conclusion is that part A in the formula has nothing to do with the slowing down of block time. The second part of the formula (the B part that caused the bomb) is the culprit for all the trouble.
My subsequent analysis will make you believe that it is entirely possible to separate these two parts. These analyses make it easier to see that part A will not affect the block production, and part B-the bomb-will result in longer block production time. In addition, you will know how easy it is to dismantle the bomb. You just need to reset the period to 0 every time you fork.
Generate data and format
The first step in processing the data is to get the data. We wrote the following code using our software library TrueBlocks:
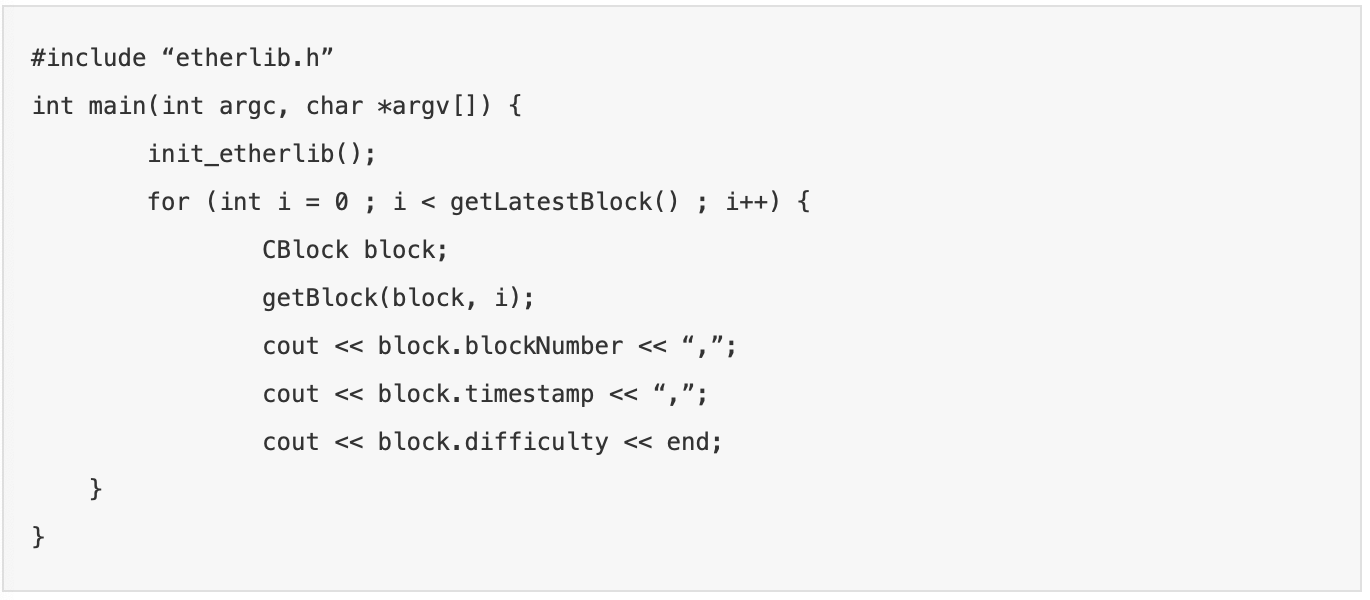
Running the above code can generate the following very simple .csv format data file …
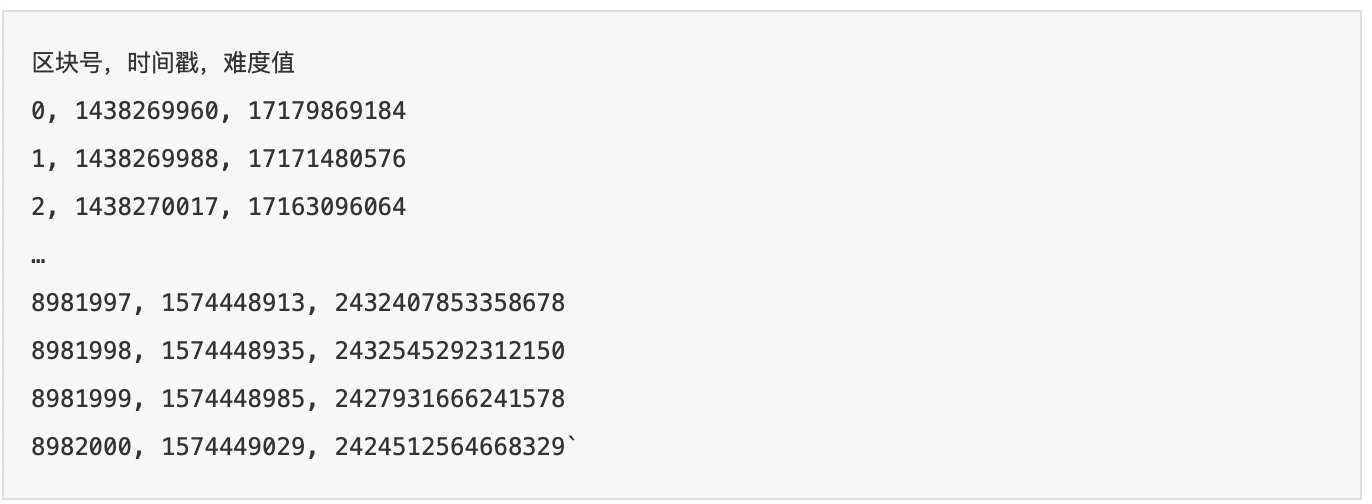
The above data, plus the daily hash rate list obtained from EtherScan, is more than enough for us to understand the difficulty calculation of Ethereum. We used RStudio and a data programming language called "R" to build the diagrams below. If you are not familiar with the "R" language, I strongly recommend that you learn about it, it is a very good programming language.
Let's take a look at the hash rate of Ethereum first.
Daily average hash rate
The first graph shows the daily average hash rate of the Ethereum mainnet, where the data comes from EtherScan. Because I do n’t know how the data was collected and created, I cannot guarantee the authenticity of the data, but I assume it is correct. You can click on this link to view related data .
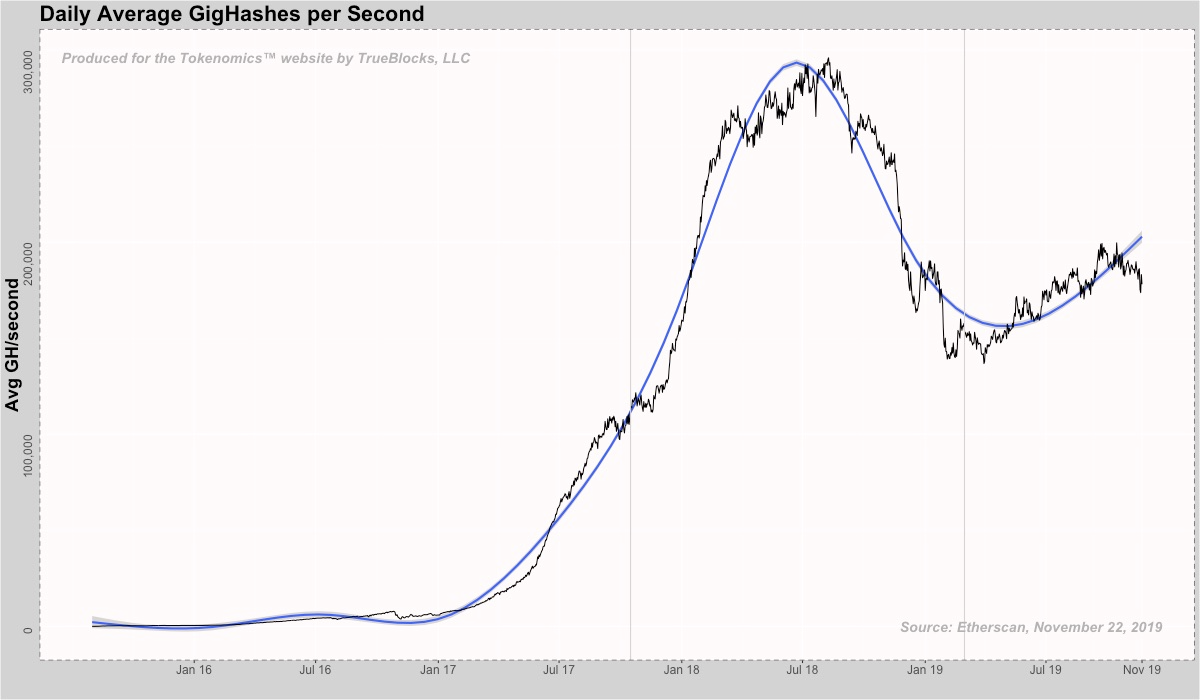
Discussion: It can be clearly seen from the above figure that the hash rate of Ethereum changes as the price of Ethereum fluctuates. This graph reminds me of the price movement of Ethereum. In the summer of 2017, the hash rate soared and reached its peak in the first quarter of 2018 (exactly the same as the price of the coin). The fluctuation of the hash rate in October 2016 was due to the infamous DDos attack at the time. The two gray vertical lines in the figure above represent the two hard forks-the Byzantine hard fork (October 2017) and Constantinople hard fork (January 2019). This picture has been analyzed here for the time being, but we will still mention it when we discuss the difficulty data of the blockchain next.
Raw difficulty data
The first chart based on difficulty data shows the data returned by get_Block through Parity's RPC call. First, here are some standard statistics:
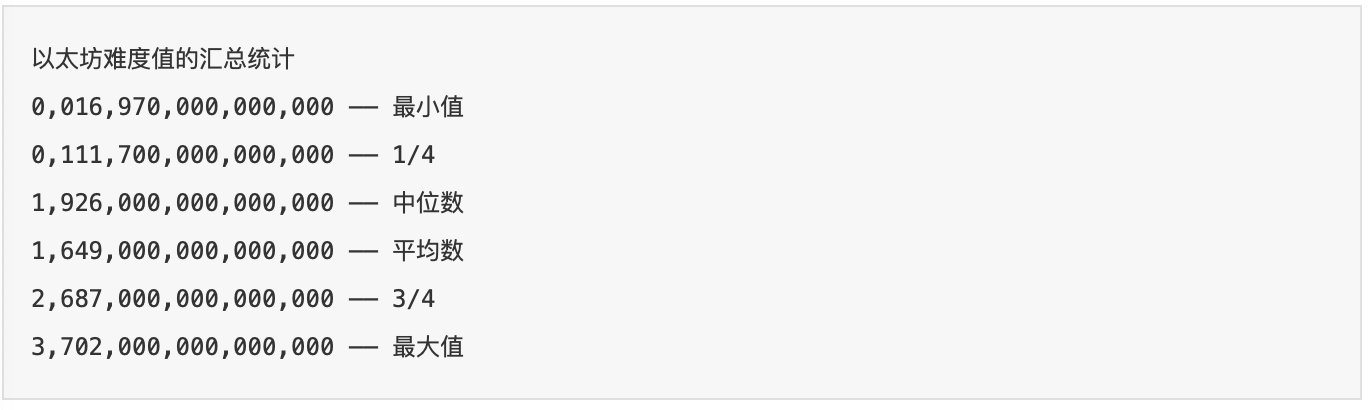
Our first chart is very intuitive:
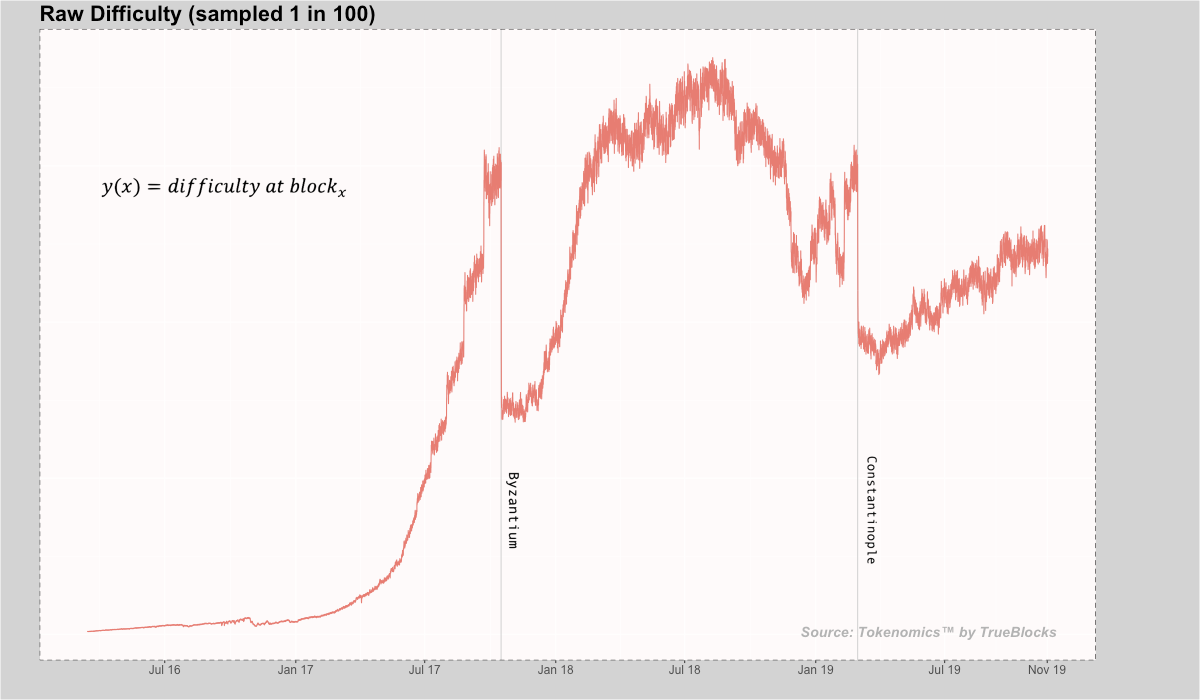
Discussion: The data in the figure above was generated at the 8,920,000th block. Although processing so many data records is easy for the "R" language, considering the iterative nature of data mining, we extracted 1 record from every 100 data as a sample, and finally got about 9,000 records and displayed them on In the figure. Consistent with the previous paragraph, the gray vertical line in the figure above also represents a hard fork.
The height of the red line (y (x) = difficulty at block.x) represents the difficulty value for a given block. You can easily see the effect of removing the difficulty bomb at every fork. Looking back at the hash rate chart in the previous article, you can see the relationship between difficulty and hash rate in the DDos attack in the fall of 2016.
If the difficulty bomb hasn't been removed-in fact, the red line continues to extend upwards from the height at which the difficulty is activated-and you do the same for both hard forks, you'll find that this is surprisingly consistent with a graph of hash rate changes. In other words, the hash rate and difficulty are closely linked, which is very reasonable. Because this is the purpose of the design of Part A in the difficulty calculation formula. It exists to adjust the difficulty value directly based on different hash rates.
Miners' behavior may not change due to the removal of difficulty bombs. Their mining equipment continued to operate before and after the difficulty bomb was removed. The only change is that the average time to produce a block is shorter.
Before we proceed to the analysis of the next chart, there are a few things to note. Take a closer look at the front of the Byzantine hard fork. You will notice that there are 4 or 5 unidirectional vertical jumps on the difficulty level. In fact, each time the difficulty level jumps twice as much as the previous one. These jumps are what we call difficulty bombs. Let's focus on the rest of the chart together.
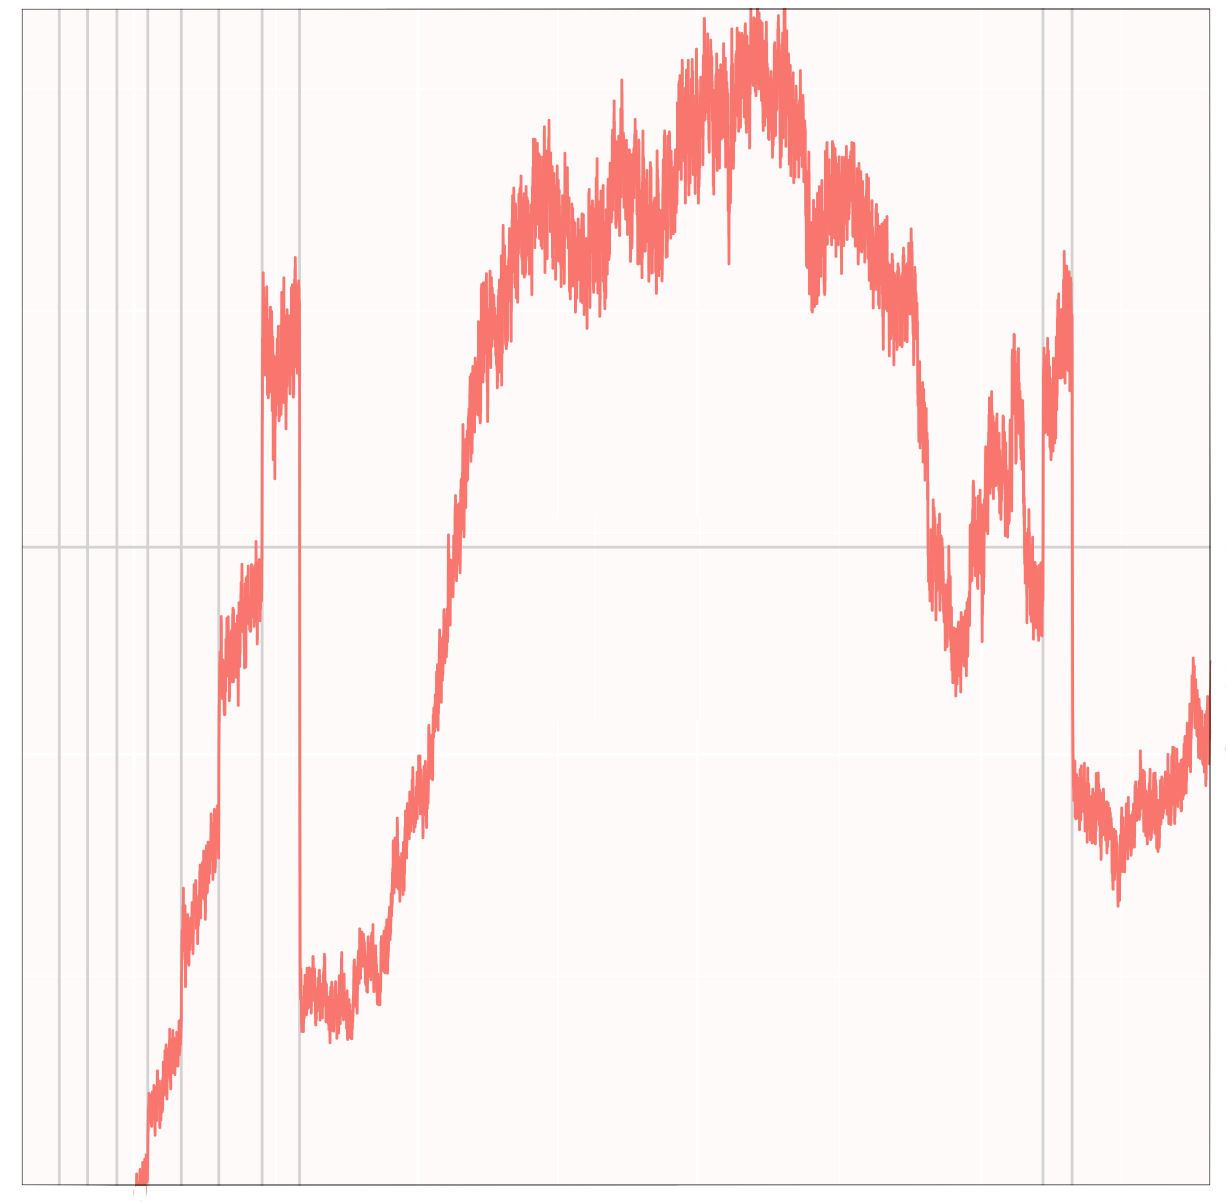
Discussion: We use 100,000 blocks as a group to separate the above picture with a vertical line. Open your eyes wide and look closely. The curve representing the jump in difficulty exactly coincides with the vertical line (divide line) we made. Between these dividers, the difficulty continues to rise, but at a much slower rate than the jumps on the dividers. The explosive increase in difficulty is consistent with the fact that hashrates skyrocketed in 2017.
Maybe you also noticed each successive "explosion"-each time the bomb explodes, the difficulty value increases by twice as much as the previous one. It turns out that the periodicity of these jumps is especially important for understanding what is happening now.
In the rest of this article, our goal is to separate the first part (ie, part A or "adjustment") and the second part (ie, part B or "explosion") of the difficulty calculation formula. This will help us better understand how to deal with future difficulty bombs.
The difficulty of each block changes
In the next chart, let's look at the change in difficulty between each successive block. The formula is y (x) = difficulty value of block x — difficulty value of block x-1 (y (x) = diff_block_x — diff_block_x_minus_1).
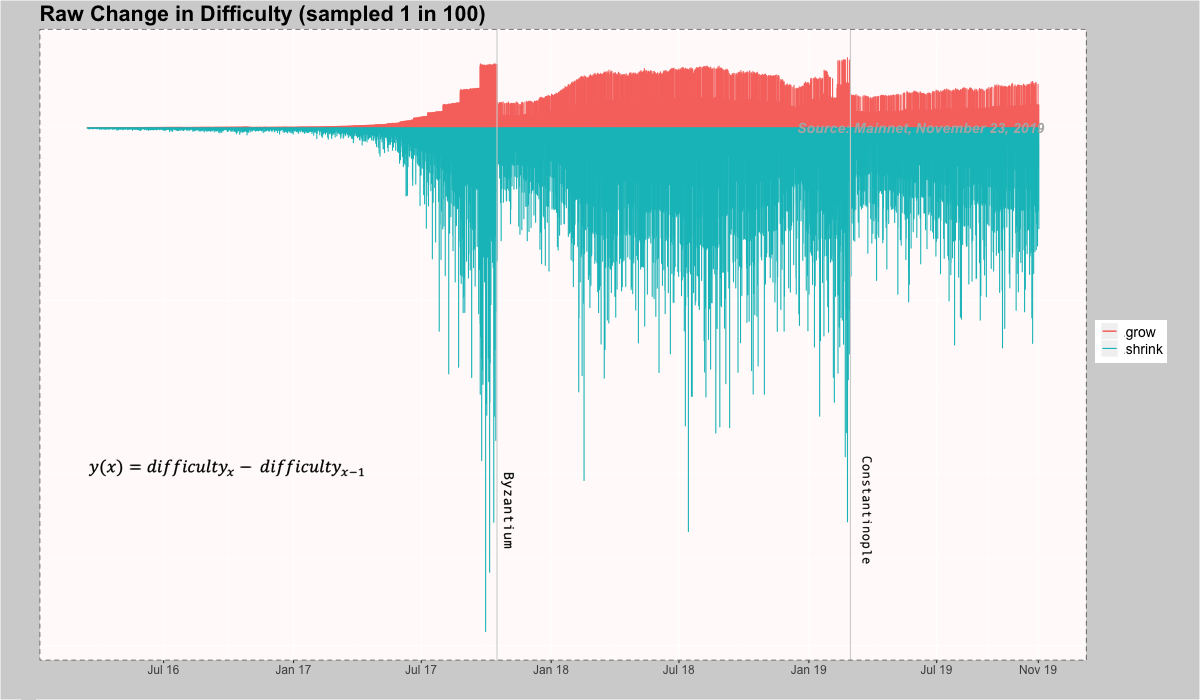
Discussion: As we mentioned above, the calculation of Part A makes the difficulty "wander" around a level to ensure that the block production time is maintained at 14 seconds. The above figure reveals this "hovering" phenomenon by using red and blue to represent the data. The "growth" part (red area) in the figure represents the positive change of difficulty (that is, the difficulty becomes larger, the block output becomes lower, and the block production time becomes slower). The "shrink" part (blue area) in the figure represents a negative change in difficulty (that is, the difficulty becomes lower, the block production speeds up, and the output increases). Difficulty is always "adjusted" around a value of zero. In other words, this part of the calculation is to maintain the stability of the block time, and the calculation of Part A keeps the block time at a stable value-14 seconds.
To you, this picture may be the first time you see a visual representation of a difficulty bomb. Obviously, each explosion is twice as difficult as the previous one.
But in my opinion, the picture is still not clear enough. For example, why the same pattern was not clearly reproduced during Constantinople? In fact, it is because the hash rate has been greatly improved. This part of the calculation can keep the block production time at 14 seconds, but the system's back and forth fluctuations are more severe. This also explains why we can't identify the difficulty bomb near the Constantinople fork because it is obscured by more violent fluctuations.
So, are there any other measures that can make us see more clearly? of course! This approach does exist, and we will reveal it to you in the next chart.
Relative changes in difficulty
The last chart in this part of the article shows the percentage change in difficulty relative to the total difficulty of the block. The formula is y (x) = (Difficulty value of block x — Difficulty value of block x-1) / Difficulty value of block x-1. The previous chart shows the original change in difficulty. This chart shows the change in the difficulty of standardization, which eliminates the impact of the increase in computing power, so we can more clearly see the two different parts of the difficulty calculation formula-Part A and Part B.
Below is a graph of the relative changes in difficulty for each block:
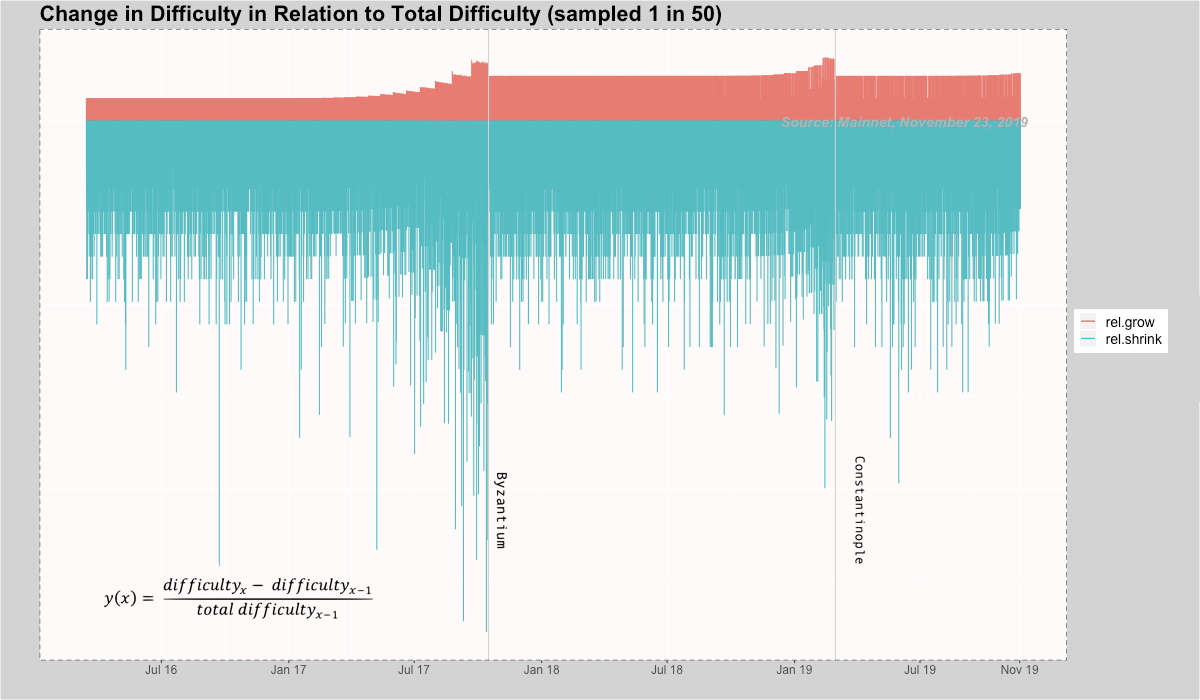
Discuss: Now, you should understand why I said in the previous discussion that worrying about computing power will be counterproductive when discussing difficulty bombs. From this chart, you can clearly see that the block production is not affected by the increase (or decrease) in computing power until the time bomb "rises". Part A of the formula keeps the speed and output of the block in a stable state. Before the time bomb exploded, the difficulty (from the data after averaging and normalization) was hardly affected.
There are two more interesting things to note here: (1) From the picture above, you can also see that the bomb "looks up" on the far right side of the chart, although the distance to look up is higher than that of Byzantium and Constantinople. The distance between them is much shorter-I will explain this phenomenon below; (2) the stripe at the bottom of the graph is formed by the part of the calculation formula A that is divisible by 10; (3) higher ha Heath seems to delay the "look up", as Lane Rettig mentioned before the Constantinople fork, which we also wrote in the article mentioned above.
I still have a lot to share about this picture, maybe I will come back and continue writing someday. But then, I want to provide a better way to remove the bomb in the future.
A better way to remove a bomb
First of all, I want to emphasize again that while worrying about time bombs, I am also worried that fluctuations in computing power will be counterproductive. Part A of the calculation formula has excluded the effect of increasing (or decreasing) computing power. This is exactly the meaning of Part A. The nearly perfect level of difficulty increase (relative to the block height at the time) proves that the work of Part A is almost perfect. Obviously, the hash rate has no effect on the block generation time-but we already know this-this is also the purpose of the difficulty adjustment design.
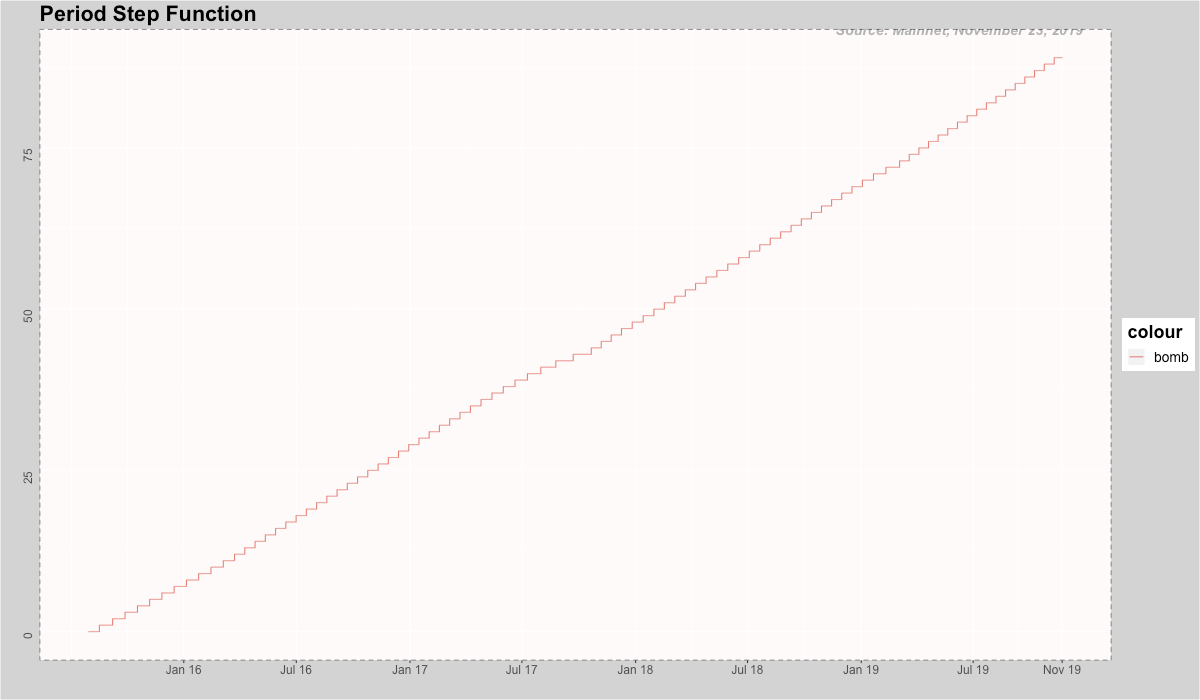
The bomb is defined by an additional added value at the end of the above formula:
2 ^ (floor (current block number / 100,000)-2)
(Translator's Note: floor (x) is a round-down function , that is, the largest integer not greater than x, such as floor (3.14) = 3)
The above formula is a power function with a base of 2. Let p = floor (current block number / 100,000), we can rewrite the above formula to 2p. (You might be wondering, is the -2 at the end of the formula eaten up? No, we just ignore it for the time being, because its role is to make the calculated value smaller.) In the end, we get a step p Long step function.
Keep in mind, however, that the core developers have reset the bomb twice-that's right, literally "reset", they reset the starting point of the bomb calculation cycle. This is achieved by using Go code to create a dummy block for use in calculations. For the moment, pseudoblocks seem to have reset bombs in the past. The corrected chart below shows the real situation during this period.

The above figure shows the real block number in red, and its value range is 0 to 8,920,000. The pseudoblock number (shown in green) initially coincided with the real block number in red, until the Byzantine fork occurred, and the pseudoblock number was reset to the past 3,000,000 blocks. Then, the pseudo-block number grew in parallel with the real block number until the Constantinople fork, and the pseudo-block number was reset again (this time it was reset by 5,000,000 blocks).
The following table lists some information after the reset. Do you find anything strange?
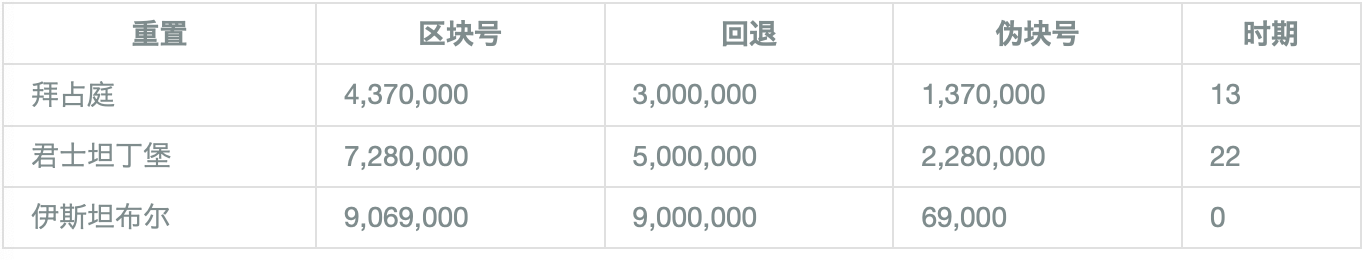
The number of pseudoblocks after the Byzantium fork is 1,370,000. Dividing this value by 100,000 gives us a period of 13. In other words, after the hash rate adjustment, the difficulty of each block has increased by 213. By the time of the Constantinople hard fork, the pseudo-block number was reset to 2,280,000, which means that the period changed to 22, which meant that the difficulty of each block increased by an additional 222. I think that's why the time bomb exploded earlier than we expected. Because we did not roll back far enough the last time we reset it.
The recommended value for resetting the time bomb this time is to roll back 69,000 blocks, making the period zero. This is the correct amount to reset.
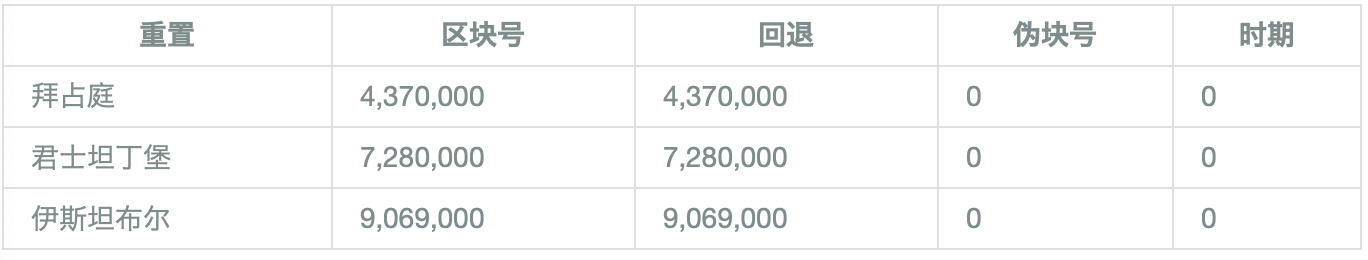
How to better reset the timed difficulty bomb
Whenever we have to reset a time bomb, there is a very simple and easy way to reset it to the correct value. In this way, most problems related to difficulty bombs will no longer exist. Just simply set the number of blocks to roll back when resetting the difficulty bomb to the same as the forked FORK_BLOCK_NUMBER (forked block number) (or adjust it slightly). In this way, the dummy block number will be set close to 0, and the period will also become 0.
Since the slowdown in block production speed is mainly due to the existence of time bombs, the "head-up" effect will become completely predictable in the above manner. The calculation of Part B depends entirely on the pseudo-block number. If we did this when the Constantinople fork (as shown in the table below), the time bomb would not explode so fast.
in conclusion
Thank you so much for reading here. I hope this article will catch the attention of those interested in difficulty bombs. I see that many people are confused about the difficulty calculation problem (not just the general public, but also the core developers and Ethereum Magicians). In my opinion, people think too complicated.
The following is a brief summary of this article: (1) The exponential nature of Part B makes it only relevant to the speed of block production; (2) Part A in the calculation formula will not have a harmful effect on the production of blocks, instead, it actually Played a positive role; (3) resetting the period or pseudo-block to 0 has two benefits: (a) allows the time bomb to be delayed as much as possible, and (b) makes the bomb's reproduction very predictable.
If you have any opinions about this article, please let me know. I hope I have helped you understand what I am familiar with.
(Finish)
This article has been translated and republished with permission from EthFans.
We will continue to update Blocking; if you have any questions or suggestions, please contact us!
Was this article helpful?
93 out of 132 found this helpful
Related articles
- Commercial banks explore the way "blockchain +"
- Smartphone TEE: Booster for DC / EP offline applications of central bank digital currencies
- Can Bitcoin use the MimbleWimble protocol? That's what Pieter Wuille and Charlie Lee say
- Featured | Messari Founder: Recent Frustrations and Hopes in the Industry; Innovations in the Bitcoin Technology Stack
- Bakkt CEO secures U.S. Senate seat, may help cryptocurrency promotion
- Science | An article to understand the innovation in the Bitcoin technology stack over the years
- Babbitt live 丨 Zhang Laiwu: In the era of digital economy, digital currency and the sixth industry are the main battlefields of blockchain applications