Market Analysis: BTC trend is entangled, it is difficult to drive emotions
Yesterday we observed a change in XRP and ETH, BTC appeared a little follow, but did not expect BNB to rise again. At present, BNB is only a stone's throw from the highest point in history. Will this break through the highest point? Everyone knows that the cause of this round of the market is the model currency invented by the currency. Although the model currency issued by many small exchanges has been broken, it does not hinder the profit-making effect of the big exchanges. Perhaps only the leading market of this round has broken the historical high point. Other currencies will be more enthusiastic. You can look at the price of the target in your hand in January of 18, and certainly not as strong as the leader, but there is still a certain amount of it. Hope, the new high is imminent, let us wait quietly.
BTC
The current futures contract price maintains a premium to the spot price, which is not significant. Let us take the trading volume of fire coins as an example. In the 1-hour K-line chart, we can see that BTC has formed a channel-shaped finishing channel, but we have seen that a new high volume is shrinking. This is not a very good phenomenon. We need to closely observe the direction of the flag. If the flag is drawn from above, it needs to be balanced to make the breakthrough effective. Next, we must test the pressure of the high of $5,407. If the flag is down, it will weaken again. Will return to the support of 5,150 US dollars, if the point is broken, the lower trend line may fall.

ETH
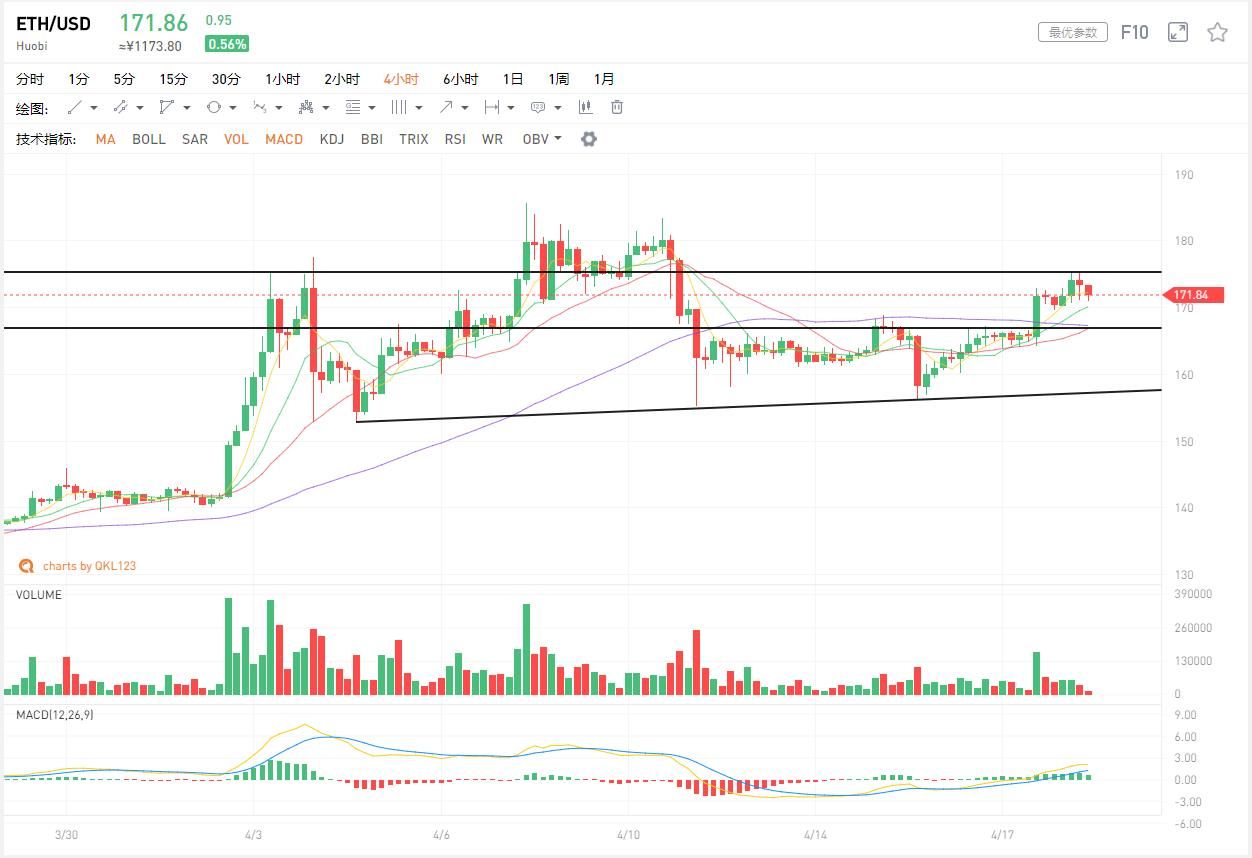
After yesterday's pull, ETH has already pulled to the top of the big Yinxian line and re-ranked all the moving averages. The current moving average has not yet chosen the divergence direction. The macd indicator has not yet been crossed, and the 5-day average line and the 10-average line continue to keep down. run. As can be seen from the time-sharing chart, the trend is a bit like a small-scale head and shoulders. The neckline of the head and shoulders is around $175. If the volume is above this level, the market is bullish, paying attention to the pressure of $185.6. The mid-term target is still around $230. If the defensive falls below $165 again, the market will weaken and bearish to the range of $143-150.
- During the wet season, the miners’ spring is back?
- Will BSV reproduce the BCC zero-zero operation?
- Replace the SWIFT system? I understand the blockchain cross-border settlement system
XRP
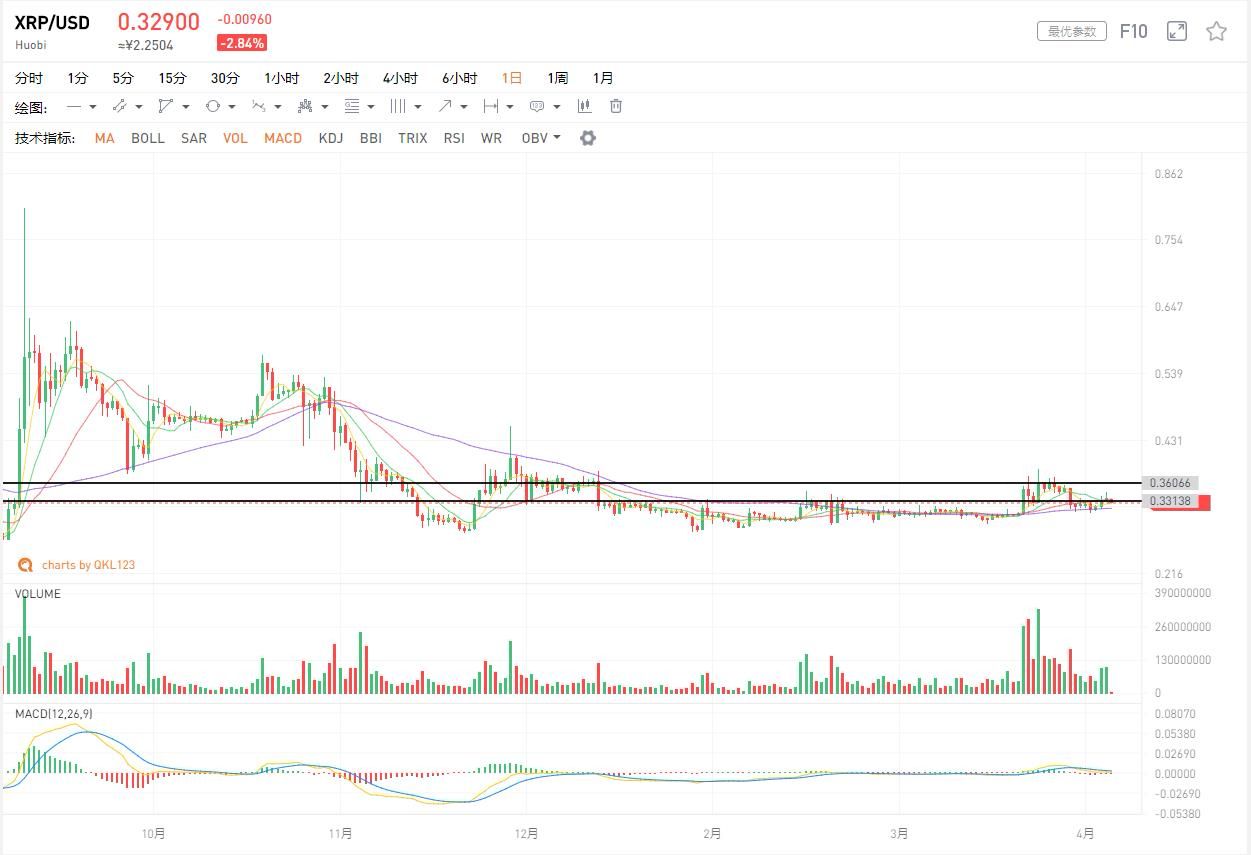
The trend has not been strong, and there has been a slight increase in signs. However, the amount is not good enough, and the lack of the wind, coupled with the strong pull of BNB, led to the closure of the standard, and it will take some time for the dragon to become a leader. . There is a support of 0.33 US dollars below the target, and the pressure is 0.355 US dollars above. It is currently consolidating, waiting for 5 antennas and 10 antennas to turn around, paying attention to whether the follow-up volume can continue to enlarge, or hope to become a leader, after all, the funds inside Everyone knows the strength, once again fell below $0.33 to lighten up, and penetrated the $0.3 chip-intensive exchange area to wait and see.
BCH
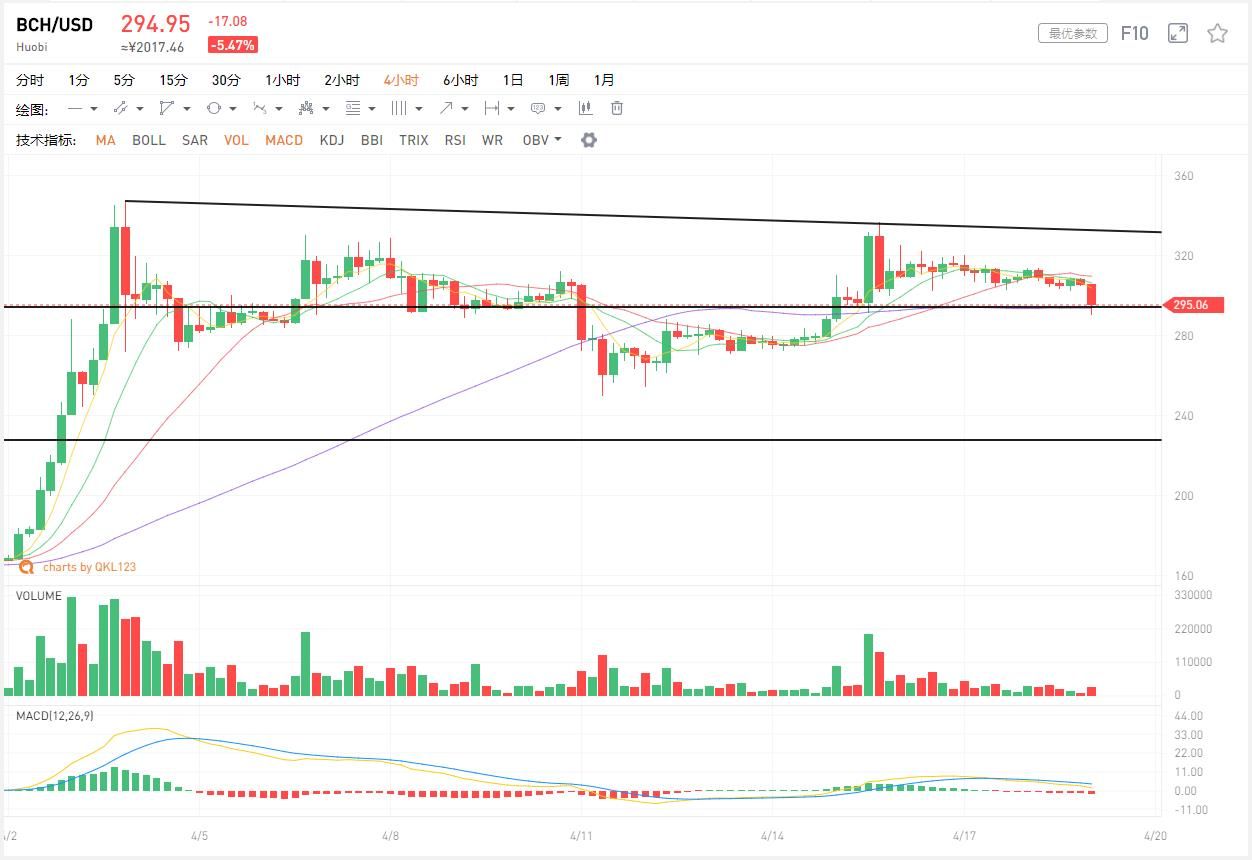
BCH shrinking shock consolidation, that is, after the support of BSV, BM and Sun Yuchen, V God also expressed support for the BSV. BSV's Auburn Cong has become a target of public criticism. We need to pay close attention to the incident and will not further Fermentation. In the short term, the trend of BCH is not optimistic. If it is good, it will not break through the high point of 346.5 US dollars. It is more difficult to organize an effective attack. The 5 antenna and 10 antenna gold forks upward, and the macd indicator forms the trend of the duck opening mouth. There is a suspicion of accelerating the decline. At present, the target may be a triangle-level finishing of the daily line or a flag-like finishing. Pay attention to the support of the 5 antennas. The 5 antennas may fall back to step 227 dollars. I believe that this point has strong support, can be low-sucking here, the medium-term target still looks at 430 US dollars, but broke 227 US dollars, the market is over, leaving the market to wait and see.
LTC
From the daily chart, we can clearly see that LTC fell and increased its volume. It is very difficult to rebound from such a trend. The top selling pressure is large, the moving average is tangled, and the macd is down. Keeping in a strong area above the zero axis, the target may use shock to digest the recent profitable disk; from the 4-hour K-line chart, the LTC has gone out of the triangle, but it is not oriented. The choice is a bit like a box volatility. The top of the box is around $85 and the bottom is around $75. If the volume breaks above $85, it is bullish to $100, and the bottom of the box is down to $62.

EOS
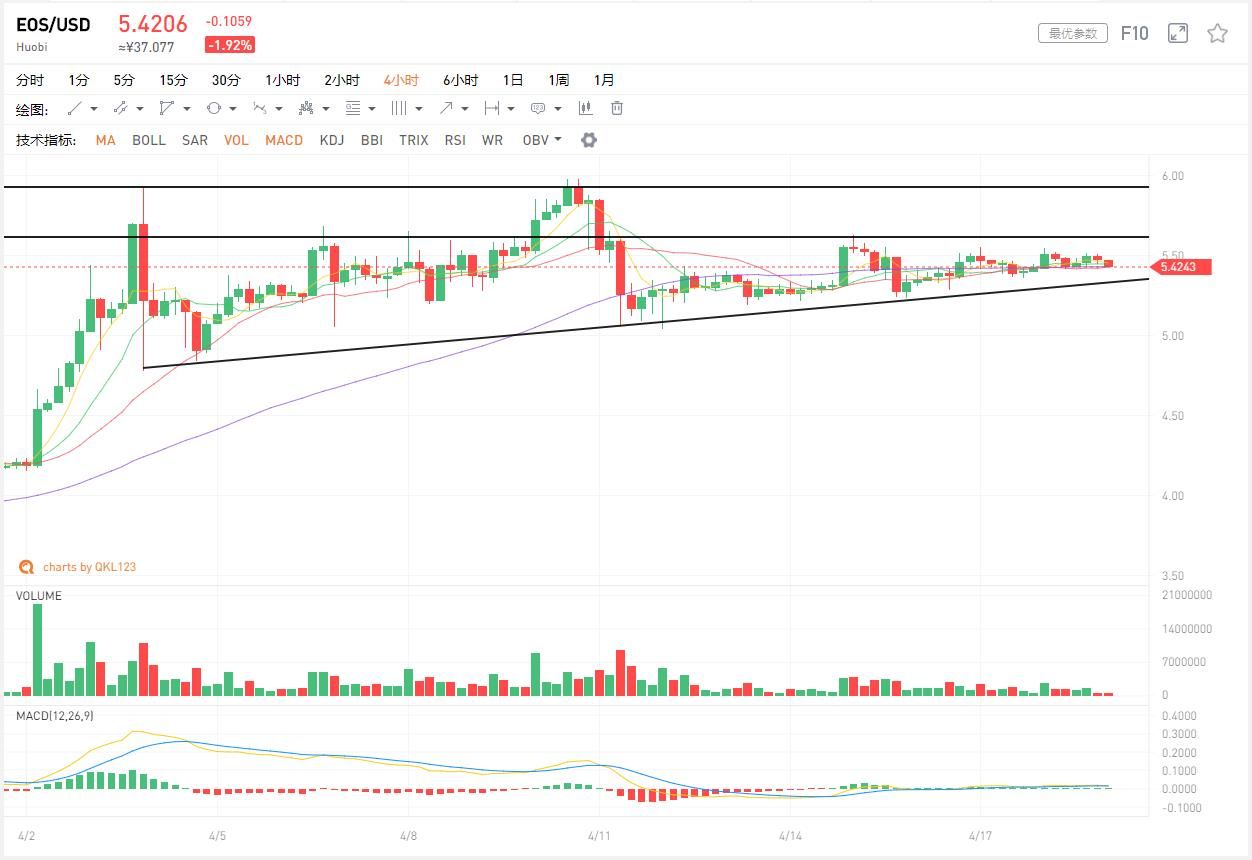
The trend of EOS in recent days is almost a straight line, 5 antennas and 10 antennas have been leveled, and the macd indicator continues to run downwards. From the perspective of time-sharing, the target is more like a small-level head and shoulders trend. The volume of the right shoulder has shrunk severely and has not yet fallen below the neckline. The neckline is the uptrend line below. If this position is to attack 5.9 USD, it needs to be replenished to pass, and once again, the support of 5 USD is supported. The probability will fall below, so it is still based on the risk. The rate of killing below 5 US dollars will be very fast. If you kill it below 4.4 US dollars, you can low-slow, effectively fall below the market, wait and see, and the volume will exceed 5.9 US dollars. The bearish is ineffective and is bullish to $6.8.
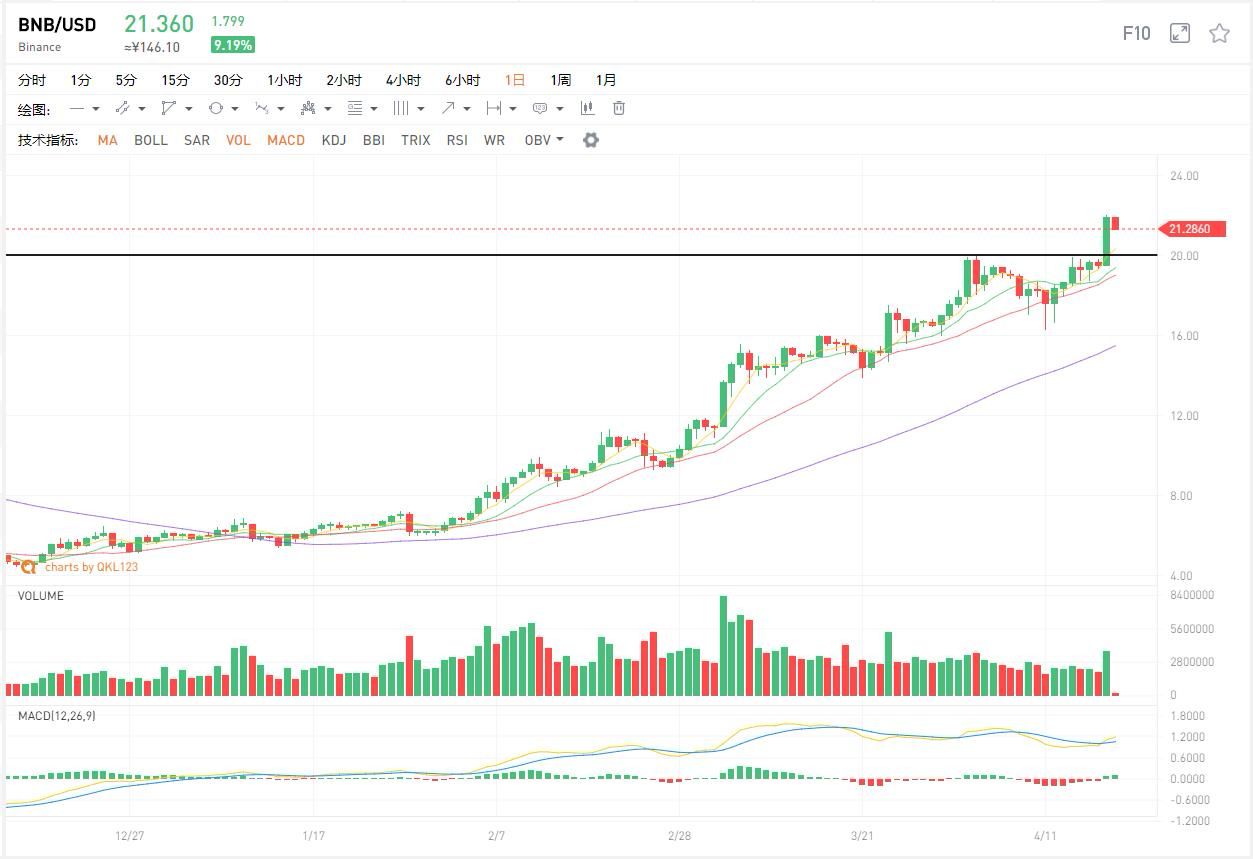
BNB
After a few days of announcement, it was only after a few days of promotion. The main force is really a good one. At present, the target is less than 20% of the historical peak of $25.18. Since it is close at hand, we think the target is It may be an opportunity to break through this high point, hit a new high, and play a momentum. The breakthrough of the target may have positive significance for the market, but we think that the target is currently only suitable as an observation target. After all, the increase is too large. In addition, the recent fire coins announced the repurchase of HT, but we saw that HT was only followed by a small amount, and there was no skyrocketing.
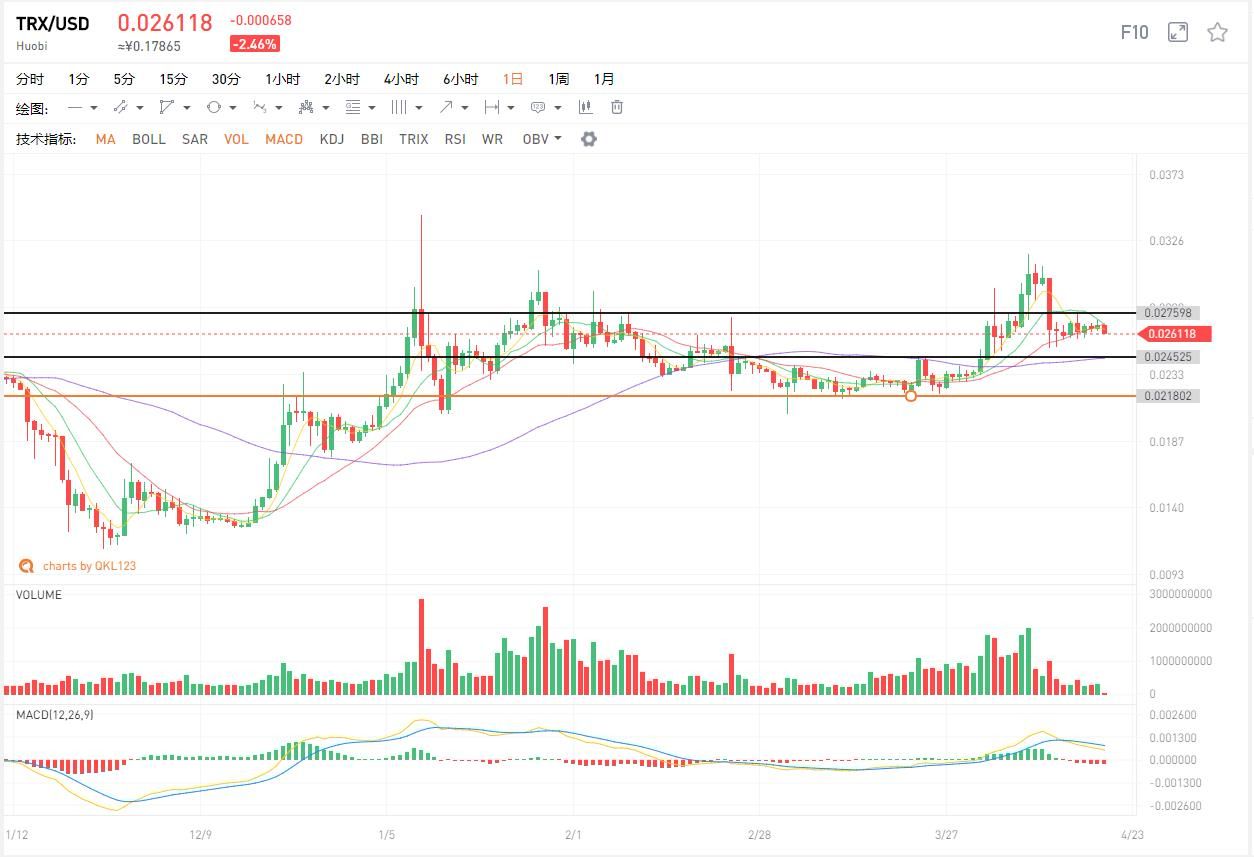
TRX
After TRX has broken the neckline position, it has not yet reversed the neckline position. It may follow the pressure of the upward test neckline position in the market. The volume breakout can actively do more, but it does not rule out the trend of taking an ABC, that is, there is still a C wave. The slump demand exists, can be low in the range of 0.02-0.024 US dollars, effectively fell below 0.02 US dollars to leave.
This article data source: QKL123
The author's point of view is only used for learning communication, not as an investment recommendation, and does not constitute an investment basis!
Author: talk on gold coins
We will continue to update Blocking; if you have any questions or suggestions, please contact us!
Was this article helpful?
93 out of 132 found this helpful
Related articles
- The game of the exchange after the BCHSV "belowed"
- Out of the 996 Dilemma: Property Rights, Pass and Productivity
- Hong Kong stock company "Ke Di Agriculture" terminates blockchain cooperation, and the partner "Ba Ping Tianxia" is suspected of pyramid schemes
- Polkadot innovates the Staking economy under the NPoS consensus
- Gu Yanxi: The near-term and long-term value of Bitcoin derivatives trading services
- Market Analysis: Short-term risk in BCH
- The mysterious miner dug up 1.8 million BTCs, is it Nakamoto?