QKL123 market analysis | USDT premium rate hits record high, red signal or dip signal? (0317)
Abstract: The broader market rebounded after a downtrend yesterday. The USDT premium rate started to fall today after hitting a new high recently. The rapid rise in the USDT premium rate is affected by both the supply-side liquidity limitation and the demand-side capital inflow, but it will gradually decline as the market stabilizes.
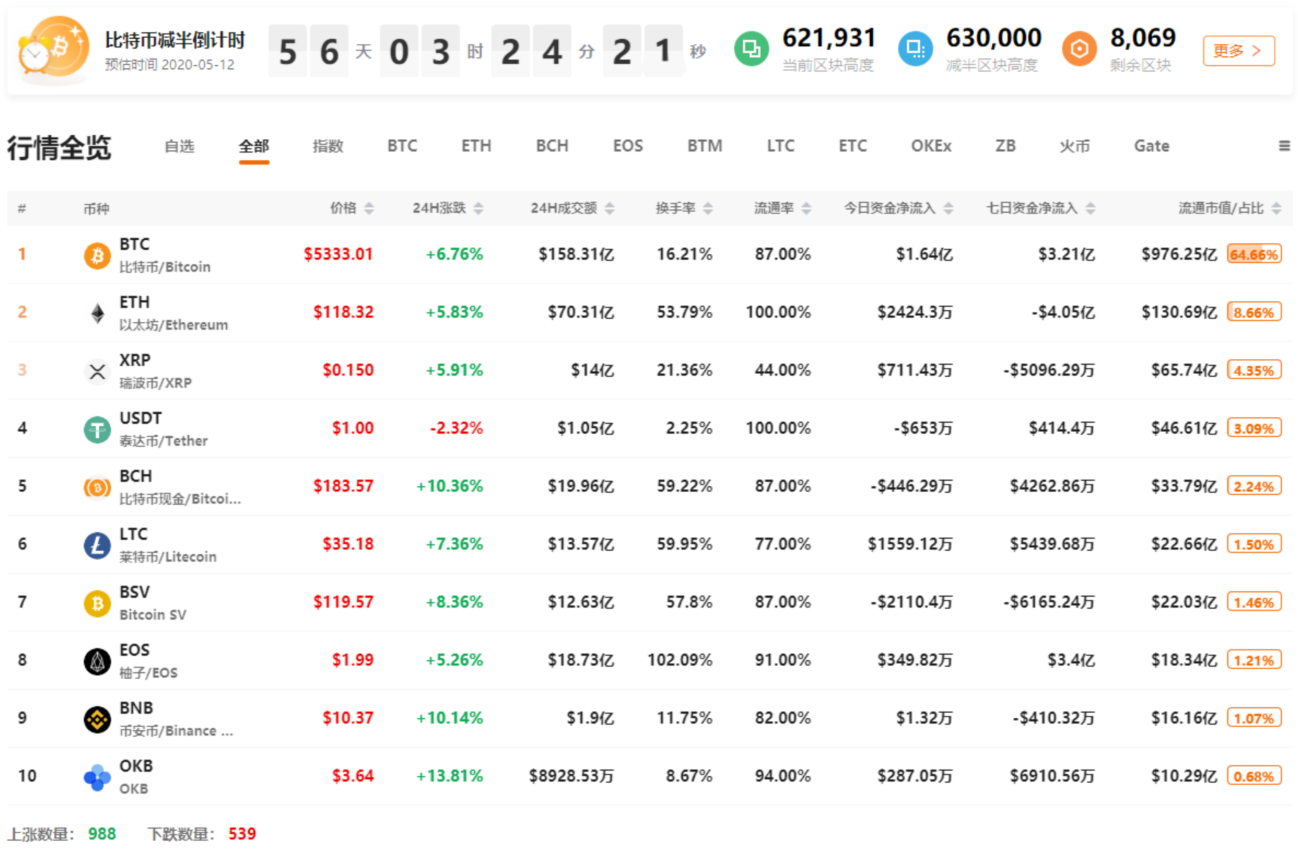
At 16:00 today, the 8BTCCI broad market index was reported at 7713.40 points, with a 24-hour rise or fall of + 10.08%, reflecting a sharp rebound in the broad market; total turnover was 152.755 billion yuan, a 24-hour change of + 25.67%, and market activity increased significantly. Bitcoin strength index was reported at 93.70 points, with a 24-hour rise or fall of + 0.55%. The relative performance of altcoin in the entire market has become stronger; the Alternative sentiment index is 8 (previous value 9), and the market sentiment is expressed as extreme fear; ChaiNext USDT The over-the-counter discount premium index was reported at 103.92, with a 24-hour rise or fall of -2.44%, and the USDT over-the-counter premium level significantly decreased.
Analyst perspective:
- In-depth analysis of the Asian Exchange TACU, how to stay strong in extreme markets
- Tim Draper: When the world recovers, it will be Bitcoin that will save the world
- Perspectives | MOV-Cracking the Impossible Triangle of Trading
Similar to traditional financial markets, the crypto asset market is mainly denominated in US dollars. But the difference is that due to regulatory restrictions, the entry and exit of funds in the crypto asset market include direct entry and exit of fiat currencies and indirect entry and exit of stablecoins. However, most of the existing large trading platforms do not support the direct deposit of legal currencies such as the US dollar, which makes the stable dollar anchored as the main fund transfer interface. According to QKL123 data, the current market value of stablecoins is about $ 6.5 billion. Among them, USDT accounts for more than 80% of the stablecoin market share, USDC market value accounts for nearly 10%, and the remaining stablecoin market value accounts for less than 10%.
Recently, the USDT over-the-counter discount premium index reached a new high, and it recorded a high of 105.98 yesterday (a premium rate of 5.98%). Moreover, yesterday's Huobi and OKEx's over-the-counter USDT premium rate reached a maximum of 8.32%, which meant that there was a serious imbalance in the supply and demand of USDT. Although there has been a significant decline, stablecoins such as USDT still clearly deviate from the value of the anchor. This extreme performance of the USDT price is affected by both supply and demand.

On the supply side, the total supply of USDT has not decreased in the near future and is still increasing. And in the past week, the market circulation of stablecoins such as USDT has increased significantly (the cumulative increase is more than 350 million), which has caused some pressure on the price of USDT. However, this cannot rule out the possibility of high premium due to insufficient liquidity. Under the panic and panic selling, the market began to seek stablecoins to avoid risks, which will lock a lot of USDT in a short time and greatly reduce the USDT liquidity.
On the demand side, bitcoin and other crypto assets have fallen to a low point in the past two years, and a large amount of off-market “bottom-sweeping” funds have poured in through stablecoins in a short period of time, further pushing up the USDT price. Of course, there are some different views in the market, including long positions, hedging on trading platforms, etc., all of which may contribute to the USDT premium rate.
First, the spot BTC market

Yesterday, BTC linked U.S. stocks to test, rebounded to a minimum of $ 4,400, during which there was a significant amount of heavy volume, currently standing in the shock area of the previous few days. Judging from the current performance of the global capital market, bitcoin may be affected by the two-way impact of the US stock market linkage and the depreciation of the US dollar in the near future, and it is more likely that it will continue to fluctuate widely.
Second, the spot ETH market
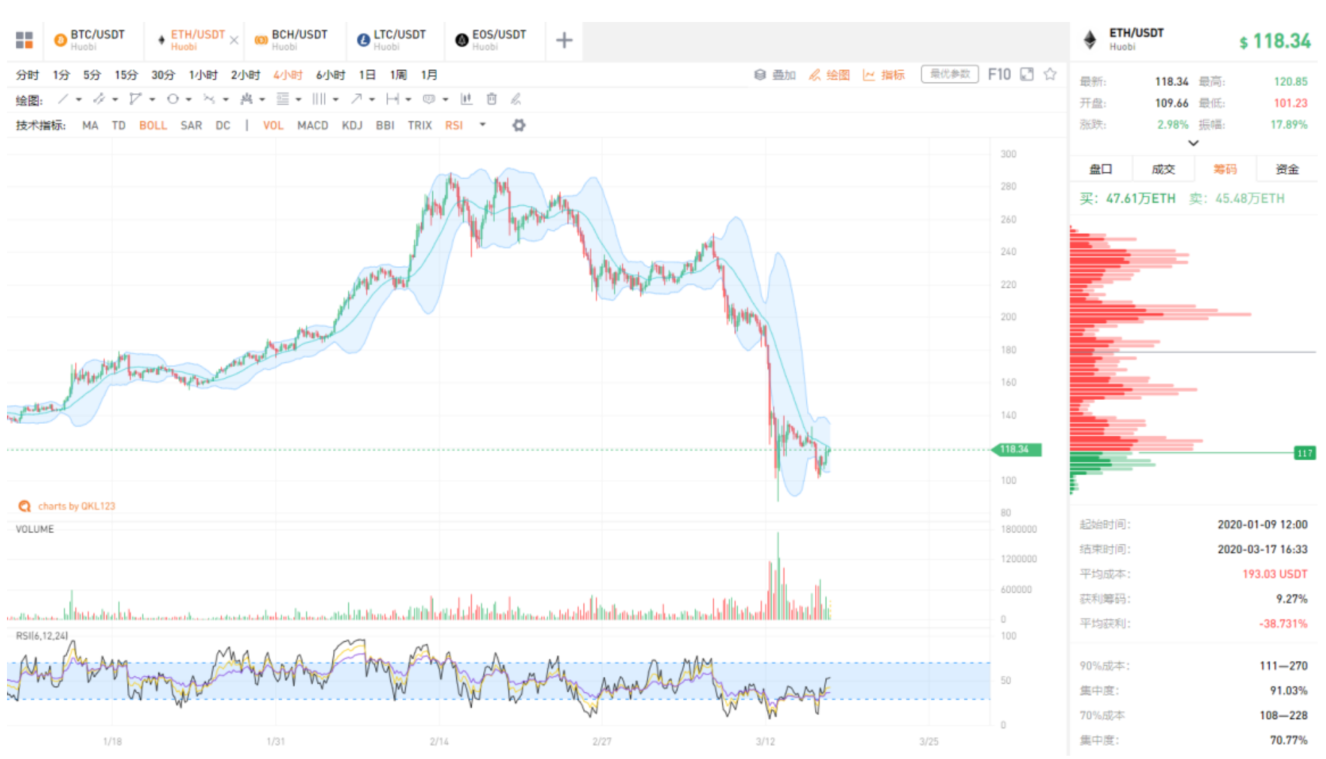
The ETH linkage shock is currently near the 120-dollar chip concentration area and is still under test pressure, indicating that there are differences in market funds and waiting for BTC to stand firm.
Third, the spot BCH market
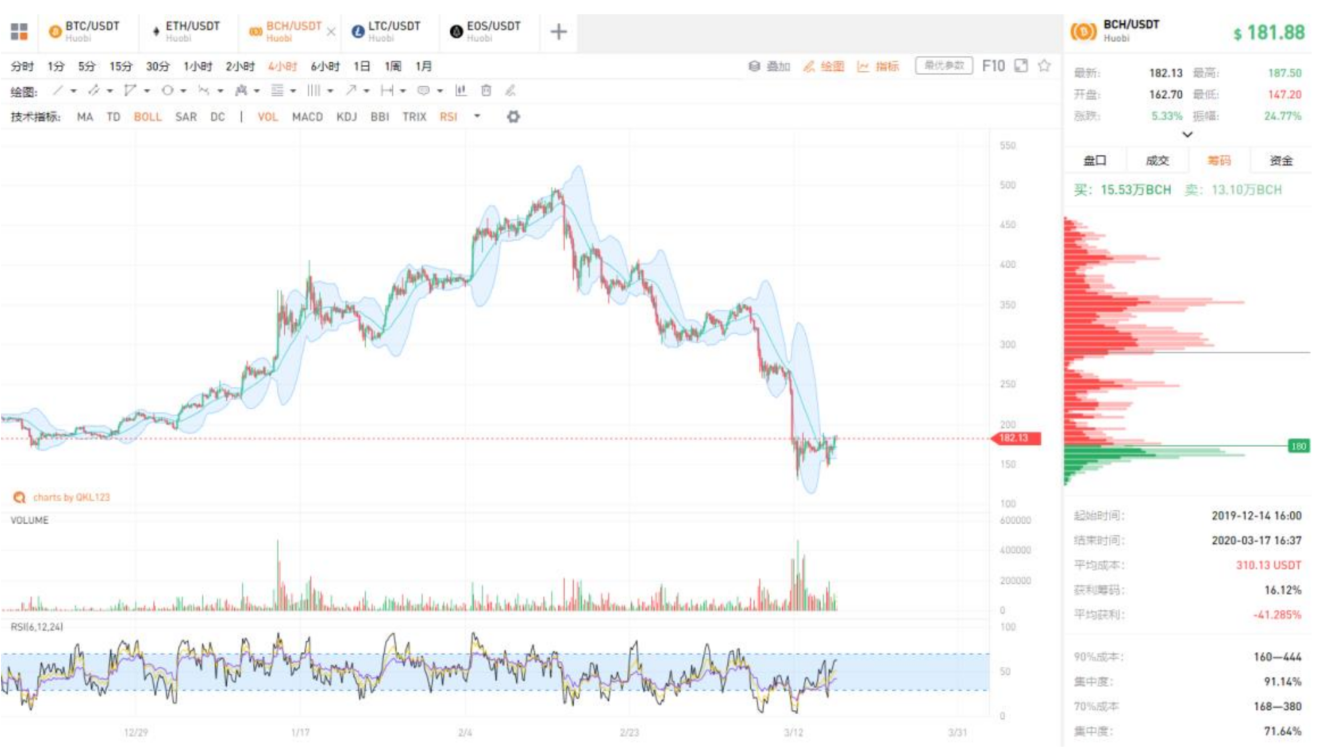
BCH linked BTC, and its performance is stronger than ETH. Currently it stands on the chip concentration area of about 176 US dollars, but the amount can shrink. Pay attention to the resistance near 190 US dollars above.
Fourth, the spot LTC market
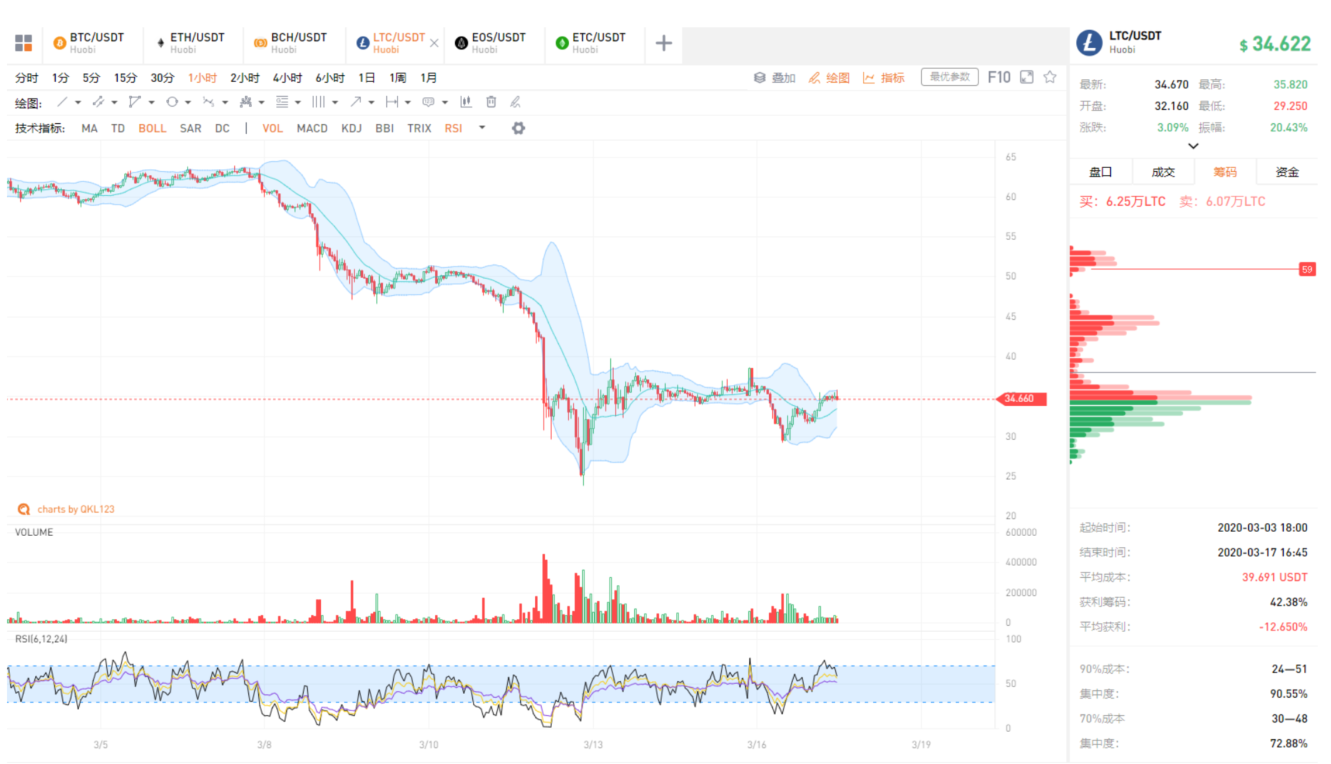
LTC stabilized and rebounded near 29 US dollars, similar to ETH, and near the chip concentration area of about 35 US dollars, indicating that the market funds are not consistent in their long reaction, and the short-term uncertainty is large.
V. Spot EOS Quotes
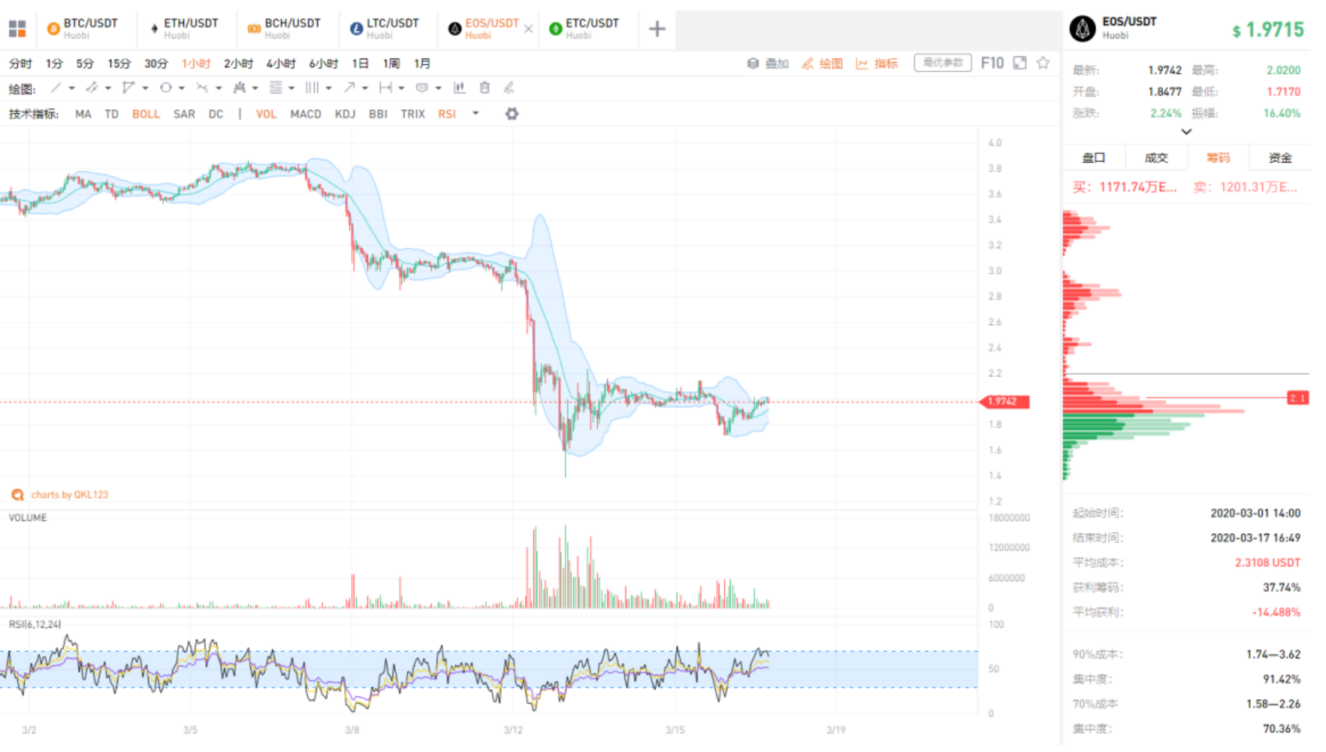
EOS rebounded to the $ 2 chip concentration area, which has not yet stood still, and is testing the nearby pressure.
Six, spot ETC market
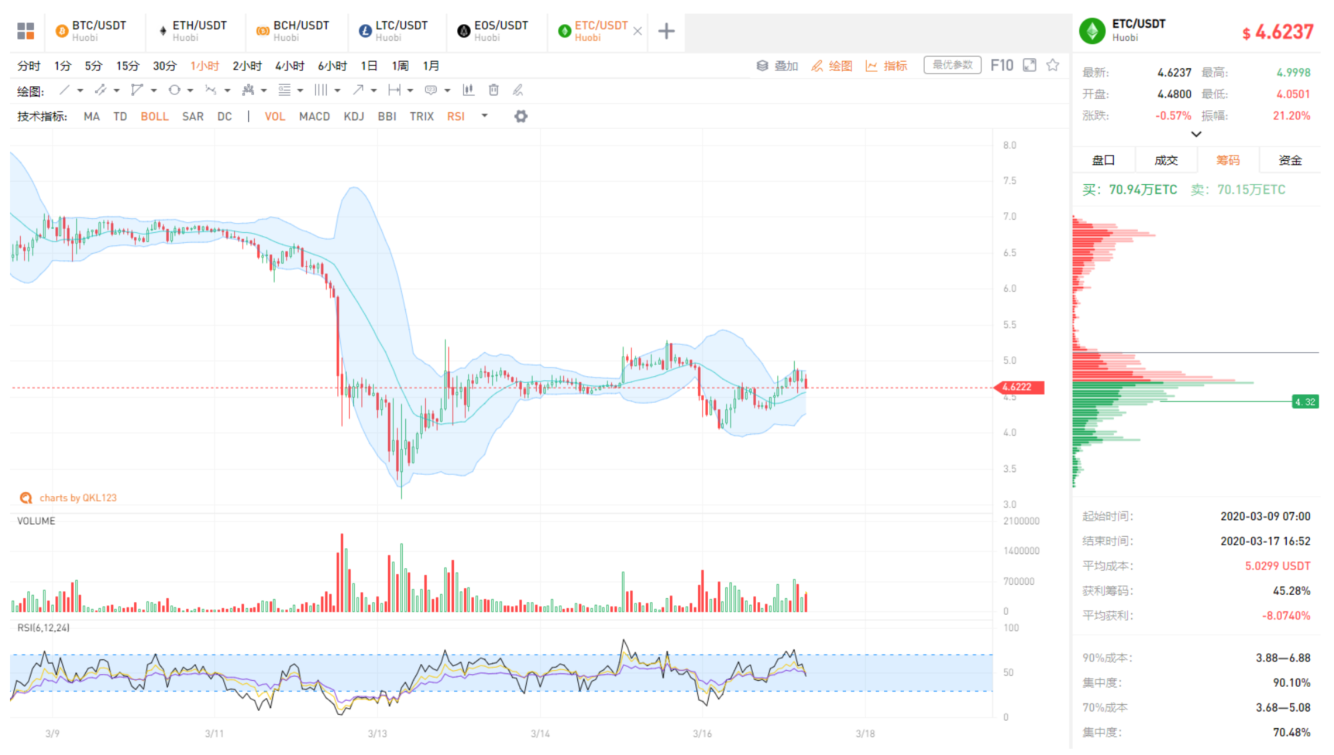
ETC rebounded from a small amount of USD 4 yesterday, and completed the second block reward reduction today. It was accompanied by a slight rebound for a short time, but then fell back. Short-term shocks around 4.6 US dollars, mainly linked to BTC.
Analyst strategy
1. Long line (1-3 years)
Although the long-term trend of BTC is bad, but the price is not far from the bottom, it is a good time for Tun Coin to invest. You can refer to the coin storage indicator. The smart contract platform leader ETH, altcoin leader LTC, DPoS leader EOS, BTC fork currency leader BCH, and ETH fork currency leader ETC can be configured on dips.
2. Midline (January to March)
Affected by the financial environment, panic persists, and there is a possibility that Bitcoin will continue to bottom out, and those with small positions will be involved in batches.
3. Short-term (1-3 days)
Wide shock, wait and see.
Appendix: Interpretation of Indicators
1. 8BTCCI broad market index
The 8BTCCI broad market index is composed of the most representative tokens with large scale and good liquidity in the existing global market of the blockchain to comprehensively reflect the price performance of the entire blockchain token market.
2.Bitcoin Strength Index
The Bitcoin Strength Index (BTCX) reflects the exchange rate of Bitcoin in the entire Token market, and then reflects the strength of Bitcoin in the market. The larger the BTCX index, the stronger the performance of Bitcoin in the Token market.
3.Alternative mood index
The Fear & Greed Index reflects changes in market sentiment. 0 means "extremely fearful" and 100 means "extremely greedy." The components of this indicator include: volatility (25%), transaction volume (25%), social media (15%), online questionnaire (15%), market share (10%), and trend (10%).
4.USDT OTC Premium Index
The ChaiNext USDT OTC INDEX index is obtained by dividing the USDT / CNY OTC price by the offshore RMB exchange rate and multiplying by 100. When the index is 100, it means the USDT parity, when the index is greater than 100, it means the USDT premium, and when it is less than 100, it means the USDT discount.
5.Net Funds Inflow (Out)
This indicator reflects the inflow and outflow of funds in the secondary market. By calculating the difference between the inflow and outflow of funds from global trading platforms (excluding false transactions), a positive value indicates a net inflow of funds, and a negative value indicates a net outflow of funds. Among them, the turnover is counted as inflow capital when rising, and the turnover is counted as outflow capital when falling.
6.BTC-coin hoarding indicator
The coin hoarding indicator was created by Weibo user ahr999 to assist bitcoin scheduled investment users to make investment decisions in conjunction with the opportunity selection strategy. This indicator consists of the product of two parts. The former is the ratio of Bitcoin price to the 200-day fixed investment cost of Bitcoin; the latter is the ratio of Bitcoin price to Bitcoin fitting price. In general, when the indicator is less than 0.45, it is more suitable to increase the investment amount (bottom-sweeping), and the time interval accounts for about 21%; when the indicator is between 0.45 and 1.2, the fixed investment strategy is suitable, and the time interval accounts for about 39. %.
Note: Crypto assets are high-risk assets. This article is for decision-making reference only and does not constitute investment advice.
We will continue to update Blocking; if you have any questions or suggestions, please contact us!
Was this article helpful?
93 out of 132 found this helpful
Related articles
- Galaxy Digital CEO explains three common mistakes of crypto traders: early entry, lack of observation, short sight
- Pledgecamp CEO: Dual Pass + Funder Protection Mechanism, Blockchain Creates New Fashion for Crowdfunding Platform 丨 Chain Node AMA
- Central Bank Post | 3.15 Protection of Financial Consuming Rights and Interests: Beware of False Central Bank Digital Currency
- Outbreak of ruthless people: Blockchain enthusiasts in action
- Dalio 7600-word long article: What does zero interest rate mean?
- Babbitt weekly election 丨 The crypto market has been hit hard. Can Bitcoin lead the market out of the independent market?
- Exploring New Directions for Transformation 8 Listed Companies Refinancing "Patronizing" Blockchain


