Market Analysis A sharp drop is expected before the next rise, and a bear market is imminent.
Sharp drop expected before next rise, bear market imminent.Author: Ben Lilly, Source: substack; Translation: Kate, Marsbit
The earth is shaking.
When you feel the instability beneath your feet intensify, the last thing you want to hear is what’s happening thousands of miles away.
Therefore, I won’t discuss my initial thoughts – the dynamics of the International Monetary Fund (IMF), the Federal Reserve (Fed), and other central bank governors – considering the recent price trends, I will redesign today’s Blend to make it more relevant to recent price fluctuations.
- Can BTC hold the $26,000 support level? $1.9 billion BTC monthly options will tell you.
- Due to macroeconomic factors, the inflow of risk capital into cryptocurrencies further declined.
- Why did the cryptocurrency market decline this week?
I will divide today’s insights into short-term, medium-term, and long-term discussions, discussing our views on the market. This way, I won’t sound completely detached from reality.
Let’s get started.
Short-term
Last week, I mentioned on the Alpha Bites program that CARI sent a signal. This is one of our internal reversal indicators.
The chart of CARI is as follows. You can see that this helps the team better assess the market. The blue dots are signals. The most recent dots appeared on August 12th and 13th.
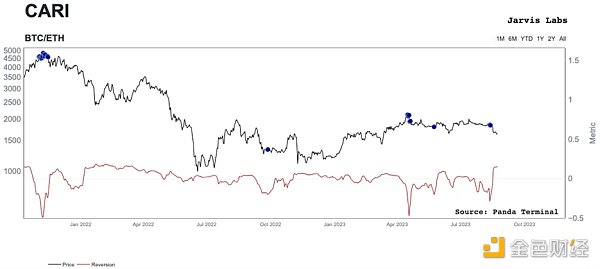
This signal coincides with some reports from the team, indicating that the trading volume on exchanges is very low, suggesting low liquidity. In fact, we started monitoring the liquidity of Tether (USDT) at this time. The reason is that its peg to USDC seems a bit soft.
These observations gave us more confidence in the flickering of CARI.
We all know what happened next: the tremors intensified until the ground collapsed and the price fell.
In response, the market became too excited and started shorting.
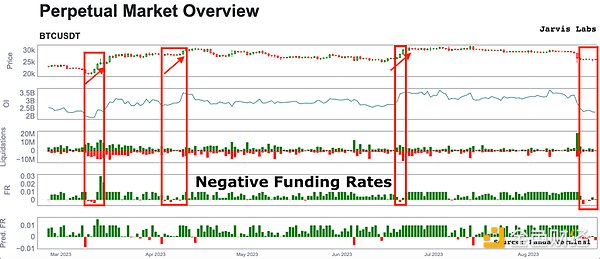
The chart below shows the funding rate for the past five months. As you can see, occurrences of negative funding are not frequent (part four).
Just a reminder, a positive funding rate is considered neutral. This means that long positions are paying shorts to maintain their open positions. When funding is negative, the situation is reversed. Shorts are now paying longs to maintain their open positions.
Negative funding is abnormal. That’s why when it really occurs, prices like to go up and solve this excessive desire by stealing people’s lunch money.
We can observe similar dynamics in the options market.
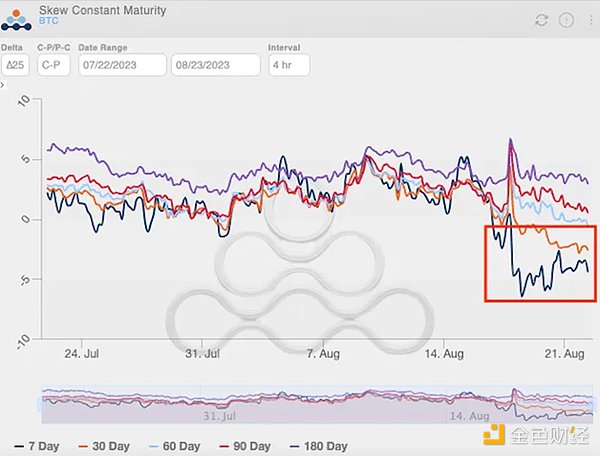
The indicator I rely on is d25 deviation. It basically takes two options contracts that are similar in price to the current price of Bitcoin (d25 = 0.25 delta and 0.75 delta contracts) and compares them. If this number is negative, it implies overly negative sentiment.
Negative deviation is definitely not the norm for cryptocurrencies. In the chart below, the red box highlights the contracts that are about 7 days and 30 days from expiration, expressing this negative sentiment.
All of these negative sentiments occurred just after the market suffered losses of hundreds of millions of dollars through liquidation. This is the largest liquidation event of the year. As you can see in the chart below, the price has wiped out some long-standing low-leverage long positions.
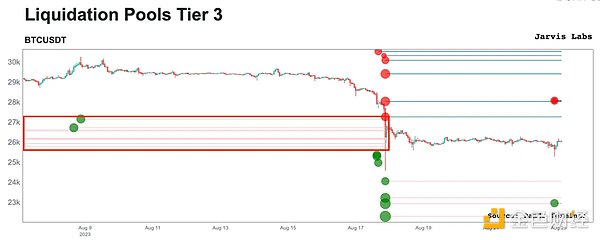
All of this indicates that the market is implying that the price is ready to trade within a lower range. Now we see that the bears are late.
Looking ahead, I expect these bears to experience some pain, either in the form of higher prices or more “crab walking”.
But what also needs to happen is for the market to generate some downward liquidity. It feels too early for the price to suddenly drop to new lows. I can see some subtle relief here, resetting some funding rates and liquidity.
This is a good transition to the mid-term view.
This is a good continuation of the mid-term view.
Mid-term
We need a little more time for this outlook.
My initial impression is that in the coming weeks, we will indeed be trading sideways within the range of $25,500 to $28,500. Ideally, I would like to see a clearer pattern form in the chart below.
Show the CVD point. It basically tells us whether buyers or sellers are in control of spot trading volume. If it tends to decline, sellers dominate. It has been a very reliable indicator since the beginning of this year (using the 4-hour time frame).
I am waiting for one of three possibilities. I have drawn them below. Basically, the CVD spot indicator either fails to return to the white trend line and then declines, or returns to the white trend line, or breaks through the white trend line.
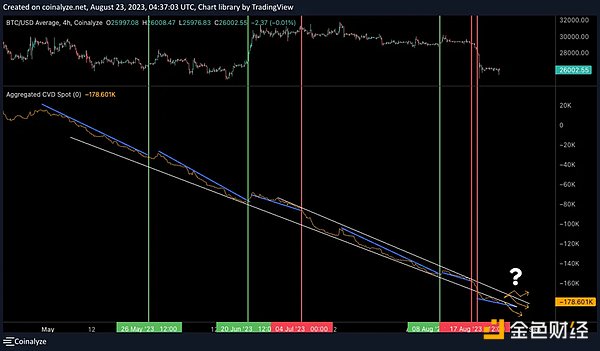
Before being too confident about anything, I want to see what happens here.
While we wait, there is one thing that has been on my mind. It’s a simple fact that last week we fell below the 200-day moving average.
When Bitcoin falls below this moving average and the next halving is less than a year away, historically, it’s a good buying opportunity. It usually only lasts one or two months. The premise is that we consider the pandemic in 2020 as an abnormal event, which I will explain more in the next section.
So, in the short term, I lean towards a relief rebound to flush out some overly eager bears. In the mid-term, I believe we will have more sideways movement, eventually a sharp drop, a final shakeout, and then a rebound, witnessing Bitcoin absorbing liquidity from small caps, which will drive its dominance in the market higher.
This will signal to the market that it’s time for an uptrend. This is the mid-term event I am waiting for, and then I’ll be very excited.
The sharp drop before the rise is a way to bring out the largest short position. This is also a situation that lasts for several months.
This will create a lot of liquidity and bring upward momentum through reversal. This will be a very strong signal that long-term views are now ready to take center stage.
Before that, it may be best to start averaging in Bitcoin, as it is below the 200-day moving average and waiting for the moment of surrender.
Long-term: Only Upwards
This part is relatively short.
I mentioned the data of the 200-day moving average before. As early as April, I elaborated on my long-term view in more detail, and this view still holds true until now.
Well, let me add to its importance…
After each halving of the Bitcoin price, the price does not close below this moving average until a major top appears. This is important. This cannot be ignored. You can see this in the red box below. The vertical red line is the halving, and the moving red line is the 200-day average.
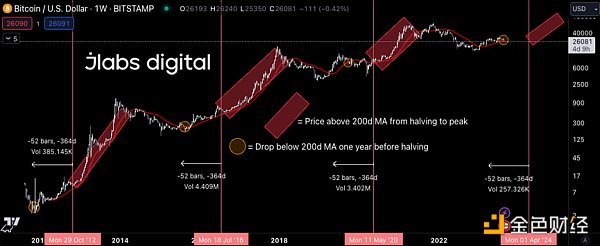
The halving time is April 2024. This means that the mid-term price trend I previously predicted may last for 3-5 months. Not just one or two months.
Many people may have a hesitation, that is, in 2020, the price fell below the 200-day moving average and we may see this situation again. You’re right, we might. This is a black swan scenario. A black swan refers to an event that cannot be predicted by definition.
But what I want to say is that in 2019, the price rose a lot from the low point. From early 2019 to July 2019, the increase from the low point to the high point exceeded 300%. From the end of 2022 to the high point in April this year, we only saw 70%. The market is not as hot as the previous cycle. That’s why I think we are more sideways than the slow and painful decline in July 2019.
In fact, if we surpass the 200-day average before the fourth quarter and still feel that we are in a sideways market, I would not be surprised.
But once we get through this boring and ugly period, it will move towards a historic high as shown in the chart above.
We will continue to update Blocking; if you have any questions or suggestions, please contact us!
Was this article helpful?
93 out of 132 found this helpful
Related articles
- Returning to ‘Common Sense’ Rationally Examining the ‘Truth’ of Crypto
- LianGuai Daily | Former product leader of OpenSea sentenced to 3 months imprisonment for insider trading; Binance Labs invests in Pendle Finance.
- Detailed explanation of the evolution of the MEV market from zero-sum game to separation of powers, the dark forest is being illuminated.
- Looking back at the decentralized storage track that has been ‘neglected’ by the market from EthStorage
- How to Tax Stablecoins?
- 10 Reasons to Believe in the Resurgence of the Cryptocurrency Bull Market
- Long Push An Analysis of ERC-4337 Market Use Cases based on Intentional Transactions


