Someone used three models to predict the valuation of Bitcoin and found that …
Author: Stephen Perrenod
Compilation: PayPal Finance
What is the relationship between the price of bitcoin and time, difficulty of mining, and reserves-output?
Stephen Perrenod recently published a long article analyzing the value of Bitcoin using three models and found that …
- Buy $ 100 each for the Top 10 projects in early 2019. How much can you earn now?
- How does the blockchain build a "gentleman's country" for industrial collaboration?
- Is Enterprise Blockchain 3.0 coming? What challenges will the Bluesky project formed by the Twitter CEO face?
1 Security and scarcity: Bitcoin's dual feedback loop
The beauty of Bitcoin is that its security and scarcity work together to form a set of self-enhancing collaborative feedback loops.
As shown below:

Figure 1: Bitcoin's scarcity and security enhance its value, forming a double feedback loop
Between halving, bitcoin has become more scarce as the percentage of rewards per block in the amount of mined coins (currently about 18 million bitcoins) is decreasing.
With production regularly halved, the scarcity of Bitcoin is becoming increasingly apparent. A halving occurs every 210,000 blocks, with a period of approximately four years, which cuts the block reward by half and brings Bitcoin's long-term inflation rate towards zero.
Note: The design of halving mining rewards is a long-term mechanism designed to curb cryptocurrency inflation and extend the mining ecology.
The cycle diagram at the top right of the figure above shows that the proportion of each new bitcoin in circulation is getting smaller and smaller, and the impact on the market is getting smaller and smaller. This increasing scarcity has pushed up prices.
The cycle diagram at the bottom left of the figure above shows that the rise in prices has encouraged mining enthusiasm.
The increase in computing power improves the security of Bitcoin, and the strengthening of security measures will also drive up prices. Therefore, scarcity increases security, and increasing security and scarcity will increase the price of Bitcoin in the long run.
2 Time Basis: Bitcoin Calendar System
When conducting research on price, market value, hash rate, difficulty, transaction value, stock, and other variables related to time, I recommend using the Bitcoin blockchain calendar as a basis to examine the correlation and the relationship between these factors and time variables. Relationships will be more natural, appropriate and accurate.
After the analysis is completed, these results can easily be converted to regular Gregorian calendar time for demonstration and further analysis.
In the Bitcoin calendar system, the "Block Year" is 52500 blocks, and the four-year "Block Era" is 210,000 blocks . (For more details, see "Living with Satoshi Nakamoto".)
Bitcoin's value comes from its security and scarcity.
Let's take a look at the following three models.
3 Model 1: Difficulty to obtain safety
The existence of the hash rate (computing power) guarantees the security of Bitcoin to a certain extent , but it turns out that the curve of the hash rate is a relatively smooth curve, because the hash rate is adjusted every 2016 blocks.
The hash rate is not a fixed value, it will be constantly adjusted as the difficulty of mining changes.
3.1 Model establishment
The basic algorithmic driving factor of the hash rate is the difficulty of adjusting Bitcoin. Adjustments occur every two "block weeks" (every 2016 block). The difficulty curve is much smoother than the average of the hash rate or even the weekly hash rate. If the production speed of the block is faster (slower) than the average 10 minutes, the difficulty will increase (decrease) in the next two weeks. The fastest average time (seconds) for a miner to mine a block is: time = difficulty * 232 / hash rate.
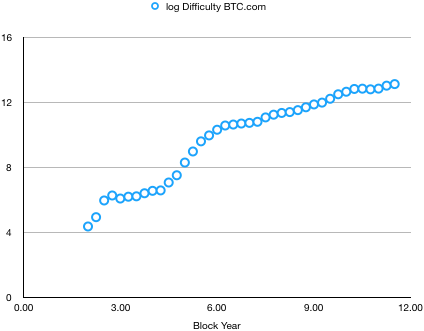
Figure 2: Relationship of logarithm of difficulty to block year (relative to regression of block year log)
The following table quotes data for half a year, but regression analysis uses quarterly data.
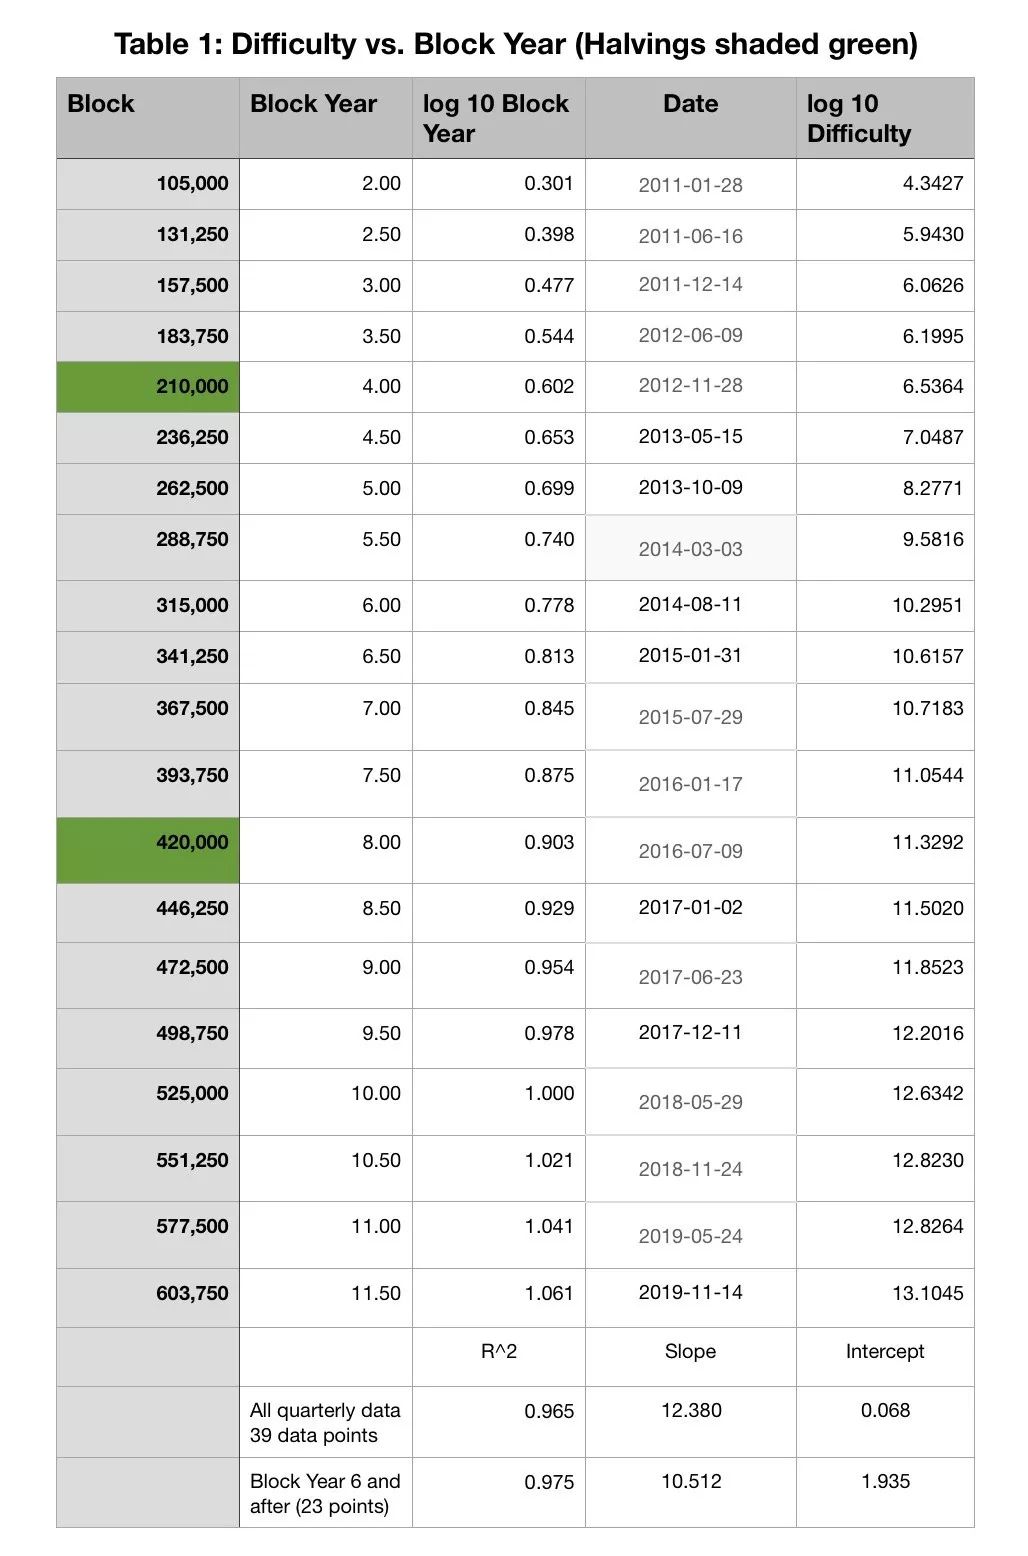
A linear regression analysis of all data in the log range (difficulty logarithm and block year logarithm) can find a power law relationship with an index of 12.38. However, if we limit the data to year 6 and beyond (after the advent of the ASICS miner), the power-law index will become 10.51 (R² = 0.975). The difficulty of mining seems to be very related to block height or block year.
Bitcoin's price and mining difficulty have been in a positive cycle for a long time. Higher prices will attract more miners to enter the market, which will increase the hash rate, which will increase the difficulty again, and keep the block production time around 10 minutes. Advances in mining machine technology have increased the profitability of miners, and also increased the hash rate, resulting in increased difficulty.
3.2 The relationship between price and difficulty
So what does price have to do with difficulty?
Woobull likes to study a bitcoin difficulty ribbon consisting of multiple moving averages of difficulty. This chart shows intuitively that a strong price pullback will make the index's difficulty flattening over a period of time, possibly up to a year. This may be a buying opportunity, as the weaker miners have been forced out, thus restoring market stability.
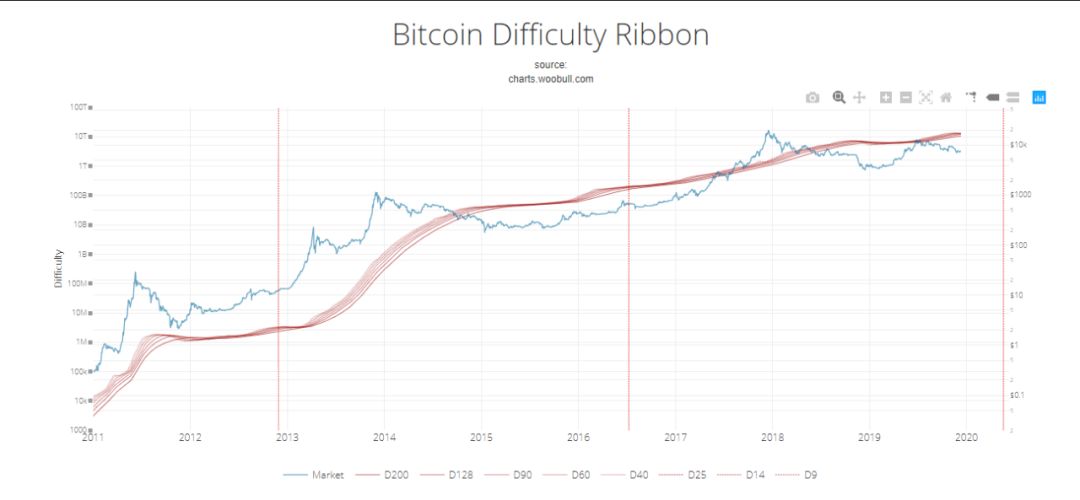
At this time, it may also be the time when we are closest to the point of supply and demand equilibrium, because the supply of bitcoin has little response to the price, except for a very short time-the hash rate will automatically correct the block time to 10 minutes So the release rate of the supply is basically fixed.
If we use quarterly data, starting from Block 6 and regressing the logarithm of price in logarithm of difficulty, we find that the slope is 0.646 and R² = 0.919. Taking difficulty as a secure agent, we can use the relationship between difficulty and block year (the index is a power law of 10.51) and the price-difficult relationship (the index is a power law of 0.646) to obtain the following price predictions:
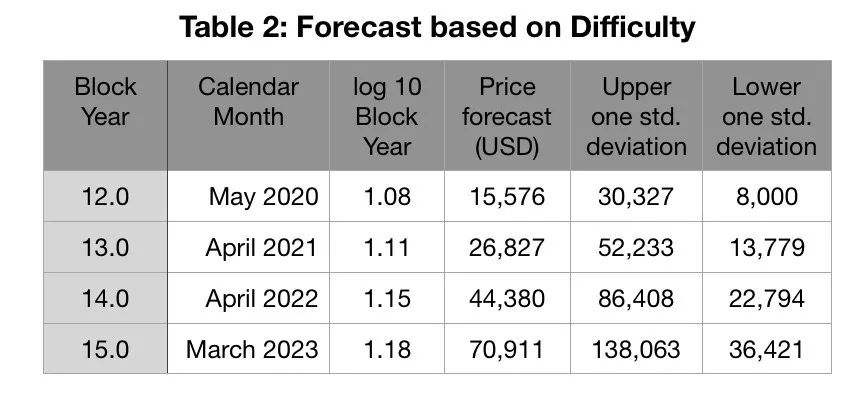
The logarithmic price prediction from the 6th block year to the 11.5th block year, the standard deviation in the error term is 0.289, and the price change of one σ is 1.95.
Therefore , if the relationship between block year and price and difficulty persists, there is a 68% probability that the price of bitcoin will be in the range of $ 8,000 to $ 30,300 near block year 12 (2020); in Around Block 15 (2023), there is a 68% probability that the Bitcoin price will be in the range of $ 36,400 to $ 138,000.
3.3 regression and cointegration
Fortunately, both log difficulty and log price seem to be second-order processes. For logarithmic difficulty, the average of first-order (second-order) increments is 0.2306 (-0.0129), of which 5.1% (57.9%) has a negative value. First-order differences do not look close to normal, but second-order differences look normal.
For the logarithmic price, the first-order (second-order) average is 0.114 (-0.01), and the negative value of the first-order (second-order) difference is 33.3% (47.4%). Second-order differentiation looks normal. Therefore, cointegration between difficulty and price seems feasible because both seem to be second-order processes.
4 Model 2: Scarcity and Reserve-Production (S2F) Model
The most famous Bitcoin value analysis model is Plan B's reserve-production model (scarcity model).
Note: Plan B is a well-known crypto asset analyst on Twitter.
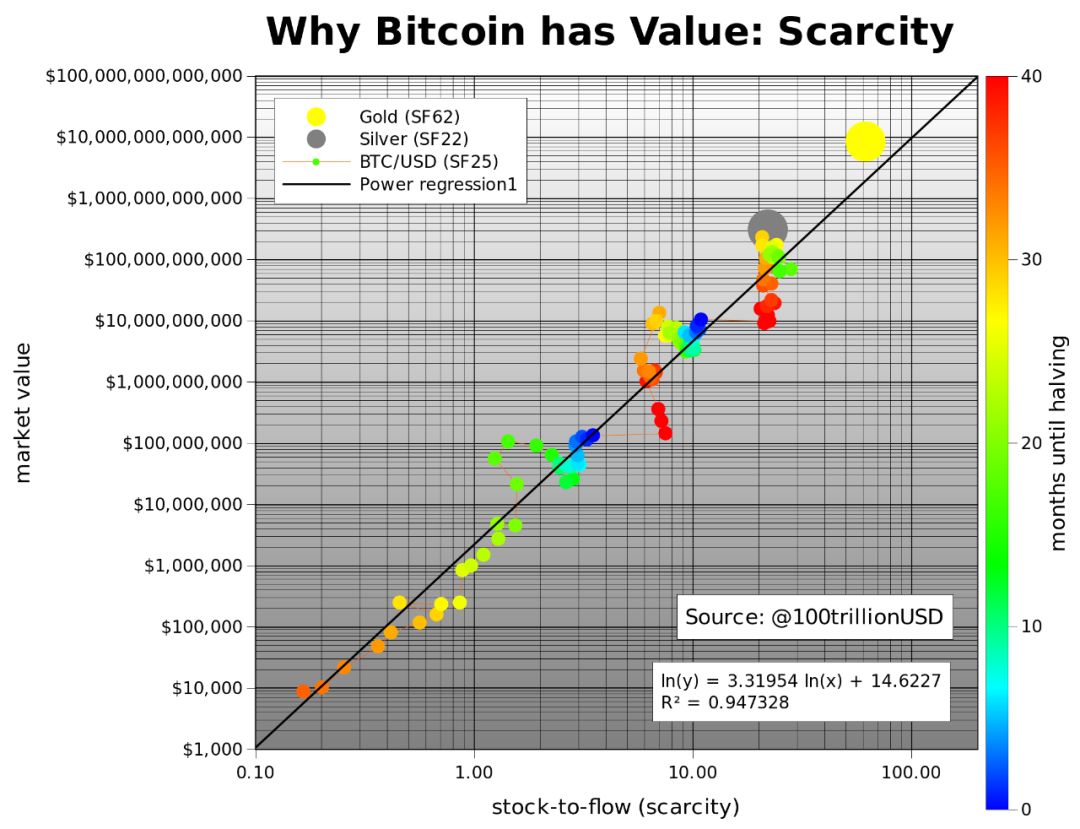
The expression of this model is simple: scarcity gives value. Plan B points out that this applies to precious metals including gold, silver, and platinum; even diamonds also conform to the same general power-law curve with an index of 2.2 (note that in future articles, PlanB will modify the silver inventory flow to a lower Value, and added platinum and diamond, and basically have the same curve).
He used the evolution of Bitcoin relative to its increasing reserves-production (recording reserves versus production at a logarithmic price) as a model, and found that Bitcoin followed a power law that was even steeper than that of precious metals, about 3.3.
Note: The Stock-to-Flow (S2F) ratio model (that is, the reserve-production model) refers to the number of available or reserve assets divided by the amount produced each year. The Stock-to-Flow ratio is an important indicator because the higher indicator value in S2F reflects the decrease in the annual rate of asset inflation.
Perhaps one of the reasons why the Bitcoin Power Law Index is 50% steeper than the Gold and Precious Metals Index is the increasing security / difficulty of Bitcoin. While bitcoin has become increasingly scarce, its security has also become higher and higher, while the scarcity and security of gold is basically static.
Reserves-Production is inversely proportional to inflation and is measured by circulation divided by one year's production including recovery and any reduction in reserves. In terms of gold, the reserve-to-production ratio (S2F) is 55, which is about an inflation rate of 1.8%. This is a relatively stable number in recent years.
If measured in block time, Bitcoin has a fully predictable inventory. There are some changes compared to the calendar time, but the block year is very close to the calendar year and is currently shortened by a few weeks.
The article "Bitcoin's Prerequisite Non-Inflationary Monetary Policy" precisely illustrates how S2F grows over time. S2F at each halving = 4 x (2 ^ E -2), where E is the block age. At present, we are in the third era, and this phase begins when the S2F ratio is 24. During the two halvings, the value of S2F gradually increased, and then a significant increase occurred during the halving.
The next Bitcoin halving is expected in May 2020, at which time it will enter the fourth era of Bitcoin (after the third halving), and the S2F value is expected to jump to 56. Its scarcity will be further amplified.
By then, Bitcoin's S2F value will match gold for the first time in history, and the inflation rate will drop to 1.8%. Bitcoin will become scarcer than gold. By 2024, S2F will reach 120 and inflation will fall to 0.83%.
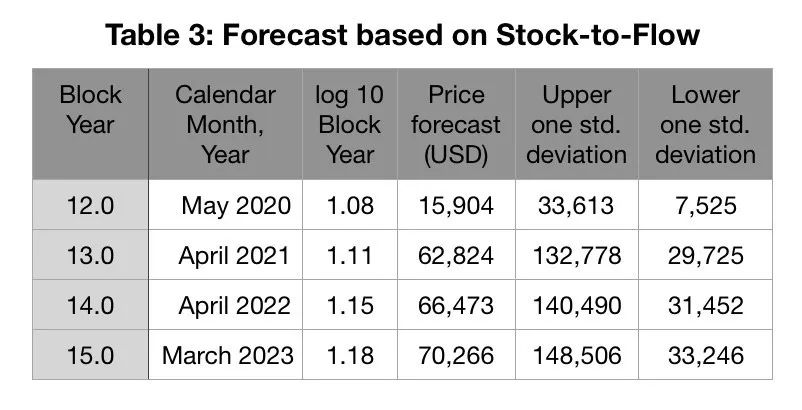
The uncertainty of the grid prediction is very large. In the logarithmic price, the standard deviation of the reserve-production model prediction error is 0.325, or the coefficient in either direction is 2.11.
What about the fork of the main Bitcoin chain ? BCH and BSV are the largest hard forks of the original bitcoin, with nominally the same scarcity attributes, but because their security is greatly reduced, they are not truly decentralized, and the market doubts whether they will strictly abide by the core Bitcoin supply algorithm . Obviously, their security is much lower. As of this writing, the security of BCH is 36 times lower, and the difficulty of BSV is even lower.
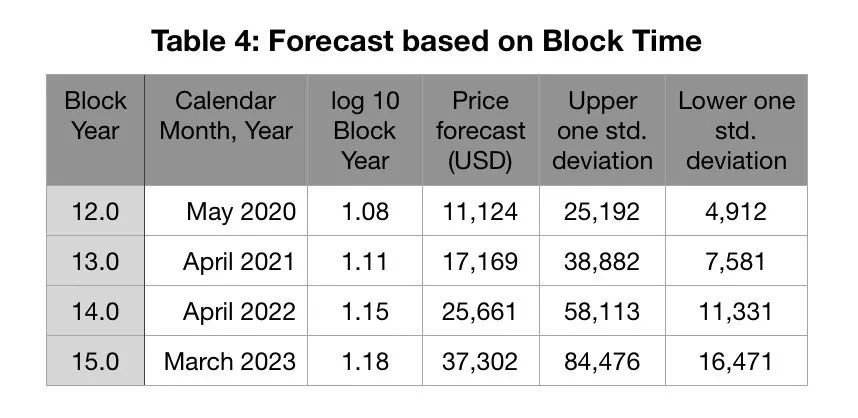
5 Model 3: Price and Block Time
Some people, such as HC Burger, even like to directly infer the price of Bitcoin based on regular calendar time. Using block time, one can find a fairly reasonable power law. Price ~ Byr ^ 5.42, where Byr is the number of years of the block (block height can also be used). The obtained R² value is 0.916, which is slightly lower than the stock flow model. The standard deviation of the logarithmic price is 0.350, which is 2.24 times.
In an article written by Burgercrypto (Burger and Burgercrytpo are two different platforms), he raised the issue of using logarithm of time. He was worried: "If two time series may be cointegrated, then these time series must be integrated in the same order."
But time is not a time series! It is a fully pre-determined basis vector that is used to map other data. The only problem is: if you use Gregorian time, what should be used as the zero point. The most obvious is January 9, 2009 (or January 3, 2009), but sometimes people use other arbitrary starting points, which seems suspicious.
In fact, Burgercrypto pointed out that time is a relative concept and discussed various startup time options. If block time is used, then this is not a problem, because in this case there is an absolutely defined starting point. At least for block time and reserve production, we do have completely predetermined basis vectors. Using the logarithm of the block time is just a variant of a completely predefined base vector.
6 Comparison of the three models
We summarize these three predictions in Table 5 and plot them in Figure 3. For each forecast, the standard deviation is about twice the predicted price on both sides of the price.
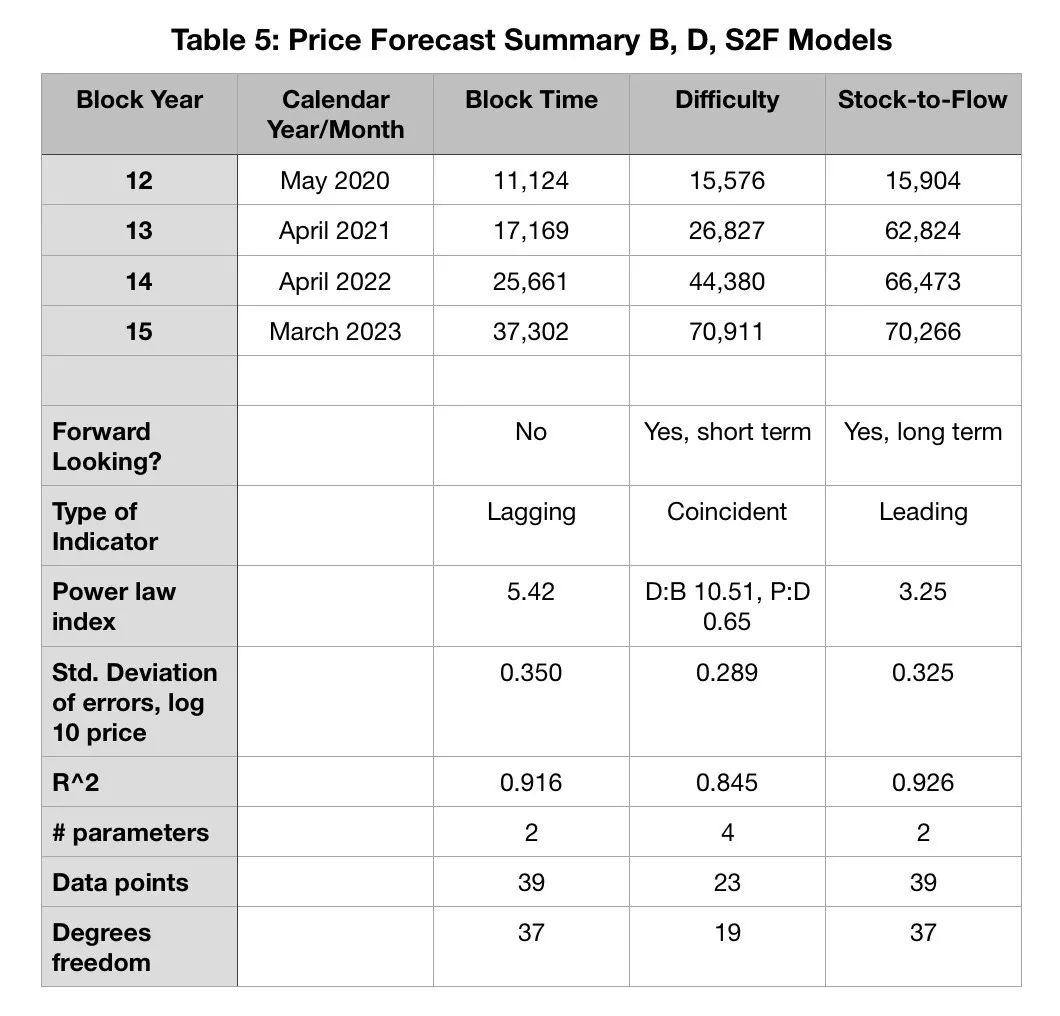
The reserve-production model is the longest-term and most forward-looking model and also shows the fastest price response, as expected for shocks or shock flows. We can call it "impulse flow". Unlike the strong shock wave that caused the shock wave density to increase four times in physics, the supply of "shock flow" increased the price by about ten times.
We can consider the reserve-production model as a leading indicator and the price-based model as a lagging or backward indicator. The difficulty model is an overlapping model, and like inventory flow, it has an identifiable driver.
The S2F model has a clear price driver , which is the impulse or large change provided when S2F is inevitably pushed to a new high every four block years. This is a steep model, the price is the power law of S2F, and S2F is the index of block time. It's no surprise, then, that its predictions of future prices are very aggressive. Obviously, this is also the most forward-looking model, because the halving effect is known from now to 2140.
For calendar time or block time, the only direct driving factor is persistence, or something similar to Lindy's effect (Note: Lindy's effect means that for something that does not die out naturally, such as a technology, an idea , Their life expectancy is directly proportional to the time they have existed.), It is believed that the Bitcoin network has stronger persistence and growth potential, because its life cycle is extended by another block year. Of course, over time, difficulty and inventory flow will increase over time. 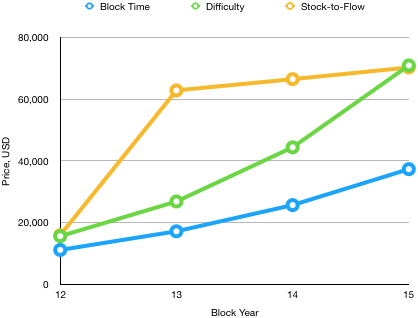
All of these are models, and they will be of reference value until they expire. Useful, but not the ultimate truth. We are still learning how the highly dynamic Bitcoin network has evolved and it has a lot of complexity.
The difficulty model arises from the observation that price and difficulty are associated with a moderate power law, and that the difficulty itself has grown dramatically over time.
In terms of difficulty, given the restrictions on electricity prices and availability, one cannot help asking whether it can grow at such a rapid rate. In "Bitcoin Power Consumption: Is It Worth It? In the article, I found that the electricity consumption of bitcoin mining has more than doubled every year in the past few years. This may lead to miners implementing a rationing or price rationing system.
In the next year or two, we will track price behavior, and we will have a certain understanding of how much value of Bitcoin comes from security (difficulty) and how much value comes from scarcity (inventory flow). Maybe someone will develop a composite model that takes these two factors into account. Interestingly, in the next 3.5 block years, the difficulty and inventory flow models will eventually predict that the price will be around $ 70,000.
The difficulty is lagging because there is no "quantum pulse" effect produced by halving the forcing function. Since the miners know in advance what will happen, they will take measures to phase out the old equipment and upgrade to new equipment to adapt to the environment after the output has been halved.
Seeing the results of these models and high standard deviations, whether using forecasts based on difficulty, reserves-production, or block time, it reminds us that when the price of Bitcoin moves in the opposite direction by $ 1,000 or $ 3,000, People really shouldn't panic. This is a small offset from the typical volatility of Bitcoin.
Writing this article led me to introduce another model, a price model based on difficulty, but it deepened my common belief in Plan B's reserve-production model. I think both models are worth keeping track of. Why the forks such as BCH and BSV have similar reserves and output as Bitcoin, but are so low in value relative to Bitcoin, this difficulty analysis may provide some explanations.
I also encourage the use of block time as the basis for regression and cointegration analysis: this is the natural rhythm of Bitcoin.
7 Satoshi Nakamoto's genius vision
The halving of the block reward algorithm seems to be a genius of Satoshi Nakamoto. For example, he could have proposed to release 500,000 bitcoins per year for 42 years.
He chose to halve the four block years as a cycle, which provided a "shock flow", indicating that he has an advanced consciousness, that is, a technology cycle, and perhaps a currency and business cycle, which will fully affect mining and the entire bit Economy.
Mining hardware is destined to advance faster than Moore's Law. If Bitcoin is successful, rising prices will attract more miners to enter the industry.
For S2F, although it has a strong basic principle, by 2024, when S2F will be equal to 120 (inflation rate is less than 1%), the model will enter an unknown field. This will be the scarcity of monetary assets we have never seen before. At some point, the power law will be broken, but will it be when the market value of Bitcoin equals the market value of all gold ($ 8 trillion), or equal to the global M2 money supply ($ 90 trillion), or any other level? ?
The reserve production model quantifies the relationship between Bitcoin's future market value and money supply, and implies that Bitcoin prices will slow.
Remember, it's not just the money supply that matters, but the speed of the currency. Currently, Bitcoin circulates much faster than the US dollar. Higher circulation speeds support larger economies, but they are less stable. As Bitcoin becomes more valuable and becomes a more stable asset, the speed of Bitcoin's circulation is expected to decrease.
After 2024, once the bitcoin inflation rate is less than 1%, does it matter whether it is 0.4% or 0.1%? By 2080, all bitcoins will be mined, except for the last 100 bitcoins. Until then, the reserve-production model may break through a less steep power law. Perhaps the increased security due to increasing difficulty can support the current steep power law; one also hopes that Bitcoin's young, vibrant nature and its changing inventory are one of the reasons.
The power law index of the precious metals is about 2.2, so this may be a transitional phase, because Bitcoin may follow the same curve supply as gold and silver in the case of two, three, or four new supply shocks in the future.
Global wealth totals about $ 300 trillion, but people don't need the same amount of base currency, which is the unit of account. Two-thirds of global wealth is in real estate. If Bitcoin becomes the base currency of the future monetary system, it can be revalued with Bitcoin. Then Bitcoin decentralized banks may emerge in the future.
Before we reach this stage, we are likely to see central banks adding Bitcoin to their reserve balances in order to defend the monopoly position of their institutions and banking systems. Bitcoin has seriously challenged the idea of a fiat currency-based reserve bank, so many changes may occur, but it is difficult to predict.
We will continue to update Blocking; if you have any questions or suggestions, please contact us!
Was this article helpful?
93 out of 132 found this helpful
Related articles
- Interpretation of Ethereum Proposal EIP1559: Reduce the total transaction fee and transaction fee volatility
- Science | Three Principles of Bitcoin Mining: A Brief History of Cryptography, Hardware Knowledge, and Development
- Financial Stability Board: The latest progress of large high-tech companies entering FinTech and its potential risks
- Director of Research Bureau of the People's Bank of China: Currency Competition in the Digital Age
- Could this report be the culprit behind the overnight plunge in the crypto market?
- Hong Kong Monetary Authority: Eight virtual banking licenses have been issued, Hong Kong's first virtual bank is expected to open for trial by the end of the year
- Li Lihui, Former President of Bank of China: We should step up efforts to improve the technical standards and security specifications of blockchain finance


