2019 bitcoin chain data review: nearly 4 trillion US dollars of "giant whale" on the chain during the year are in a dormant period

Text, Data and Visualization | Carol Editing | Bi Tongtong
Data Partners | Produced by Chain.Info | PANews
"Bitcoin is the best performing asset in the past decade." Both Merrill Lynch and Bloomberg have reached this conclusion.
- Inventory of "dead" blockchain projects in 2019: the peak of funds running in March
- The number of banks applying for blockchain patents has increased 38 times in 4 years. Weizhong Bank wins the championship with 288 patents.
- CME Group's option products based on Bitcoin futures officially launched
If you look at the increase, it does. It took only six years for Bitcoin to go from $ 1 to nearly $ 20,000, but the other side that cannot be ignored is that it only takes one year for Bitcoin to return from $ 20,000 to $ 3,000. The bitcoin roller coaster-like market will also be staged in 2019.
According to the coin price data corrected by CoinMetrics, Bitcoin reached its lowest point of $ 3,358.87 on February 7, 2019. Since then, IEO, DeFi, Staking, Libra, DE / CP and other hot spots have appeared frequently, continuously injecting vitality into the market. On June 26th, Bitcoin has risen all the way to $ 12,863.46, a 282.97% increase from its lowest point. However, Bitcoin only hovered at the 10,000 yuan mark for three months, and then entered a turbulent downtrend channel. As of the end of December 31, Bitcoin closed at US $ 7,167.40, a 44.28% drop from its highest point.
Between the ups and downs of the currency price, what kind of stories have ordinary users, "giant whale", exchanges and miners staged? PAData and Chain.info, a one-stop data service platform focusing on blockchain transactions, reviewed the data on the Bitcoin chain in 2019, and released the "2019 Data List on the Bitcoin Chain." Real picture.
This article is the first part of a review of the data on the Bitcoin chain in 2019.
PAData Insights:
1.The largest number of active users in Q2
The number of active users on the chain is considered to be equal to the number of active users to a certain extent. At least the probability that the two are similar in trend is very high.
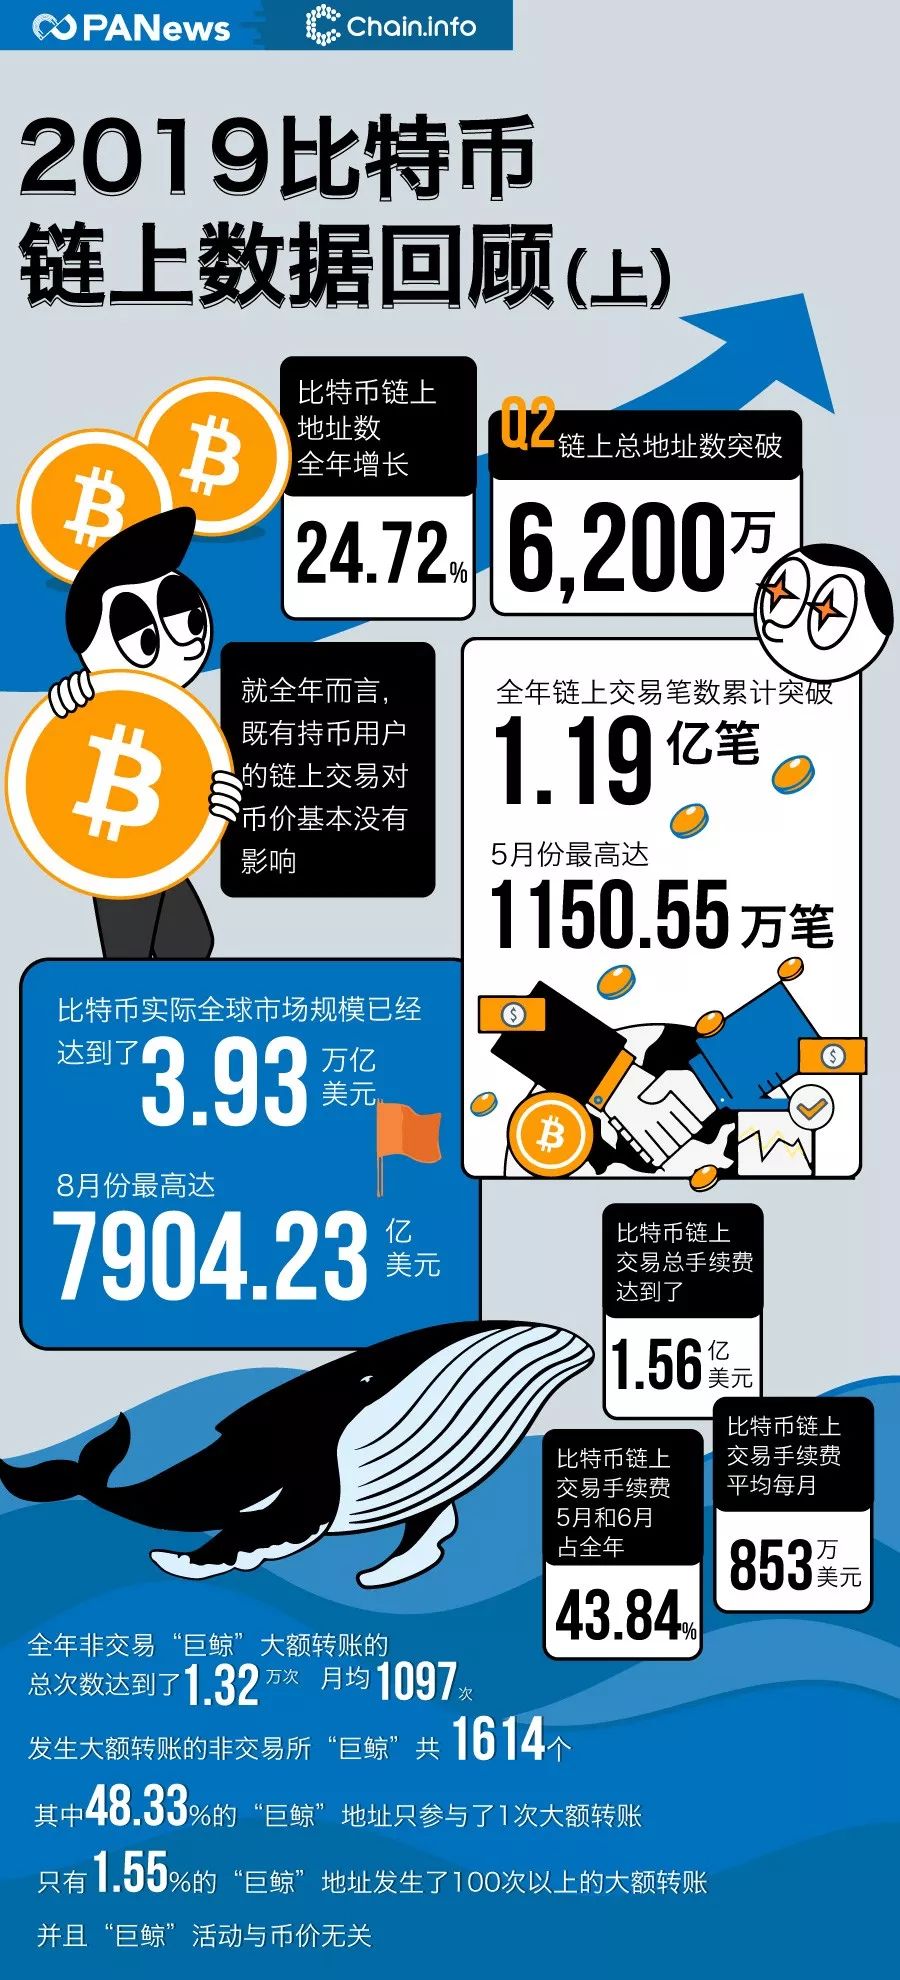
According to statistics, the number of addresses on the Bitcoin chain in 2019 has shown a modest upward trend, with an increase of 24.72% throughout the year. The number of on-chain addresses exceeded 62 million in the second quarter, including active addresses (referring to addresses that occurred on the day of the transaction, but excluding addresses for the first transaction) 35.398 million and new addresses (addresses for the first transaction) ) 27,815,400, which is the most active period for users throughout the year. During the same period, the price of bitcoin is in a rapid climbing phase.
Among them, May was the month with the most new addresses throughout the year, with 12.223 million new addresses. However, because Bitcoin uses a unique UTXO model, the change balance of the transaction will automatically enter a new address. In theory, only a part of the newly added addresses may be new users. Because it is not yet possible to determine this, the most new users in May. However, June is the month with the most active addresses throughout the year, with 9.923 million active addresses, which can basically be regarded as the most active month for existing currency holders.
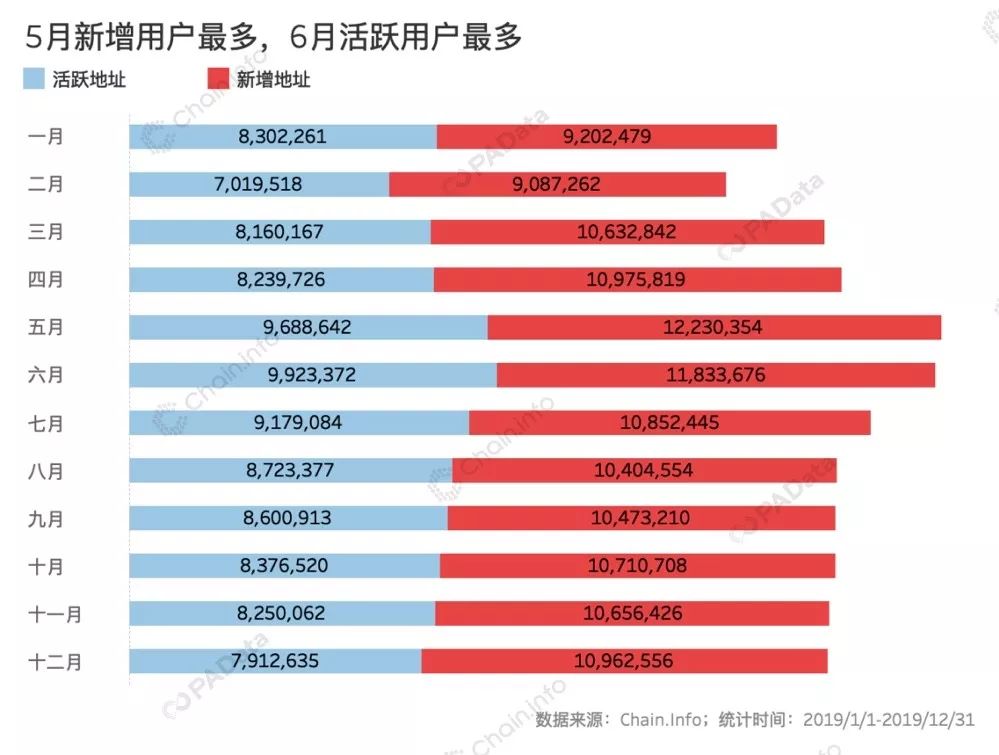
Comparing the trend of monthly currency prices throughout the year, it can be found that July, August, and September with higher monthly average currency prices did not correspond to higher on-chain active addresses and new addresses, but the monthly average currency prices gradually increased. At that time, the number of monthly active addresses and new addresses were decreasing month by month.
What is the relationship between the price of coins in the secondary market and the address on the chain?
PAData calculates the number of active addresses, new addresses, total addresses, and the average daily currency price of the previous 7 days (excluding the current day), the average daily currency price of the previous 3 days (excluding the current day), the current currency price, and Pearson correlation coefficient between the average daily currency price of 3 days (excluding the current day) and the average daily currency price of the next 7 days (excluding the current day). The higher the absolute value of the value, the more likely the correlation between the two is. The higher.
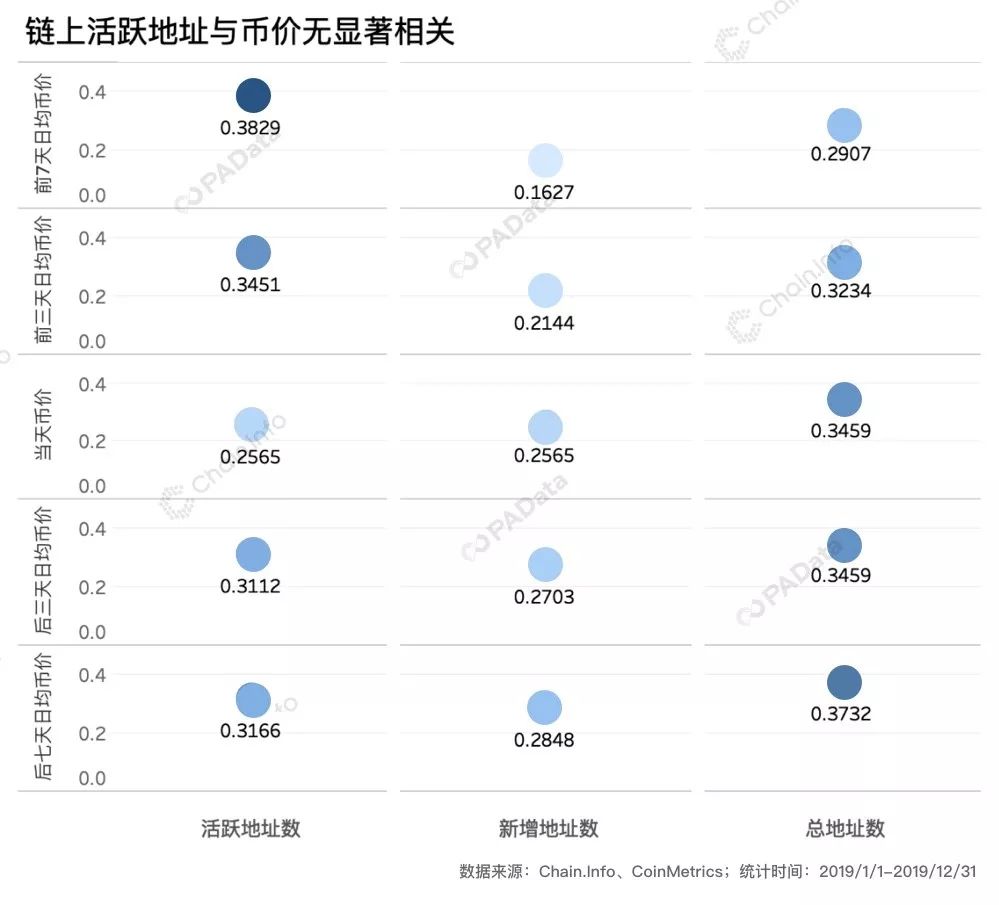
From the statistical results, the correlation coefficient of any two has not reached a significant degree of correlation, but the correlation between the number of active addresses and the price of the currency is slightly higher than the number of newly added addresses. From the perspective of the whole year, the number of newly added addresses has basically nothing to do with the currency price. In terms of the number of active addresses, it shows a weak correlation with the average daily currency price in the previous 7 days, and the correlation coefficient is close to 0.4, which means that the higher the average daily currency price in the previous 7 days, the more likely it is for existing currency users. Trading has a slight incentive. The correlation coefficient between the number of active addresses and the average daily currency price in the next 3 days and the average daily currency price in the next 7 days is only about 0.31, which shows that for the entire year, the on-chain transaction price of existing currency holders There is almost no impact. This may be related to the large households having more Bitcoin chips, the weak influence of ordinary users, and the settlement on the asynchronous chain of exchanges.
In addition, the correlation between the total number of addresses including active addresses and newly added addresses and the current day's coin price, the next 3 days 'coin price, and the next 7 days' coin price is slightly higher than the number of active addresses and newly added addresses during the same period. Correlation of period currency prices. This may mean that the increase in the total user size made up of some new users represented by the new addresses and existing currency-holding users represented by active addresses has a slight impact on the subsequent rise in the price of the currency.
PAData further analysis found that the research on the price of coins and the number of addresses on the chain was greatly affected by different statistical time ranges. For example, the correlation coefficient between the number of active addresses in May and the average daily currency price in the previous 7 days reached 0.57, and the correlation with the average daily currency price in the previous 3 days reached 0.64. This shows a picture that after the apparent upward trend of Bitcoin at the end of April, the rise in the price of the currency has promoted the transaction behavior of existing currency holders. The correlation coefficient between the active address in July and the average daily currency price in the next 3 days reached 0.52, and the correlation coefficient with the average daily currency price in the next 7 days reached 0.54, which may indicate that after the currency price stood at the USD 10,000 mark at the end of June, the More and more holders of coins started trading, making the price of coins running at a high level.
2.The total amount of on-chain transactions in the whole year is nearly 4 trillion US dollars.
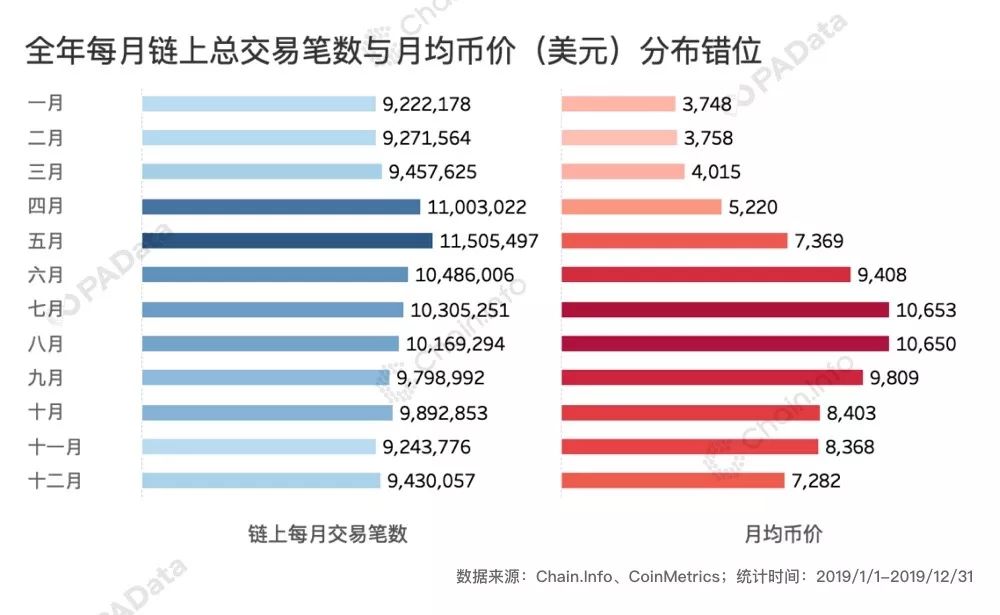
Compared to the fierce fluctuations in the price of coins, the number of transactions on the Bitcoin chain has stabilized. In 2019, the total number of transactions on the chain exceeded 119 million, and the average monthly distribution was around 10 million. Among them, May was the month with the largest number of transactions in the year, and the cumulative total reached 11.5055 million. It was followed by April, reaching 11.003 million transactions, and the number of transactions in the three months of June, July, and August also exceeded 10 million.
Combining the trend of monthly currency prices throughout the year, it can be found that the cumulative number of transactions on the chain and the monthly average currency price are misaligned. The number of transactions on the chain is at most April, May, and June, and the average monthly currency price The highest is June, July, and August. In other words, the frequency of on-chain transactions starts before the price of the coin, and the price of the currency basically does not affect the frequency of on-chain transactions.
According to the accumulation of the total transaction amount on the chain throughout the year, the actual global market size of Bitcoin in 2019 has reached 3.93 trillion US dollars, which is approximately 27.23 trillion yuan based on the exchange rate of January 9. According to Oriental Fortune Choice data, the transaction value of A shares in 2019 is about 121.60 trillion yuan (excluding new shares listed in the year), and the annual on-chain transaction value of Bitcoin is about 1/4 of that. Ping An, the largest A-share trading volume in 2019, has only 1.24 trillion yuan, and Bitcoin's annual on-chain transaction volume is more than 20 times its value. It should be said that the market size of Bitcoin as an asset target is still not large, but if the specific stock target is targeted, the market size cannot be underestimated.
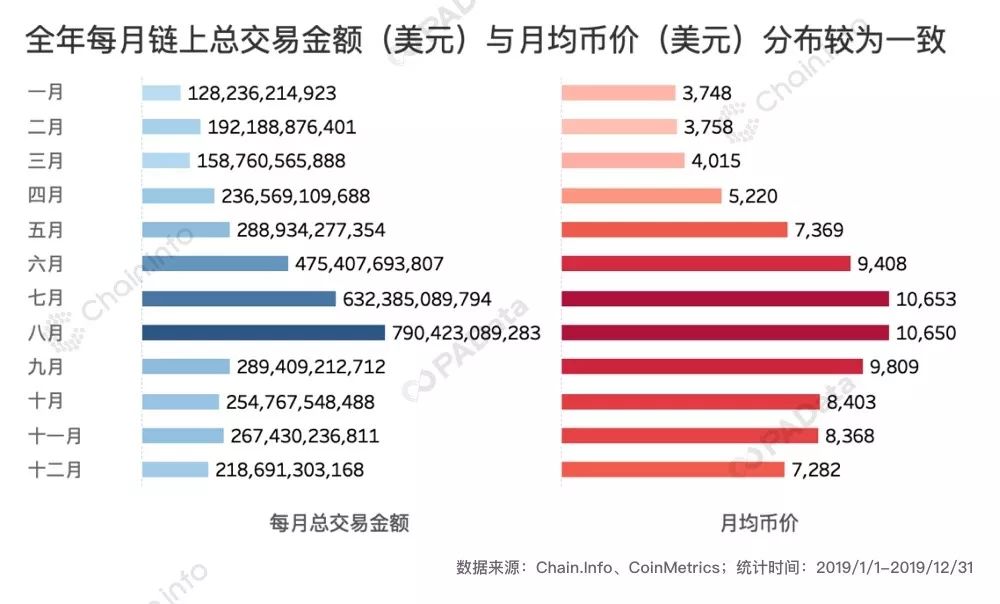
In August, the highest transaction value on the chain this year, the transaction value has reached 790.423 billion US dollars, especially on the three days of August 21, 22, and 23, the daily transaction value reached 105.208 billion US dollars, 248.891 billion US dollars and 118.573 billion US dollars. , And the highest weekday is only $ 62.311 billion. However, there is no consensus on the reasons for the abnormal trading volume in these three days. The possible reasons are affected by various factors such as over-the-counter trading, dark-net trading, and institutional fund entry.
In general, the total monthly on-chain transaction volume and currency price show a certain amount of price and price consistency. The total on-chain transaction volume in June, July, and August is the highest month in the year, and the currency price is also higher. month.

3. "Large whale is asleep" Large transfers of inactive whale transactions and the amount of money have nothing to do with the price of the currency
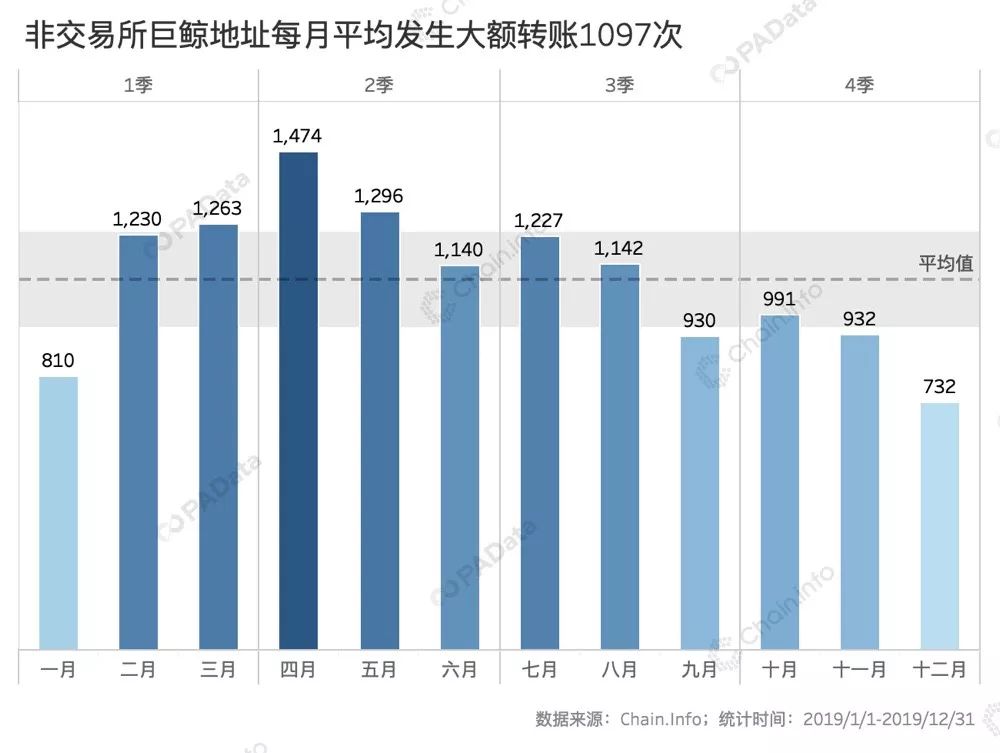
If non-exchange addresses with a balance greater than 2,000 Bitcoin are defined as "giant whale" addresses, these addresses account for about 0.01% of the total number of active Bitcoin addresses. According to statistics, in 2019, the non-exchange "giant whale" address made an average of 1097 large-scale single-money transfers per month [1], which is equivalent to about 3 times a day. The second quarter was the most frequent period of non-exchange "giant whale" large transfers. A total of 3910 large transfers occurred in April, May and June, and 1474 large transfers in April, the highest in the year.
Although the total number of large-scale non-trading "giant whale" transfers reached 13,200 times throughout the year, there were 1,614 "giant whale" transfers, but 780 "giant whale" addresses only participated in it once. For large transfers, the number of large transfers at 671 "giant whale" addresses is less than 10, which is equivalent to less than 1 per month. The two types of "giant whale" addresses that are not active in large transfers accounted for 89.90% of the total, and only 1.55% of the "giant whale" addresses had more than 100 large transfers in the year. In general, large-scale transfers of non-exchange "giant whale" in 2019 are not active. "The giant whale" is basically in the "sleeping period".
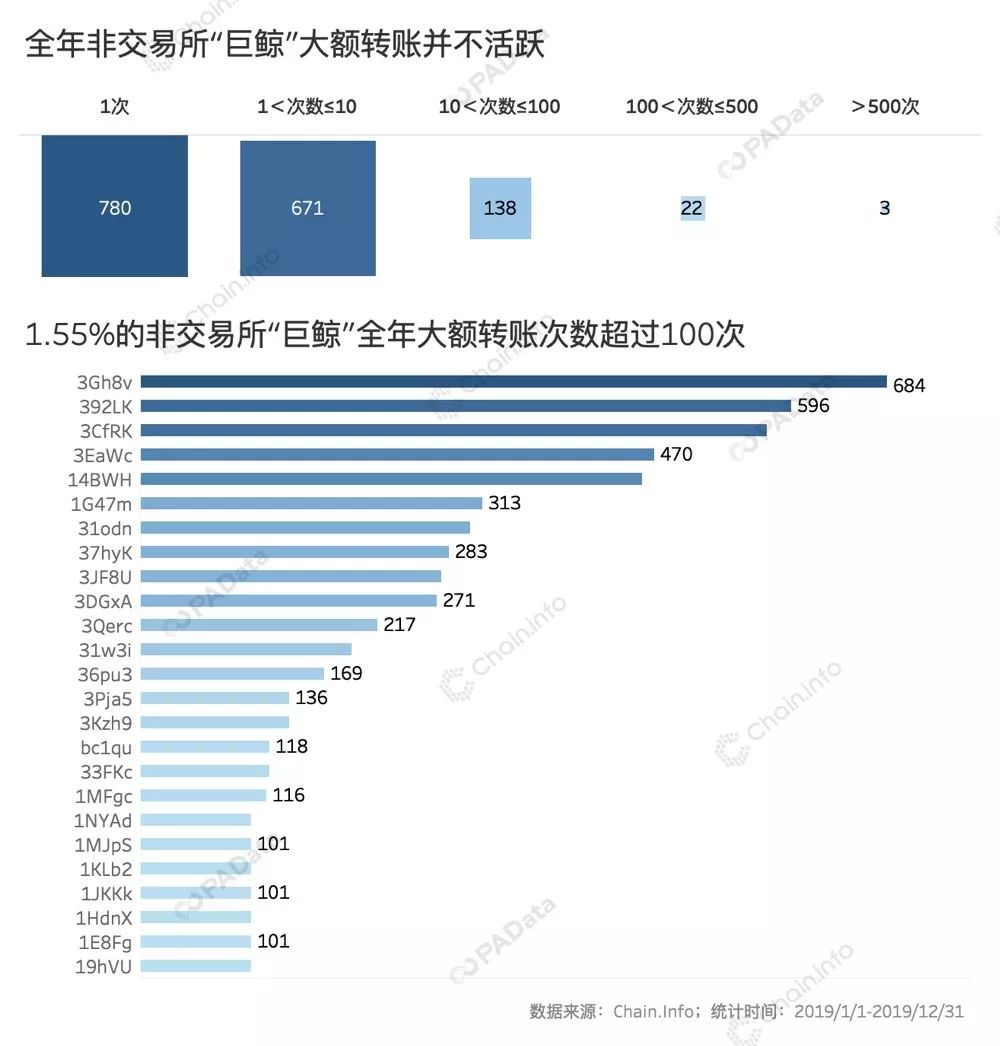
In 2019, the most active large transfers in non-exchange "giant whale" are "3Gh8v", and the number of large transfers throughout the year is as high as 682, which is equivalent to 13 large transfers per week (7 days), which is very active. In addition, "392LK", "3CfRK", "3EaWc", and "14BWH" all have large-scale transfers of more than 450 times a year, which is equivalent to 8 large-scale transfers every week (7 days).

If you look at the monthly currency price trend, non-exchange "giant whale" large transfers are active in the second quarter, instead of July and August, the year's high currency prices. The non-exchange "giant whale" is consistent with the total number of transactions on the chain throughout the year, moving ahead of the currency price.
Is the "Whale Whale" activity related to the price of coins?
PAData calculated the number of large-scale non-exchange "giant whale" large-scale transfers and transfer amounts [2] and the average daily currency price of the previous 7 days (excluding the day), the average daily currency price of the previous 3 days (excluding the day), The Pearson correlation coefficient between the currency price of the day, the average currency price of the next 3 days (excluding the current day), and the average currency price of the next 7 days (excluding the current day). The higher the absolute value of the value, the higher the absolute value of the two. The correlation may be higher.
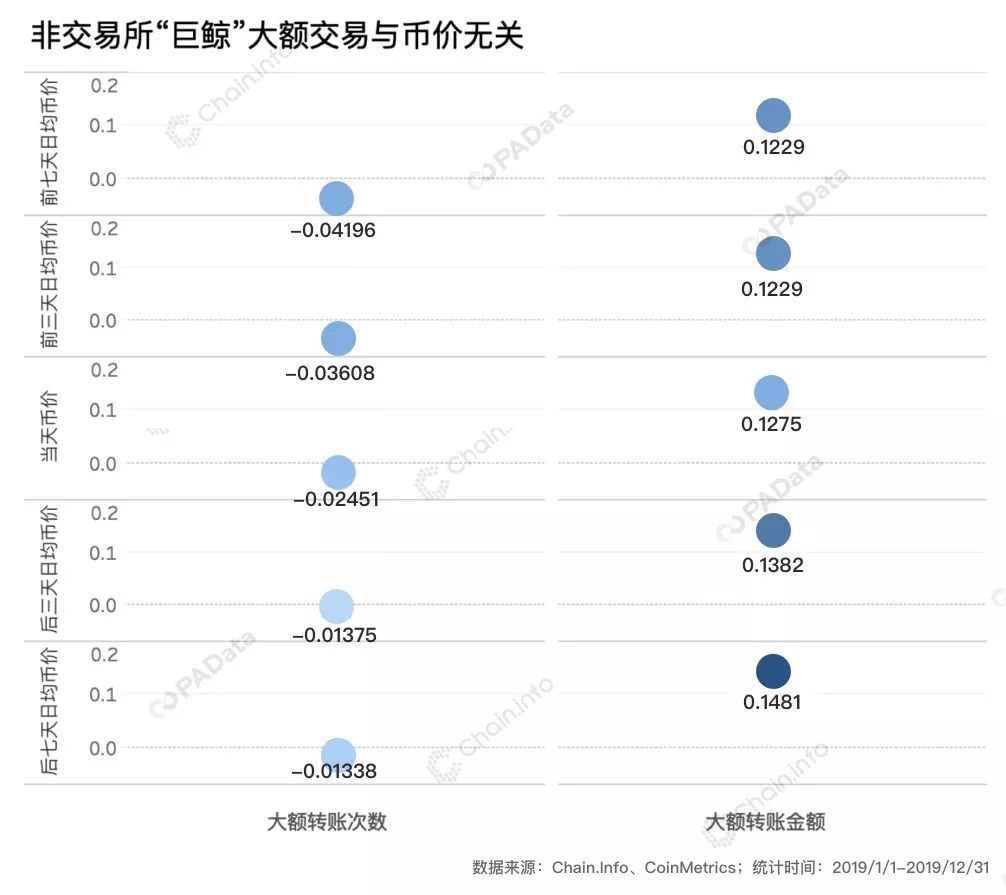
According to statistical results, both the number of large transfers and the amount of large transfers have no correlation with the currency price in different time periods. Even if the observed time range is specific to each month, the correlation coefficient between any two does not exceed 0.3. This means that the activity of the non-exchange "giant whale" is not directly related to the currency price of the secondary market.
the data shows:
[1] The number of large whale transfers counted here is judged by either the transferor or transferee as a "giant whale". If both sides of the transaction are giant whale, it will be counted as 2 large Amount transfer.
[2] The "large whale" large transfer amount calculated here is judged by either the transferor or transferee as "giant whale". If both parties are giant whale, only one large transfer is recorded Amount.
We will continue to update Blocking; if you have any questions or suggestions, please contact us!
Was this article helpful?
93 out of 132 found this helpful
Related articles
- Blockchain + Medical Research Report: The biggest pain point of data and traceability, blockchain technology may save more than 100 billion US dollars in costs each year
- Blockchain 2B company is hot: the company takes orders madly, employees 996, year-end awards have increased significantly
- BTC block reward is about to be halved, will its security rate be halved?
- Industry Blockchain Weekly 丨 Blockchain writes 7 provincial government work reports, Baidu and Tencent enter A shares
- Babbitt weekly election 丨 Do you panic when 2020 starts like this?
- Decentralization cannot be done in one step, A16z talks about three factors for the success of cryptocurrency projects
- Viewpoint | Talking about Bitcoin from the Theory of Monetary Information: Bitcoin is the ultimate safe-haven asset