Bitcoin stays stable at $30,000, is this a signal of a bull market?
Bitcoin stable at $30,000- is this a bull market signal? 
The current Bitcoin price is at the “midpoint” of the 2021-2022 cycle, at $30,000. Many Bitcoin indicators are also approaching the “re-accumulation period” level of the previous cycle. Although the hype around Inscriptions is cooling down, the Bitcoin trading market is becoming active again.
Summary
- The Bitcoin price is consolidating around $30,000, the midpoint of the 2021-2023 cycle, and the price performance from the beginning of the year to now is still strong.
- The hype around Inscriptions has clearly cooled down and the congestion on the Bitcoin network is beginning to ease. However, we can see that Bitcoin trading volume is starting to increase and has grown by 75% since the low point in November.
- The Bitcoin price is currently at the breakeven point, which is the “re-accumulation period” that lasted for several months in the previous cycle.
Bitcoin remains strong
Since 2023, the Bitcoin market has maintained a steady growth trend, rebounding to over $31,000 in recent weeks and consolidating around this price level. If we assume that the low point in November 2022 was the bottom of the cycle, we can compare the magnitude of the “pullback” from that time to now. Next, we will compare this price performance with that of previous cycles from the perspectives of “high point” and “low point”.
Compared with the high point of 2023, the maximum price decline this year is only -18%, which is very shallow compared to all previous cycles. This may indicate the strong demand for Bitcoin in the current market.
- Galaxy Digital Founder: Bitcoin ETF Will Become SEC’s “Stamp of Approval”
- CoinMarketCap: Overview of the Overall Status of Trading Platforms in the First Half of 2023
- An Explanation of Taproot: Consisting of Three Different Bitcoin Improvement Proposals
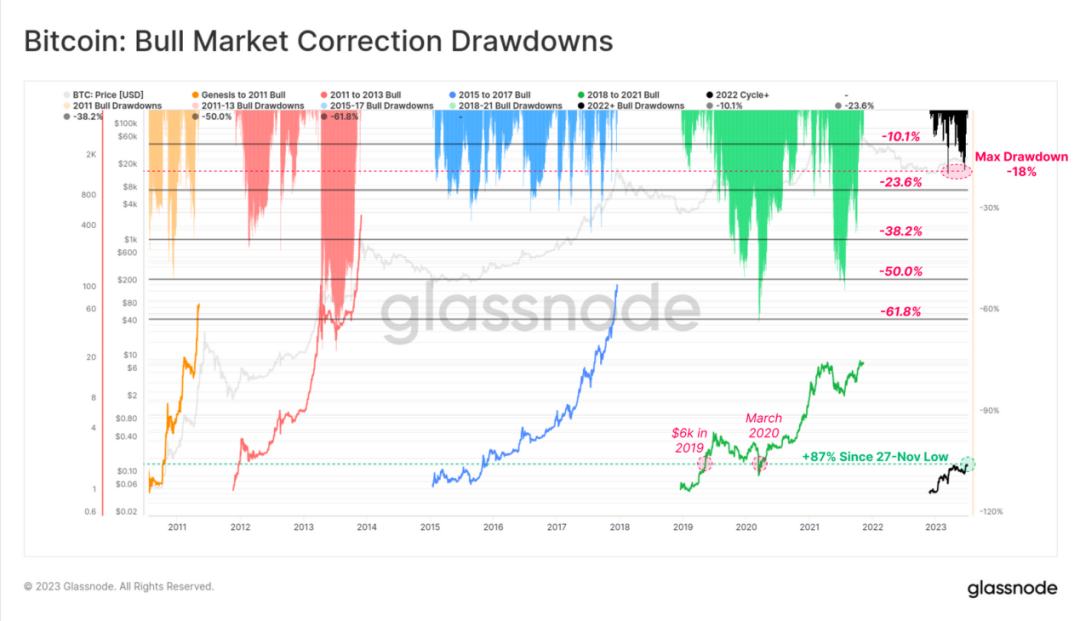
Figure 1: Pullback magnitude
Let’s take a look at the low point. The strong rebound since the November low has risen by 91%, which is very similar to the rebound magnitude of previous cycles.
Except for 2019, all previous cycles that have experienced similar bottoming and rebound periods have actually been the starting point of a new cycle’s upward trend.
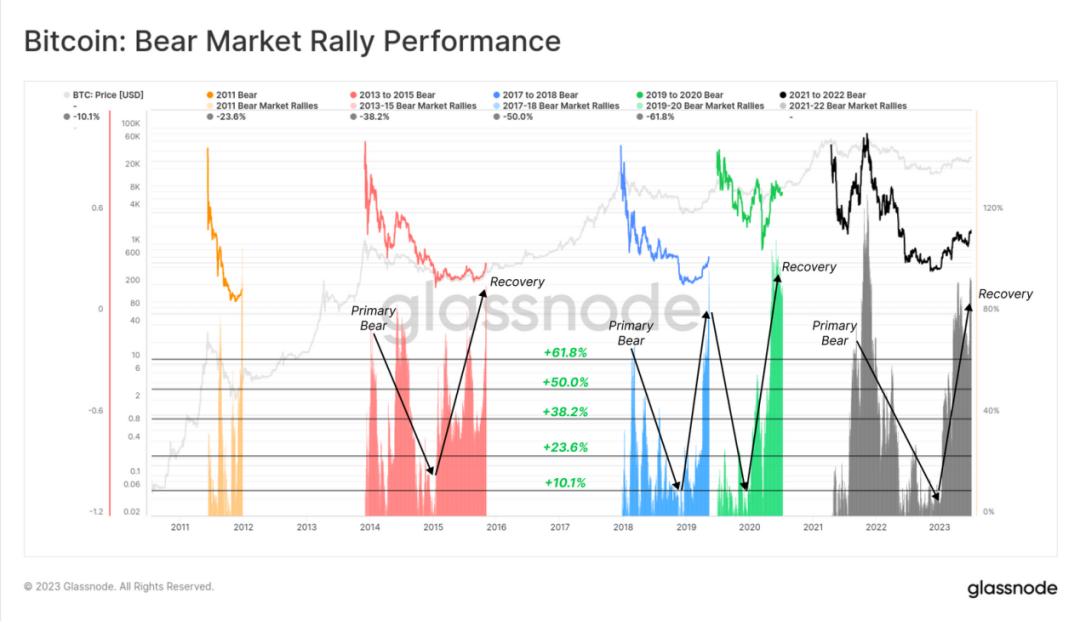
Figure 2: Rebound performance
Inscriptions cools down, Bitcoin warms up
One of the most surprising events in 2023 was the appearance of Ordinals and Inscriptions on Bitcoin. This brought about two different Inscription trends:
- The first is mainly image-based Inscriptions, which gave rise to NFTs in the Bitcoin ecosystem. So far, a total of 1.08 million images have been carved in;
- The second is mainly text-based Inscriptions related to “BRC-20” tokens. Bitcoin currently has 14.8 million text-based inscriptions.
In terms of the number of Inscriptions, the second type is much larger, but since May, its activity has been declining. This week, text-based Inscriptions saw a brief rebound, and the number of unconfirmed transactions in the Bitcoin memory pool began to decrease.
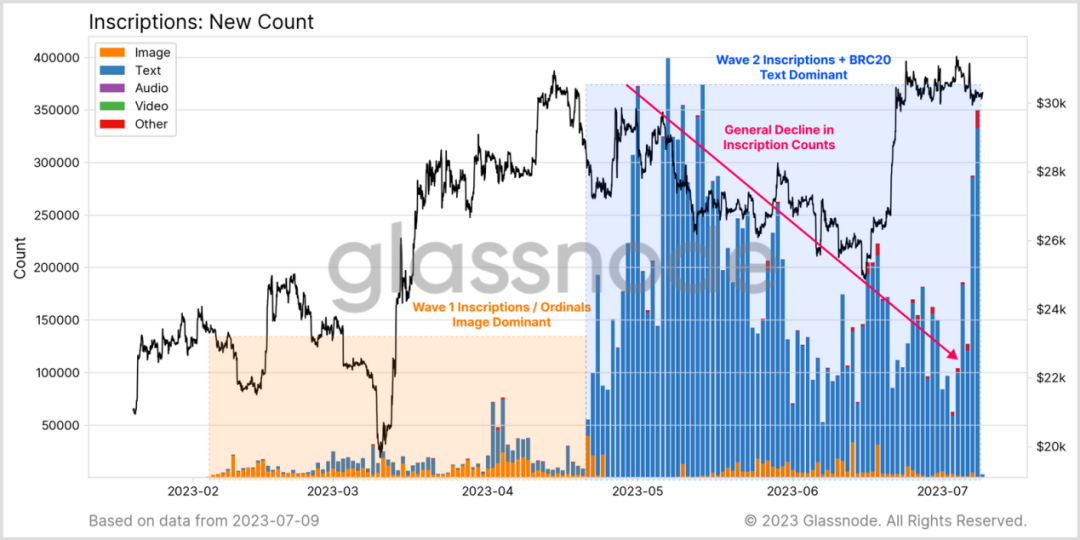
Figure 3: Inscriptions data
At the same time, we found a very interesting phenomenon in the on-chain activity indicators. Generally speaking, an increase in on-chain activity indicators in Bitcoin is a signal of usage growth and network health (i.e., an increase is usually a good thing).
However, at the same time, a large number of addresses are reused, and the transaction volume related to Inscriptions is very small (~10k sats), which reduces the block space demand dominated by Inscriptions.
Therefore, we need a more detailed explanation for the high demand phenomenon of the Bitcoin block as a whole. The summary is shown in the following table:
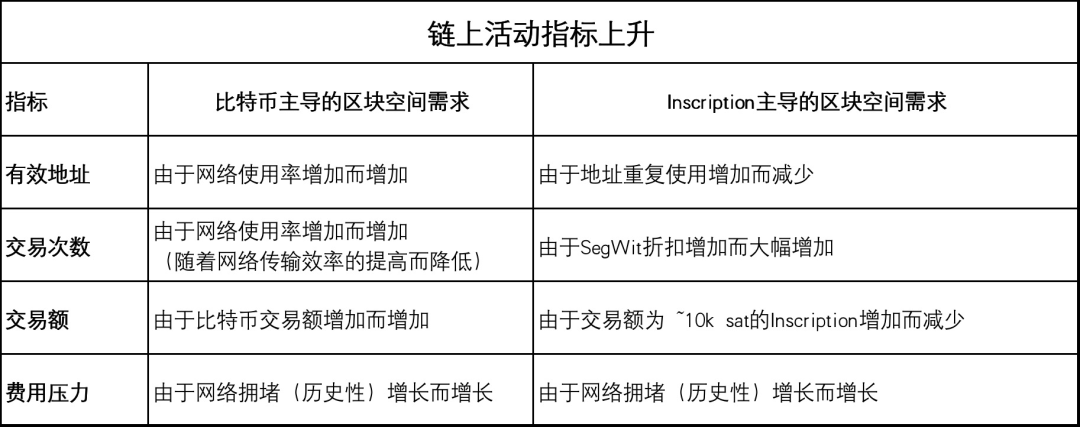
Table 1: On-chain activity indicators rise
As a result, with the cooling of Inscriptions, the momentum of active Bitcoin addresses is once again on the rise. Some may think that this is because Bitcoin network activity has declined in the past 2-3 months, but in fact, at that time, Inscription traders were using repeated addresses in large numbers, and network activity was actually booming, and block space was also filled up.
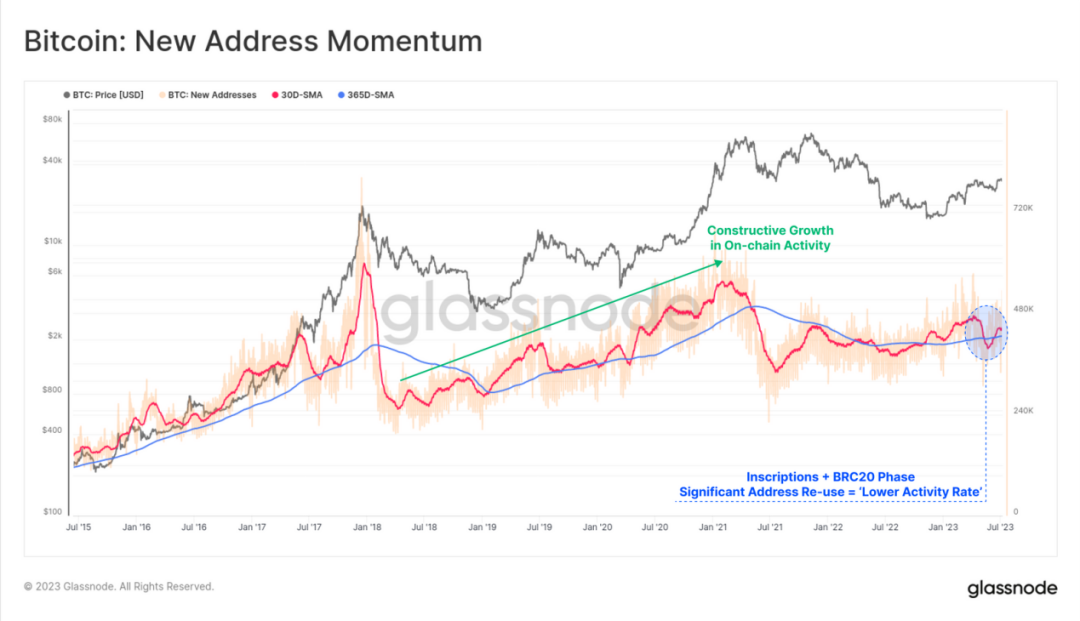
Figure 4: Growth trend of new Bitcoin addresses
Due to the application of SegWit, the number of Bitcoin transactions has also set a new record. This means that miners can pack more transaction data into each block, and some blocks are even close to the theoretical limit of 4MB.
Recently, the daily trading volume of Bitcoin has also decreased significantly, consistent with the trend of slowing Inscriptions activities.
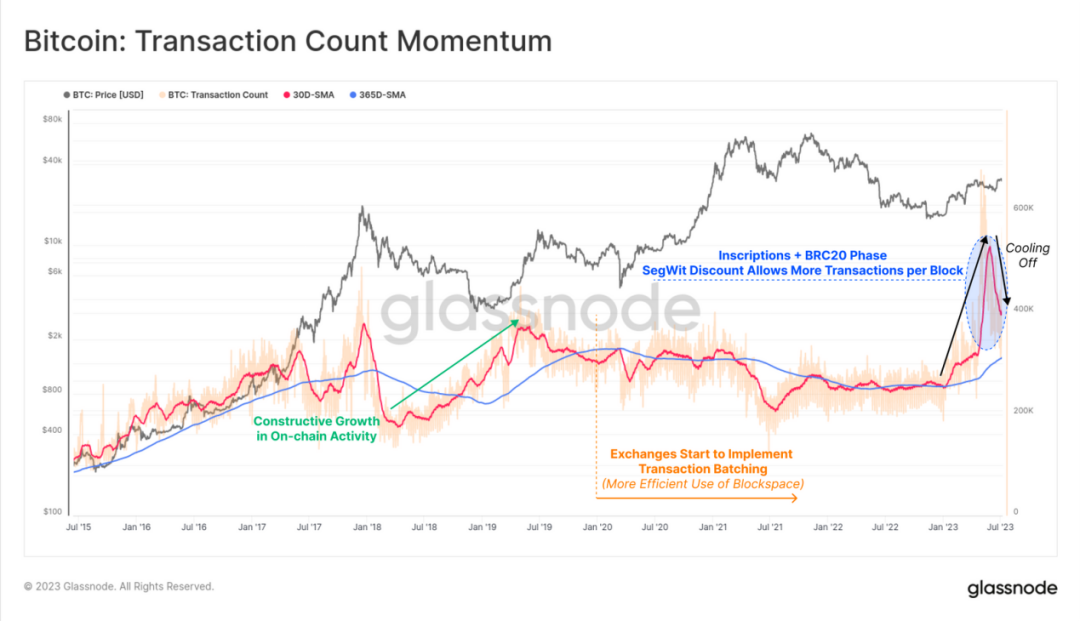
Figure 5: Bitcoin transaction activity
After experiencing several months of network congestion, the Bitcoin memory pool is slowly clearing, and on-chain transaction fees are beginning to decline. Since the explosion of Brc-20 in May, Bitcoin transaction fees denominated in US dollars have dropped by more than 96%, with the current average fee being $1.33 and the median fee dropping to $0.16.
The fee indicator shows that on-chain transaction activity is slowing down overall.
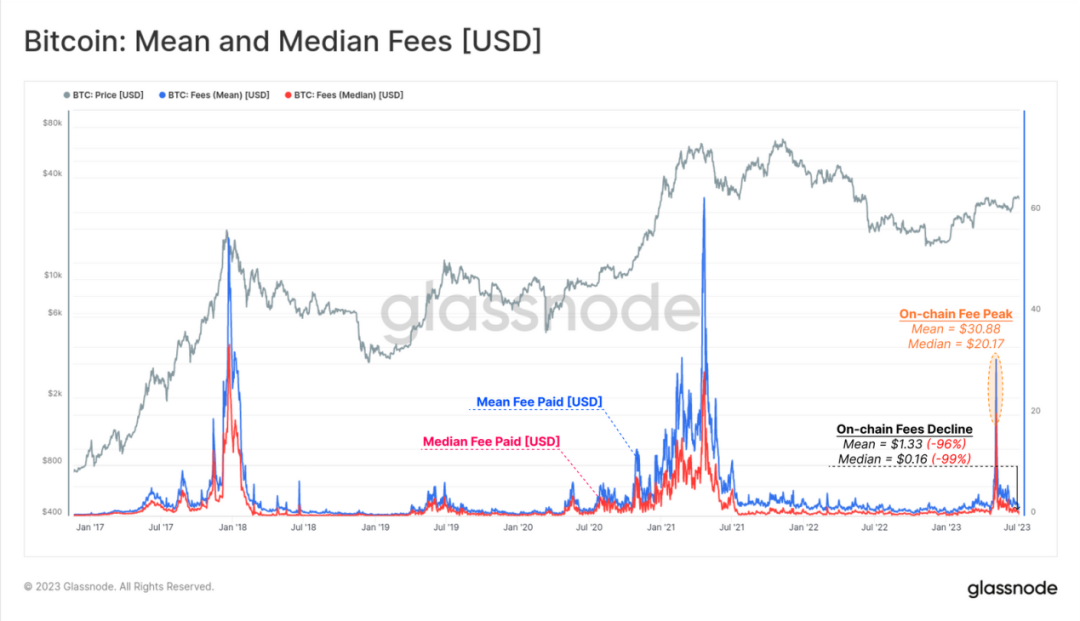
Figure 6: Average and median fees (USD)
While on-chain transaction activity is slowing down, the amount of BTC traded is increasing. The current BTC trading volume is 75% higher than the low point during the FTX explosion period, with a total settlement amount of $4.2 billion per day.
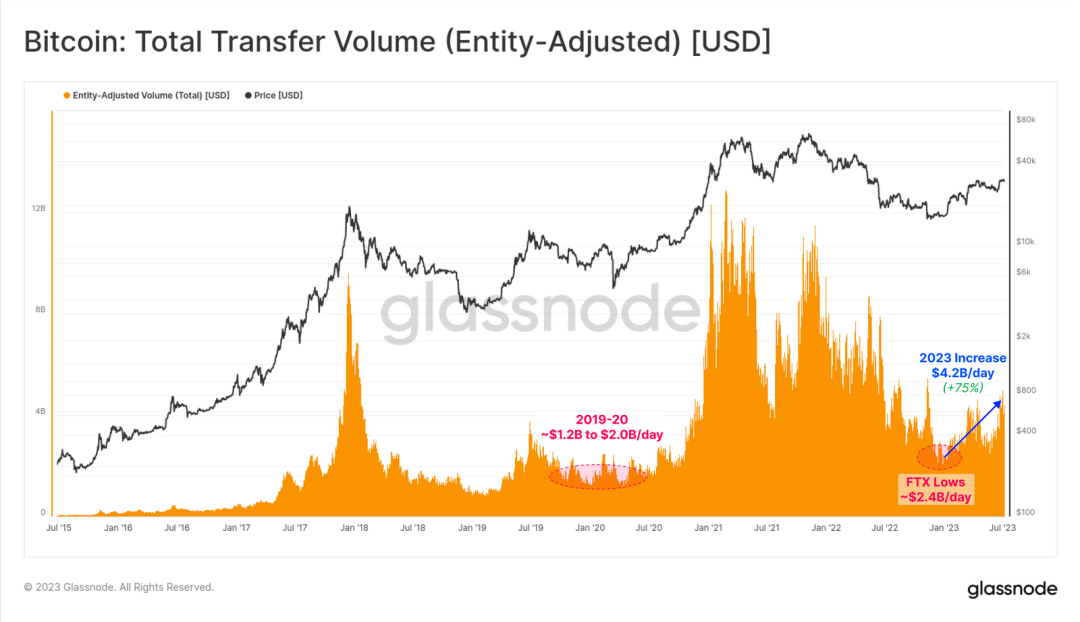
Figure 7: Total settlement amount (USD)
If we only look at the inflow and outflow of trading platforms, we can see that the Bitcoin network is entering a period of vigorous development. The monthly average of trading platform traffic is stable higher than the annual average, which is a good sign from the perspective of assets, indicating that more and more people are using Bitcoin.
Although some other on-chain activity indicators are still cooling down, this indicator is enough to show that Bitcoin’s dominant position is returning.
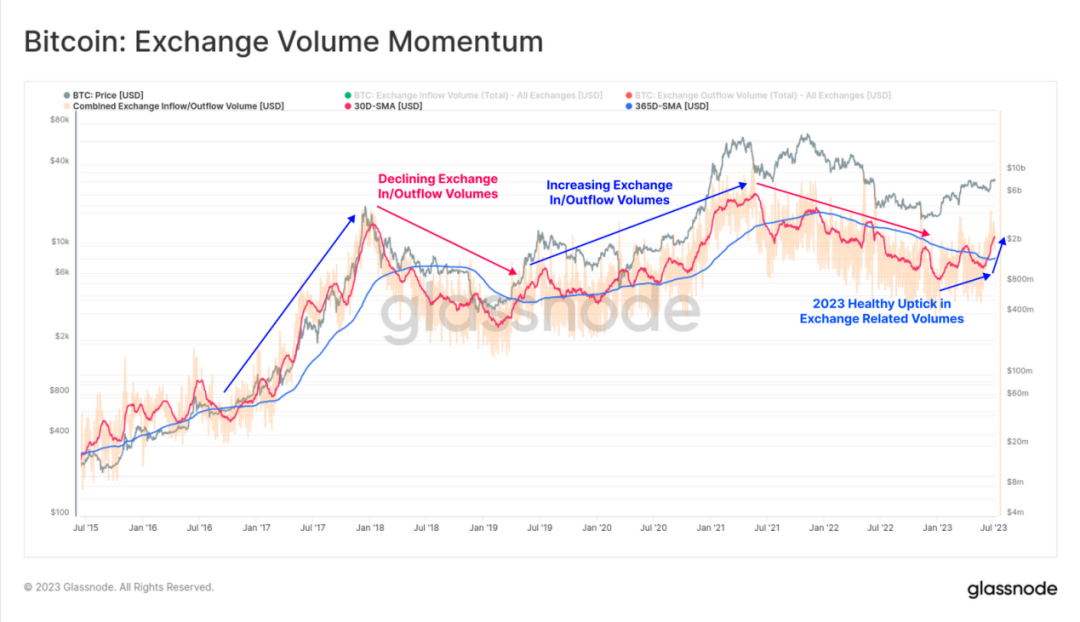
Figure 8: Trading platform traffic
From this activity related to trading platforms, we can establish an NVT price model. The model aims to provide a “fair value” for a given settlement of on-chain transaction volume.
The NVT price model short-term (28-day) fair value is $35,900, the first time this price has been above spot price since November 2022. The 90-day model has also risen sharply, from a level of $24,700.
On the other hand, the number of Bitcoin in the “loss” state has dropped to 47.9 million, similar to the numbers in July 2021 ($30,000), July 2020 ($9,200), April 2016 ($6,500), and March 2016 ($425).
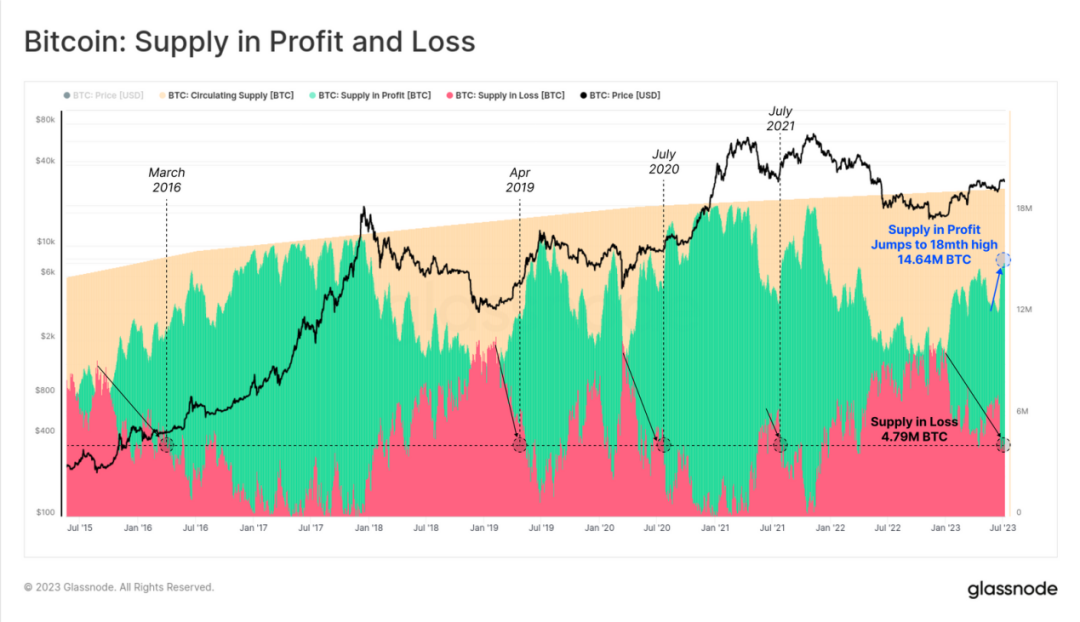
Figure 12: Bitcoin in "profit" and "loss" states
History always repeats itself
The data for Bitcoin always shows amazing similarities in different cycles. In the 2021-2022 cycle, the $30,000 price level can be seen as a “midpoint” and fluctuates around it to some extent.
In the 2013-2016 cycle, $425 was also a very similar “midpoint” to this cycle, as was $6,500 in 2018-2019. The “loss” supply at these price levels is highly similar.
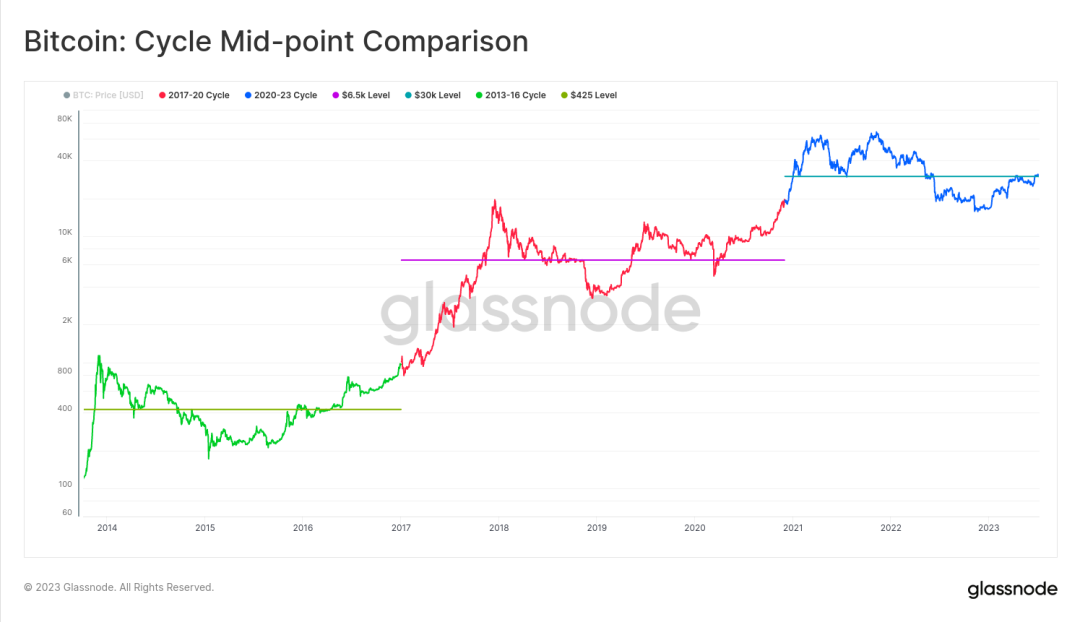
Figure 13: Comparison of cycle midpoints
As the market price consolidates below the $30,000 “midpoint,” we can see that about 75% of the total Bitcoin supply is in a profitable state, while 25% is in a loss state. This ratio is the same as when the price reached the midpoint in 2016 and 2019.
This 75:25 balance of profit and loss can also be seen as the overall balance point for Bitcoin. On all trading days, 50% of the trading days have a balance point above this point, and 50% have a balance point below this point.
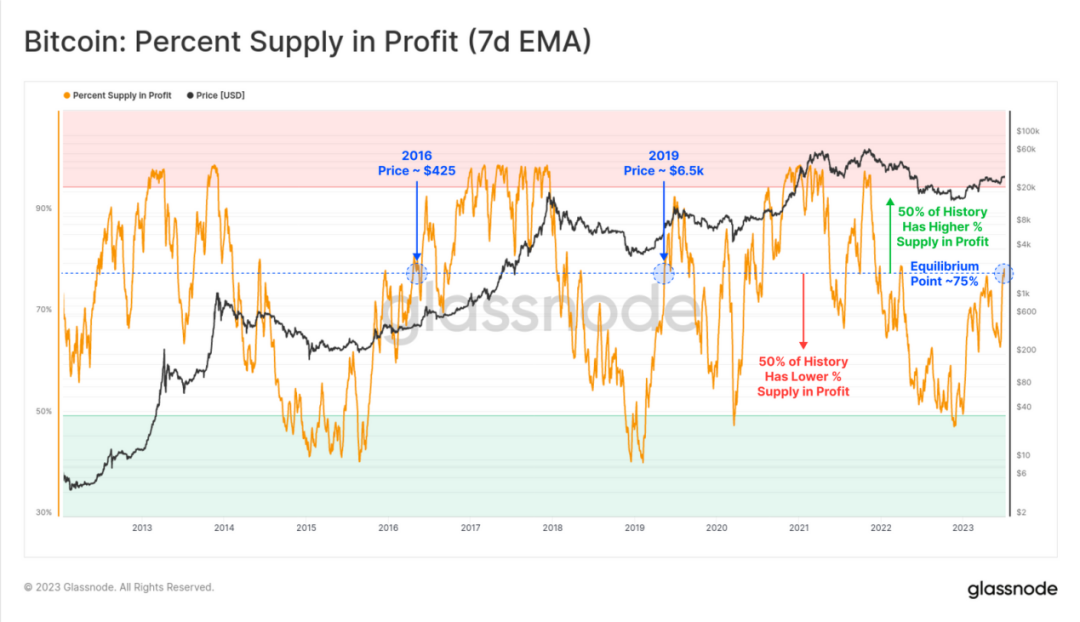
Figure 14: Profit supply percentage (7D)
In history, this balance point has lasted for a period of time, and many Bitcoin analysts refer to it as the “reaccumulation period.”
We can intuitively understand this by observing the proportion of market value of unrealized losses (purchased at a higher price than the market price but not yet sold) in the early bear market, where the market was in a state of loss and investors were gradually exiting. Subsequently, the profitability has rebounded sharply to the level similar to today.
The characteristic of the previous “reaccumulation period” was that it lacked a macro market direction and often lasted for several months at this point. Whether a long and tortuous process like this is still needed to break this balance point is still to be observed.
We will continue to update Blocking; if you have any questions or suggestions, please contact us!
Was this article helpful?
93 out of 132 found this helpful
Related articles
- Boring Ape’s decline continues, where should the NFT market break the ice?
- 2017 vs 2023: Fink’s Institutional Bitcoin Perspective
- What is the difference between the supervision and sharing agreement and the information sharing agreement, as institutions compete to include them in ETF filings?
- Will purchasing Bitcoin be a good move for a publicly traded company to enter the world of cryptocurrency?
- 6 Charts Reviewing Cryptocurrency Market Performance in Q2 2023
- Six Positioning Strategies in Current Financial Environment
- Market Trend Prediction and Potential Alpha: Inverse Finance and Symm


